U
NDEREMPLOYMENT
:
A
USTRALIA IN THE
1990
S
IANWATSON*
W
hat is the connection between wage inequality and underemployment? This article explores the question in two ways. First it presents a theoretical account based on Marx’s notion of the reserve army of labour, as developed in the work of Botwinick. Second, it presents the findings of a distributional analysis of the 1990 and 1997 Income Distribution Surveys. These findings show that wage inequality increased markedly between 1990 and 1997, particularly for men. Importantly, the bottom deciles experi-enced not only declining hourly earnings, but also declining access to hours of work. The result was a considerable decline in weekly earnings. The article concludes that Botwinick’s thesis concerning the reserve army of labour provides a promising avenue for deepening the analysis of wage inequality in the contemporary Australian labour market.There have been dramatic changes in the Australian labour market during the last two decades and they touch on the core industrial relations themes of earn-ings, working time arrangements and job security. In terms of earnearn-ings, there has been a growing polarisation in wages, something Australia has shared with most other western countries. In terms of hours of work, another kind of polar-isation has taken place: growing under-employment at the bottom of the labour market and lengthening in hours worked by those at the top. Finally, in terms of job security there has been a growth in precarious employment throughout the labour market, evident in growing rates of casualisation and other forms of non-standard employment, such as labour hire. How are these three issues linked? In the view of ACIRRT (1999), they represent the success of a neo-liberal agenda aimed at achieving increased flexibility in the deployment of labour and a general restructuring of the world of work in the interests of capital. By contrast, labour economists like Wooden (2000) downplay the extent of the changes in each area as well as their negative implications.
The scope of this article is different from these earlier accounts. I do not attempt to explore these three areas in the same systematic fashion which ACIRRT and Wooden have done. Nor do I consider job security in any detail, or venture far in terms of working time arrangements. Instead, this article aims to deepen the analysis of the linkages between wages and hours, particularly low wages and
underemployment. The core of my argument is that wages and hours of work are not separate dimensions, but operate in a cumulative fashion, and that the theoretical underpinnings for this insight already exist in Marx’s notion of the reserve army of labour. In particular, I set out in this article to test whether a classical Marxist analysis of wage inequality and underemployment—developed by Howard Botwinick (1993) during the early 1990s—finds any empirical sup-port from contemporary Australian labour market data.
The structure of my analysis does not follow the logic of testing an hypothesis. Nor do I consider rival interpretations for the same empirical results (though I do comment, in passing, on whether the data supports human capital explan-ations). Rather, my approach is one of exploring whether there is consistency between parts of Botwinick’s theoretical framework and empirical developments. I take this approach because I regard the Botwinick thesis as the most theoretic-ally rigorous explanation for growing wage inequality and the most promising avenue for deepening the analysis in this important area.
SECTION1: DISCUSSION
Wage inequality has increased in most western countries since the 1970s. Australia has not been immune from this, though the changes here have not been as dramatic as those in the United States and the United Kingdom (Katz & Murphy 1992; Blau & Kahn 1996: 793 n. 5; Dinardo et al.1996; Freeman 1996; Burtless 1998: 7; Gosling et al.2000; Waltman 2000: 37). Useful accounts of wage inequal-ity in Australia exist for the 1970s (Norris 1977), for the 1970s to 1980s (King et al.1992; McGuire 1993), and for the 1970s to mid-1990s (Borland 1999; Norris & McLean 1999).
Most of the explanations for growing wage inequality within the field of labour economics have been based on a neo-classical economics framework. They com-monly employ human capital theory, or some other similar perspective concerning differential ‘returns to skill’ amongst the workforce.1One of the most common
neo-classical explanations for the dramatic growth in inequality during the 1970s and 1980s has been the impact of ‘skill-biased technological change’. In the words of Danziger and Gottschalk:
Technological change which raises the productivity of older and more-educated workers faster than that of younger and less-educated workers is consistent with increases in both relative wages and relative employment of more-skilled labor. If workers with more education are more productive, then firms will hire more of them in spite of their higher costs (quoted by Galbraith 1998: 26).
Galbraith provides a comprehensive critique of this position, which he labels ‘the skills fallacy’. He notes succinctly that the timing for this argument is all wrong and that ‘the actual diffusion of computers occurred after the rise in skill or education premiums’ (1998: 35), and he then proceeds to list three other major reasons why the computer revolution cannot explain rising inequality:
(2) it does not explain ‘the distribution of rising inequality across sectors, contrary to relative productivity movements, that apparently occurred in the early 1980s’; (3) finally, it does not explain the increase in earnings premiums to experience and
unobserved characteristics which began in the early 1970s. (Galbraith 1998: 35). In rejecting the ‘skills fallacy’ Galbraith also rejects the model of the competi-tive labour market which human capital theory embraces. In its place he argues for the role of monopoly power:
The distribution of monopoly power matters little in a world of stable full employ-ment. But outside that world, in the one where we actually live, the stronger and more erratic the business cycle, the greater the swings of unemployment, the weaker through time is the bargaining position of small and competitive businesses and of unorganized production workers. Wage structures erode from the bottom. Low-wage workers are the first to give ground in hard times… Unemployment and capital turnover are the anvil and hammer between which a stable structure of relative wages can be beaten apart (1998: 49).
Ultimately Galbraith settles on unemployment as the driving force behind the growth of inequality during the last quarter century. His major argument is that the onset of recessionary cycles since the 1970s has coincided with increasing levels of wage inequality in the US labour market. This has been compounded by poor monetary policy, an over-valued currency, and political resistance to raising the minimum wage (1998: 8–9).
While Galbraith emphasises unemployment, other American researchers have made the link between inequality and underemployment. McCall, for example, analyses the operations of local labour markets in the United States and finds that the growth of ‘flexible’ and insecure employment in local markets has been a crucial factor in generating labour market inequality:
High rates of joblessness, immigration, and casualization (part-time work, tempor-ary work, and unincorporated self-employment) exert significant positive effects on the level of residual wage inequality within labor markets (McCall 2000: 426).
While the work of researchers like Galbraith and McCall provide a useful depar-ture from the assumptions of neo-classical economics, their analyses do not go far enough. In particular, the generative mechanisms linking underemployment and wage inequality are not revealed in a rigorous fashion. For example, Galbraith relies on a ‘monopoly power’ argument to contradict the perfect competition assumption of neo-classical labour economics, but as Botwinick (1993) shows, the notion of ‘imperfect competition’ favoured by institutionalists (like Galbraith) is simply the other side of the coin to this neo-classical model. Both are unable to grapple with ‘real capitalist competition’ and the crucial part this plays in estab-lishing persistent wage inequalities.2
Competition, not the lack of it, is the source of instability, crises, and uneven development. This analysis of competition is the antithesis of the neoclassical approach, in which competition is the source of equilibrium and evendevelopment (Weeks 2001: 16).
Far from generating equilibrium and convergence, real capitalist competition brings about the uneven development of productive forces within an industry because the profit motive delays the adoption of new techniques until the capi-tal value of existing techniques has been exhausted (Weeks 2001: 17). As we will see below, this uneven development is also responsible for differential wage rates within industries.
Turning to the labour market, the neo-classical model again assumes equilib-rium tendencies. It is premised on perfect competition, perfect mobility of labour and self-adjusting wage rates. In the same way that unemployment should not exist in this idealised model, so too should wage differentials diminish over time. Where either of these persist, neo-classical theorists argue that imperfect mobil-ity of labour must exist. By way of contrast, as far back as 1951, Reynolds argued that the ‘chronic underemployment of labour’, and not its ‘imperfect mobility’ was responsible for continuing wage differentials (see Botwinick 1993: 112).
The most systematic development of this line of argument can be found in Botwinick’s impressive study Persistent Inequalities: Wage Disparity under Capitalist Competition (1993). The remainder of this section will draw on this analysis to highlight the theoretical connection between underemployment and wage inequality.
Botwinick’s starting point is Marx’s theory of the dynamics of capital accu-mulation: the extraction of surplus value under conditions of capitalist competition and the relentless expulsion of living labour from production through processes of mechanisation. In particular, the ‘uneven development of technical change’ leads to differential wage rates acrossindustries. Using the contrast between ‘real capitalist competition’ and the idealised notion of competition within neoclassi-cal economics, Botwinick argues:
. . . neoclassical economics conveniently assumes that capitalist competition and full employment will create equitable wages and working conditions across all industries as capitalist firms are forced to compete in order to hold onto a stable workforce. Yet, within Marx’s more realistic analysis of chronic underemployment, capitalists are rarely forced to provide equitable wages. On the contrary, inhuman hours, miserable wages, and extremely unhealthy working conditions become the basisfor capitalist competition within many of these low-wage sectors (1993: 118).
For workers the uneven spread of technical change produces conditions of chronic unemployment and underemployment: the constant reproduction of a reserve army of labour. This reserve army is not a cyclical phenomenon, a reflec-tion of deficient demand in the economy, but is continually generated by three dynamics:
(1) changes in the rate of accumulation (the rate of growth of capitalist investment); (2) changes in the organic composition of capital (the capital-labour ratio in value terms);
and
(3) changes in the labour force participation of the potential working population (Botwinick 1993: 74)
The reserve army is itself composed of several different segments whose condi-tions of life reflect the profound changes which capital accumulation imposes on different sectors of the workforce. Botwinick’s summary of these segments (1993: 96–99) is based on Marx’s nineteenth century examples, but a parallel to con-temporary Australia can also be drawn:
• the floating segment—those with interrupted spells of employment in the ‘centres of modern industry’.
• the latent surplus population—those who are ‘constantly on the point of pass-ing over into . . . the proleteriat’. In Marx’s day the agricultural population filled this role; in the last half century women have regularly moved between the latent and floating segments.
• the stagnantsegment—composed of those who have become surplus through modernisation of industry, particularly those in ‘decaying branches of indus-try’. The fate of rural and regional areas of Australia, and Australia’s post-war blue-collar migrants, come to mind.
• the paupersegment—those unable to work on a steady basis, through illness, disability or demoralisation. Again, Australia’s poorest working class suburbs come to mind, with sub-populations composed of the long-term employed, ex-prisoners, the homeless, and those addicted to drugs and alcohol. The existence of the reserve army of labour creates conditions of constant competition for the employed workforce, particularly the lowest paid. Efforts by workers themselves to build shelters from competition play an important role in segmentation (see, for example, Freedman 1976). While this contributes to differential wage rates, it is primarily the conditions of capitalist competition— particularly differential rates of profit between firms and industries—which is fundamental to the persistence of wage differentials. The full elaboration of this argument is beyond the scope of this paper, though it is worth noting that Botwinick develops the important conceptual notion that the conditions of capitalist competition between firms and industries sets the ultimate limits within which wage differentials will range (captured in his phrase: ‘the system-atic variation [of wages] within limits’, 1993: 258). Thus, although Botwinick emphasises the importance of working class solidarity and trade union activity in determining wage levels, his account does not suffer from the problems of indeterminancy which are evident in much of the institutionalist literature.
levels, whilst in the backward sectors the presence of the reserve army sets the lower limit. The critical issue for this article is Botwinick’s argument about the interconnections of low wages, underemployment and the reserve army:
. . . chronic underemployment is the normalcondition within the aggregate labor market . . . labor mobility is no longer a sufficient condition for the equalization of wage rates . . . low-wage firms . . . continue to find ample sources of cheap labour within the reserve army. Consequently, there will tend to be little upward pressure on wage rates at the low end of the labor market (Botwinick 1993).
Those workers who ultimately exert a downward pressure on above-average wage rates primarily come from various components of the reserve army. Thus these workers not only come from the chronic low-wage (or stagnant) sectors of the economy, but from the latent and floating sectors of the reserve army as well. More important, the actual pressure on above-average wage rates does not arise from the high-wage sector’s gradual extension of employment along the margin. Rather, it comes from the actual or potential replacement of the high-wage workersby these cheaper and generally more desperate workers within the reserve army (Botwinick 1993: 111, 113).
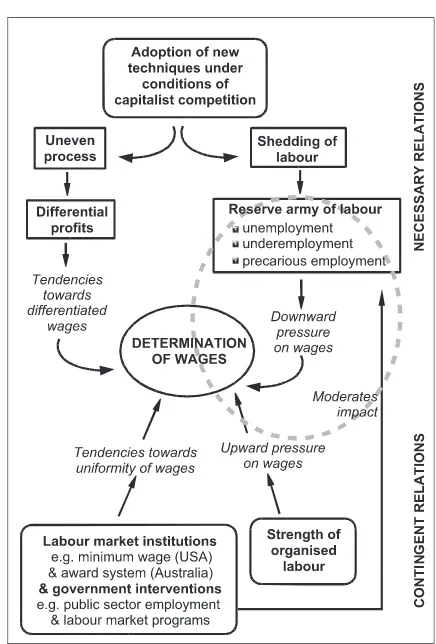
Botwinick’s classical Marxist account provides a far more rigorous account of the generative mechanisms connecting wage inequality and underemployment than those accounts found within either neo-classical labour economics or the institutionalist tradition. His account (with some supplementation) provides a use-ful model for wage determination in a capitalist economy, shown as Fig. 1 below. (This model draws on the important critical realist distinction between neces-sary and contingent relations. See Bhaskar 1989; Sayer 1992; Collier 1994). Figure 1 shows how the uneven adoption of new techniques of production under conditions of real capitalist competition set up necessary tendencies towards dif-ferentiated wages. These can be offset to some extent by contingent aspects of the labour market, such as labour market institutions like the award system which produce tendencies towards greater uniformity in wage outcomes. The right hand side of the model captures one aspect of the reserve army of labour, its tendency to exert downward pressure on wages. At the same time, the strength of organ-ised labour exerts upwards pressure on wages, as does the role of public sector employment (either through setting ‘benchmark’ wages) or through job creation schemes for the unemployed. The actual pattern of wage determination—the degree of differentiation in wages at any particular historical moment—will hinge on how these various tendencies and pressures interact, and can only be assessed by empirical investigation.
explore whether recent Australian labour market data supports Botwinick’s argu-ments about the linkages between underemployment and low wages.
SECTION2: EMPIRICAL FINDINGS
There is little doubt that the last two decades in Australia have been characterised by increased capitalist competition, both amongst domestic producers and from foreign competitors. Technological change has also been rapid and extensive over this period. At the same time, structural unemployment and underemployment have grown considerably, as has the spread of precarious employment. Clearly the material conditions for exploring the Botwinick thesis are in place. What remains to be done is to look more closely at the growth of underemployment, at the operations of the reserve army of labour, and at the connection between hours of work and growing wage inequality. In this section I undertake these tasks. In the conclusion I examine whether these empirical findings are consistent with the Botwinick thesis.
Underemployment
The Australian labour market in the 1990s has been characterised by continuing high levels of unemployment and growing levels of both underemployment and precarious employment (Campbell 1996; Burgess & Campbell 1998; Campbell & Brosnan 1999). Some of this represents the continuation of trends which began in the 1980s (for example, casualisation) whilst some of it is quite novel in its emergence (such as the rapid growth in labour hire and its expansion into non-traditional areas, Watson et al. 1999; Hall & Bretherton 2000). These trends partly reflect longer term compositional change—particularly the growth in service industries—but they also reflect substitution strategies by employers: deliberate cost-saving measures which replace full-time staff with part-time staff, or per-manents with casuals or agency workers.
The result of these trends is evident in Table 1. In summary, this table shows that by the year 2000, employment levels—captured in the employment-population ratio—had recovered to 1990 levels, but most other measures reflect-ing the availability of full-time, stable employment showed deterioration. Full-time employment had not recovered to 1990 levels and underemployment had grown considerably. Finally, casualisation of the workforce, which had been growing steadily during the 1980s, continued unabated.
The steady growth in part-time work over the last two decades has been viewed by some labour economists as benign, as expressing the preferences of new labour market entrants for part-time work. However, what this view overlooks is the fact that part-time work has spread extensively into non-service areas such as manufacturing, and has engulfed demographic groups who traditionally always took up full-time work (such as male and female youths). The idea that the growth of part-time work reflects people’s working-time preferences proves illusory on closer examination.
ABS statistics (1997a) which examine respondents’ reasons for part-time work are split between work-related and non-work-related reasons (family reasons, study and lifestyle considerations). Amongst women, about 18 per cent of part-time workers gave family reasons as the motivation for working part-part-time. Amongst men, the comparable figure was fairly insignificant. For men, studying
Table 1 Key labour market indicators for the availability of work, Australia 1990 and 2000
Indicator 1990(%) 2000(%)
Employment : population ratio (as a percentage) 60 60
Full-time employment : population ratio (as a percentage) 47 45 Under-employment (percentage of part-time workers
wanting more hours) 19 25
Casuals (as a percentage of all employees) 20 26
was much more important, and about 22 per cent of part-time workers gave that reason. But, overwhelmingly, for both men and women, the reasons most people worked part-time were work-related, either because there was not enough work available, or the job was only offered as a part-time job. In the case of men, these work-related reasons were given by 61 per cent of part-time workers. For women, the comparable figure was 47 per cent. Looking at the sub-categories more closely, amongst men the ‘not enough work available’ reason accounted for 31 per cent, and ‘job is only part-time’ accounted for 26 per cent. The com-parable figures for women were 16 per cent and 28 per cent (ABS 1997a). These figures suggest that large amounts of part-time work exist because that is what employers offer. As Table 1 shows, one-quarter of part-time workers wanted more hours—a direct measure of underemployment—but a far larger proportion would probably have taken up more work if it were on offer—an indirect measure of underemployment.
The categories of the reserve army of labour are clearly more insightful than are concepts which focus on working time preferences. As mentioned earlier, a more useful analysis would see the steady movement of women into part-time work as a movement from the latent to the floating sectors. At the same time, changes in the welfare state, and in labour market programs, have attempted to move people from the stagnant and pauper sectors into the floating sector. As Francis Castles recently argued, the dismantling of the post-war welfare system has seen a major reversal in welfare ideology. As well as its designation as a ‘wage earners welfare state’, Australia was unique in explicitly rejecting Britain’s Poor Law tradition in favour of the notion that welfare was a citizen right rather than an act of charity (Castles 2001: 54). However, from the mid 1980s onwards, access to welfare on the basis of category entitlement has been steadily eroded in favour of more administrative discretionary procedures, and ‘mutual obligation’ has become the latest incarnation of the nineteenth century ideology of the ‘deserv-ing poor’.
These changes have been particularly targeted at the long-term unemployed. Within the broader ideology of the OECD’s ‘active labour market’ philosophy, attempts have been made to integrate the long-term unemployed into the frictionally unemployed. By way of a carrot, the unemployed have been allowed to retain benefits while working indefinitely in part-time and casual work. By way of a stick, the work test has become more onerous and ‘breaching’ the unem-ployed (depriving them of benefits) for minor infractions has become routine. These measures have attempted to revitalise the stagnant and pauper sectors of the reserve army and facilitate movement into the floating sector.
onwards this competition has intensified, particularly in the trade-exposed sec-tors of the economy, and cost cutting strategies aimed at labour intensification have been prevalent. As Morehead et al. (1997) and ACIRRT (1999) show, the first half of the 1990s saw major organisational restructuring and workplace change aimed at lifting firm profitability. Many of these changes led to increased work intensification—thereby weakening labour demand—as well as the dis-mantling of traditional working time arrangements which had protected full-time, permanent employment.
Wage inequality and hours of work
Wage inequality can be analysed using summary measures of dispersion, such as the Gini coefficient, the Theil index, or the coefficient of variation. However, in the following analysis I take a different approach, namely, an examination of the distribution of wages by deciles. This has the advantage that changes in wage inequality are readily discernible by comparing the earnings between the top and bottom deciles (as well as the middle deciles). This approach has the further advan-tage of revealing other relevant characteristics of each decile: particularly the hours worked, the proportion of part-time workers, and the industry composition. The data for this exercise comes from confidentialised unit record files (CURFs) from the Australian Bureau of Statistics (ABS) income distribution surveys carried out in 1990 and 1997 (abbreviated to IDS). This data allows us to distinguish between wage and salary income and income from other sources. Actual dollar amounts are collected (rather than bracketed amounts), so the earnings data overall is quite accurate. The populations analysed have been carefully chosen: adult employees not working in agriculture. This eliminates some of the distortions emanating from junior rates and from farmer ‘employees’ and farm-family ‘employees’. In addition, the IDS populations are further restricted to those employees whose main source of annual income was wages and salaries. Finally, the earnings mea-sures have been indexed by the CPI to provide 1997 dollars (and the hourly wage measures have excluded those earning below $2 per hour and over $100 per hour). For much of the analysis which follows, separate data for males and females is presented. This reflects not only the importance of enduring gender segmen-tation in the Australian labour market, but also the fact that changes in earnings during the 1990s followed quite different trajectories for men and women and it is important to map these closely. Overall, the earnings for low income men deteriorated sharply, while the earnings for high income men increased markedly. For women, the changes have been much less dramatic: those at the bottom have not gone backwards to the same extent that low paid men have, but neither have women at the top accelerated away as the men have.
of low paid women. But direct comparison along gender lines on almost any criterion would still highlight the persistence of deep gender inequality. The fundamental disadvantages which women face in the labour market have not evap-orated simply because more men have joined them in the ranks of the low paid workforce.
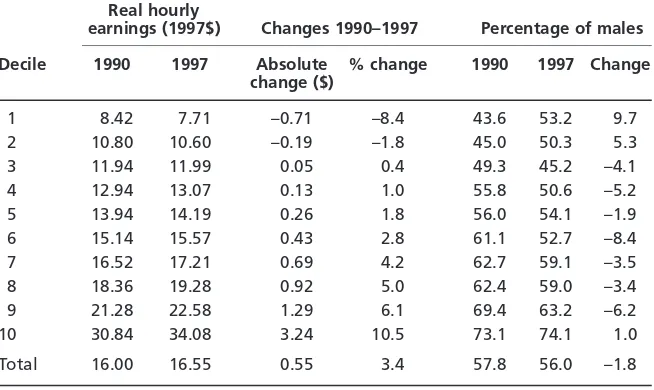
Before examining the earnings data with gender breakdowns, it is worth briefly looking at the aggregate picture. Table 2 shows average hourly earnings for persons, broken down by decile, as well as the gender composition of each decile. Table 2 shows that the two bottom deciles of wage earners suffered losses in real hourly earnings over this period, the next three deciles had either static or mod-est increases in their real earnings, and the top five deciles had increases rang-ing from just on 3 per cent to nearly 11 per cent. The bottom and the top deciles stood out quite sharply: members of the bottom decile suffered an 8.4 per cent decline in their real hourly earnings, whilst those in the top decile saw their real hourly earnings increase by 10.5 per cent. Also noteworthy is a dramatic change in the gender composition of the two bottom deciles. In 1990 men made up about 44 per cent of the bottom decile and 45 per cent of the second decile. By 1997 these figures had risen to 53 and 50 per cent respectively. For the bottom decile, this was an increase of nearly 10 percentage points, or 22 per cent in relative terms.
While the aggregate picture is useful for an overview (and for highlighting the changing gender composition at the bottom of the earnings distribution), much
Table 2 Changes in real hourly earnings, persons, Australia 1990 and 1997
Real hourly
earnings (1997$) Changes 1990–1997 Percentage of males
Decile 1990 1997 Absolute % change 1990 1997 Change change ($)
1 08.42 07.71 –0.71 –8.4 43.6 53.2 09.7
2 10.80 10.60 –0.19 –1.8 45.0 50.3 05.3
3 11.94 11.99 00.05 00.4 49.3 45.2 –4.1
4 12.94 13.07 00.13 01.0 55.8 50.6 –5.2
5 13.94 14.19 00.26 01.8 56.0 54.1 –1.9
6 15.14 15.57 00.43 02.8 61.1 52.7 –8.4
7 16.52 17.21 00.69 04.2 62.7 59.1 –3.5
8 18.36 19.28 00.92 05.0 62.4 59.0 –3.4
9 21.28 22.58 01.29 06.1 69.4 63.2 –6.2
10 30.84 34.08 03.24 10.5 73.1 74.1 01.0
Total 16.00 16.55 00.55 03.4 57.8 56.0 –1.8
Source:Unpublished IDS 1990, 1997.
greater insights are possible when the results are disaggregated by gender. This is done in the main analyses which follow.
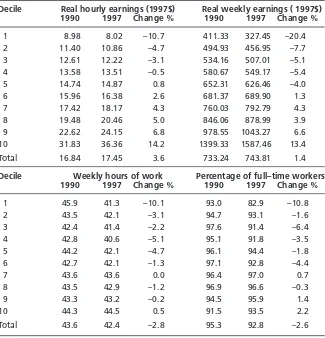
In the period from 1990 to 1997 most of the dramatic changes in earnings took place at the bottom and top of the distribution and there were important differences between what happened to hourly earnings and weekly earnings. Table 3 shows that workers in the bottom decile saw their real hourly earnings fall by 11 per cent, while their weekly earnings fell by 20 per cent. Part of the reason for this outcome lies in the amount of work which the bottom decile under-took. As Table 3 also shows, the bottom decile reduced its hours of work by 10 per cent between 1990 and 1997. Part of this was an actual drop in hours
Table 3 Changes in hourly and weekly earnings, hours of work and full-time status, males, Australia 1990 and 1997
Decile Real hourly earnings (1997$) Real weekly earnings ( 1997$) 1990 1997 Change % 1990 1997 Change %
1 08.98 08.02 –10.7 0411.33 0327.45 –20.40
2 11.40 10.86 0–4.7 0494.93 0456.95 –7.7
3 12.61 12.22 0–3.1 0534.16 0507.01 –5.1
4 13.58 13.51 0–0.5 0580.67 0549.17 –5.4
5 14.74 14.87 000.8 0652.31 0626.46 –4.0
6 15.96 16.38 002.6 0681.37 0689.90 01.3
7 17.42 18.17 004.3 0760.03 0792.79 04.3
8 19.48 20.46 005.0 0846.06 0878.99 03.9
9 22.62 24.15 006.8 0978.55 1043.27 06.6
10 31.83 36.36 014.2 1399.33 1587.46 13.4
Total 16.84 17.45 003.6 0733.24 0743.81 01.4
Decile Weekly hours of work Percentage of full–time workers 1990 1997 Change % 1990 1997 Change %
1 45.9 41.3 –10.1 93.0 82.9 –10.8
2 43.5 42.1 0–3.1 94.7 93.1 0–1.6
3 42.4 41.4 0–2.2 97.6 91.4 0–6.4
4 42.8 40.6 0–5.1 95.1 91.8 0–3.5
5 44.2 42.1 0–4.7 96.1 94.4 0–1.8
6 42.7 42.1 0–1.3 97.1 92.8 0–4.4
7 43.6 43.6 000.0 96.4 97.0 000.7
8 43.5 42.9 0–1.2 96.9 96.6 0–0.3
9 43.3 43.2 0–0.2 94.5 95.9 001.4
10 44.3 44.5 000.5 91.5 93.5 002.2
Total 43.6 42.4 0–2.8 95.3 92.8 0–2.6
Source:Unpublished IDS 1990, 1997.
worked (for full-timers, the reduction was about 2 hours per week) but most of the change came from a greater spread of part-time work in the bottom decile. The proportion of full-time workers in this decile dropped from 93 per cent to 83 per cent in the period between 1990 and 1997, a relative decline of nearly 11 per cent. In other words, the lowest decile not only experienced a large drop in their hourlyearnings, but their weeklyearnings declined even more sharply, largely because their access to work was considerably reduced.
Nowhere else in the earnings distribution are the changes in working time as dramatic as for those in the bottom decile. There is, nevertheless, a distinctive pattern amongst the four bottom deciles: real hourly earnings decline, weekly earnings decline to a greater extent, and access to work shrinks. By way of con-trast, the story is reversed at the top of the distribution. Workers in the top decile saw their hourly earnings increase in real terms by 14 per cent, whilst those in the 7th to 9th deciles averaged increases of over 5 per cent. Unlike those in the bottom deciles, their hours of work remained largely unchanged, so the outcomes for weekly earnings closely matched the outcomes for hourly earnings.
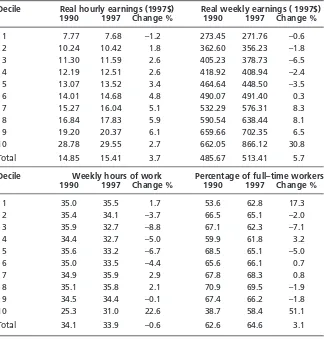
In the case of women, the results are strikingly different at the very top and bottom (Table 4). While there is some decline in hourly earnings for the bottom decile, it is small (just over 1 per cent) compared to the situation for men in the bottom decile (at 11 per cent) and for every other decile above, there are small increases. Moreover, there is no dramatic expansion in hourly earnings at the very top of the hourly distribution. The highest decile experienced only a 3 per cent increase (compared to the male figure of 14 per cent). There is, however, a parallel between men and women in deciles 7, 8 and 9, where the female average increase of about 6 per cent broadly matched the male increases in the same deciles.
Turning to weekly earnings, the situation for women changes considerably. There is much more volatility in earnings, with declines in real earnings for the bottom half of the distribution (with decile 3 taking the largest drop of 7 per cent). Moreover, there is much more expansion in earnings at the top of the dis-tribution: weekly earnings in the top decile expand by a very large 31 per cent, and deciles 7, 8 and 9 experience increases averaging about 8 per cent. Again, as with the men, changing working time patterns are partly responsible for these changes. The very large increase in the weekly earnings of the top decile—whose increase in hourly earnings was quite modest—was matched by a 23 per cent jump in hours of work and a 51 per cent increase in the proportion of full-time workers.
this period. In the case of the bottom decile, a greater proportion of full-timers made up for some of this loss, but in the next two deciles the losses in hours worked was not offset by a change in the mix of part-time and full-time work.
The reserve army at ‘work’
While the emphasis in this section has been on the employed wage and salary workforce, it is also possible to examine part of the reserve army of labour by using the income distribution data. By focusing on those people whose main source of annual income was government social security benefits, a snapshot of the labour market activity of the floating segment of the reserve army can be taken. It remains
Table 4 Changes in real hourly and weekly earnings, hours of work and full-time status, females, Australia 1990 and 1997
Decile Real hourly earnings (1997$) Real weekly earnings ( 1997$) 1990 1997 Change % 1990 1997 Change %
1 7.77 7.68 –1.2 273.45 271.76 –0.6
2 10.24 10.42 1.8 362.60 356.23 –1.8
3 11.30 11.59 2.6 405.23 378.73 –6.5
4 12.19 12.51 2.6 418.92 408.94 –2.4
5 13.07 13.52 3.4 464.64 448.50 –3.5
6 14.01 14.68 4.8 490.07 491.40 0.3
7 15.27 16.04 5.1 532.29 576.31 8.3
8 16.84 17.83 5.9 590.54 638.44 8.1
9 19.20 20.37 6.1 659.66 702.35 6.5
10 28.78 29.55 2.7 662.05 866.12 30.8
Total 14.85 15.41 3.7 485.67 513.41 5.7
Decile Weekly hours of work Percentage of full–time workers 1990 1997 Change % 1990 1997 Change %
1 35.0 35.5 1.7 53.6 62.8 17.3
2 35.4 34.1 –3.7 66.5 65.1 –2.0
3 35.9 32.7 –8.8 67.1 62.3 –7.1
4 34.4 32.7 –5.0 59.9 61.8 3.2
5 35.6 33.2 –6.7 68.5 65.1 –5.0
6 35.0 33.5 –4.4 65.6 66.1 0.7
7 34.9 35.9 2.9 67.8 68.3 0.8
8 35.1 35.8 2.1 70.9 69.5 –1.9
9 34.5 34.4 –0.1 67.4 66.2 –1.8
10 25.3 31.0 22.6 38.7 58.4 51.1
Total 34.1 33.9 –0.6 62.6 64.6 3.1
Source:Unpublished IDS 1990, 1997.
a snapshot because the data is cross-sectional, so the picture is an under-estimate of the real movement between the employed labour force and the reserve army (though longitudinal data, discussed later, partly address this shortcoming).
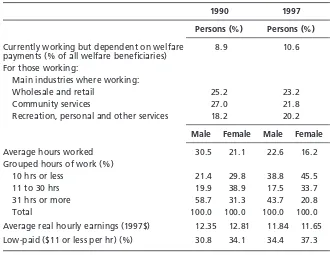
Table 5 shows that a consistent proportion of people whose main source of annual income was welfare benefits were actually employed at the time of the income distribution surveys in 1990 and in 1997. The figures were 9 per cent and 11 per cent respectively. The industries in which they predominantly worked were retail, community services and recreation/hospitality. The most important changes for these people during the period 1990 to 1997 involved both earnings and hours of work. Between these two years, their hours of work dropped dramatically: for men average hours of work fell from 31 hours per week to just 23 hours, while for women they fell from 21 to 16 hours. In terms of grouped hours of work, the percentage of men working 10 hours or less jumped from 21 per cent to 39 per cent, while the proportion working more than 31 hours fell from 59 to 44 per cent. A similar pattern occurred amongst the women: those working 10 hours or less grew from 30 to 46 per cent; and those working 31 hours or more fell from 31 to 21 per cent. Earnings also deteriorated in this period
Table 5 Selected work characteristics among social security beneficiaries, Australia 1990 and 1997
1990 1997
Persons (%) Persons (%)
Currently working but dependent on welfare 8.9 10.6 payments (% of all welfare beneficiaries)
For those working:
Main industries where working:
Wholesale and retail 25.2 23.2
Community services 27.0 21.8
Recreation, personal and other services 18.2 20.2
Male Female Male Female
Average hours worked 30.5 21.1 22.6 16.2
Grouped hours of work (%)
10 hrs or less 21.4 29.8 38.8 45.5
11 to 30 hrs 19.9 38.9 17.5 33.7
31 hrs or more 58.7 31.3 43.7 20.8
Total 100.0 100.00 100.0 100.00
Average real hourly earnings (1997$) 0012.35 012.81 0011.84 011.65
Low-paid ($11 or less per hr) (%) 30.8 34.1 34.4 37.3
Source: Unpublished IDS 1990, 1997.
but the changes were much weaker. For men, average real hourly earnings dropped from $12.35 to $11.84, while for women the drop was from $12.81 to $11.65. The proportion of low paid workers also rose slightly between 1990 and 1997. In summary, the presence of the floating segment of the reserve army in the Australian workforce grew slightly during the 1990s. Their earnings from work also deteriorated slightly. More significantly, however, underemployment for this group of workers grew dramatically during this period.
Something of the fluidity between the low paid workforce and the reserve army of labour is evident in an important longitudinal study of the unemployed, the ABS Survey of Employment and Unemployment Patterns (ABS 1997b). In their preliminary analysis covering the first 18 months of the study, the ABS found that considerable labour market ‘churning’—where people cycle in and out of work without finding a long-term secure job—was very strong during the mid 1990s. About 70 per cent of the job seekers found work in this 18 month period, but two-thirds of these jobs were casual and 90 per cent were temporary (1997b: 4–5). In more recent analysis of the survey, covering the full 3-year period, Dunlop drew the connections between this churning and the low paid workforce. She found that the transition to joblessness for the low paid was twice as great as for higher paid workers (2000: 24). At the same time, people who were not already employed also had a higher than average chance of taking up a low paid job, rather than a higher paid job (2000: 25). Dunlop reported similar findings from over-seas and cited work by Stewart and Swaffield who found strong evidence that among the low paid worforce there is a ‘cycle of low pay and no pay’ (2000: 29). Clearly, movement between the ranks of the reserve army and the low paid work-force was a characteristic feature of the 1990s.
CONCLUSIONS Explaining the changes
The empirical findings show that workers in the lowest deciles, particularly men, had reduced real earnings during the 1990s. Explaining this result in human capital terms does not lead very far. For example, educational qualifications had no impact on these changes. The most that can be said is that there was a small drop in the proportion of workers with no post-school qualifications in the bottom decile, something which is unlikely to reduce earnings there. The age com-position of the earnings distribution for men and women remained remarkably stable over this period. The one exception to this—a large increase in the pro-portion of women in their 20s in the bottom decile—is interesting, but explains very little since this decile saw very little change in earnings over the period.
about 23 per cent of the bottom decile. By 1997, this figure had dropped to just 15 per cent, whereas the decline across all deciles was only 2 percentage points. The pattern amongst women was equally pronounced. In 1990, female manu-facturing workers made up 16 per cent of the bottom decile; by 1997 this had dropped to just 8 per cent.3
What filled the gap in the bottom decile left by the decline in manufacturing jobs? For men it was largely hospitality, recreation and personal services, while among women the increase was in wholesale and retail trade. While this pattern is consistent with overall industry restructuring—the decline of manufacturing and the growth of the service sector—the extent of the changes among the lowest decile was much greater than it was across the distribution as a whole.
Changes in the composition of the lowest decile explain part of the decline in hourly earnings. Amongst men, manufacturing jobs were worth about 8 per cent more than jobs in recreation and personal services. Among women, they were worth 12 per cent more. Thus, while it is true that manufacturing jobs for women are low paid jobs (compared to the situation for men), they are, nevertheless, better paying jobs for the bottom decile than service sector jobs. From an hours perspective, these changes represent a loss of jobs in those industries which have traditionally provided full-time employment, alongside growth in the classic ‘underemployment industries’—retail, recreation and personal services. As long ago as 1993, Gregory highlighted this trend as one of the factors behind the ‘dis-appearing middle’ (Gregory 1993; see also Belchamber 1996).
Overall, the 1990s saw the bottom decile lose its better paying jobs, and it lost them to a far greater degree than occurred elsewhere in the earnings distribu-tion. Clearly, industry restructuring hit the low paid workforce more severely than the better paid sectors of the workforce. Meanwhile, at the top of the wages distribution, similar economic restructuring was at work. The big industry winner of the 1980s—the finance, property and business services sector—was largely responsible for driving wages inequality at the top. In 1990, among the top three deciles for men, this industry sector accounted for just over 40 per cent of all industries. By 1997, this figure had grown to nearly 60 per cent. Unpublished research by Watson (2000) on inter-industry inequality during the 1990s also showed that finance, property and business services was responsible for the largest amount of inequality amongst men.
Botwinick’s thesis
‘deindustrialisation’. Drawing this connection—across the economy—between wage rates and the reserve army in a more precise fashion remains an incom-plete task.
The ‘deindustrialisation’ explanation for the loss of better paid jobs is consis-tent with Botwinick’s analysis. As we saw earlier, he argued that industries are characterised by uneven levels of technical change and, contrary to the equilib-rium assumptions of neo-classical economics, Botwinick argues that less efficient producers continue to produce because of the pressure to prolong the life of their large fixed capital investments. As a result, wages and conditions in these indus-tries will be highly differentiated, with the least efficient producers paying the lowest wages. Eventually, however, conditions arise (such as the recession of the early 1990s and the intensification of international competition) in which the life of that ageing capital finally comes to an end. In Australia during the 1990s, manu-facturing firms with ageing capital have either exited from fabrication (in favour of importing and distributing); have relocated production to ‘greenfields’ sites overseas (such as China); or have closed down altogether. The result, within the labour market, has been increased unemployment among the manufacturing workforce. At the same time, many manufacturing firms have reconfigured their supply chains to reduce their core workforces and make greater use of smaller sub-contracting firms. The result, within the labour market, has been an increase in precarious employment and underemployment.
However, when we turn to the growth in service sector work and the way in which this development has led to high levels of underemployment alongside low wages, the Botwinick thesis is far less informative. While this article clearly did not explore the left side of Fig. 1, there is still a question mark over the extent to which contemporary developments in the service sector correspond with Botwinick’s analysis. For example, in what sense do processes of ‘technical change’ influence profits and wage levels outside manufacturing industries? On the one hand, the introduction of ATMs and phone banking within the banking sector, or of scanning machines within supermarkets, both parallel technical change within manufacturing. But what about the hospitality sector and retail more generally? Is there really a close connection between technical change and efficiency in production? Does the existence of differentiated profits and wages within these service industries derive from uneven conditions of technical development? Is the Botwinick thesis (and the classical Marxist account more generally) based too much on a manufacturing view of the world, and indebted too much to a reliance on technical change for its explanatory power? There is no denying that there is considerable variation in the efficiencyof service sector firms, but the role of technical change, and the part played by large scale fixed capital investment, appear more indeterminate than is the case with manufacturing. These concerns are particularly relevant when we consider that the main driver for inequality at the top of the labour market comes from the service sector, particularly financial services.
market. His insights into the processes of capital accumulation and the opera-tion of the reserve army of labour correspond closely with the empirical data for the 1990s. Integrating an analysis of the service sector into this framework remains a challenging task for future work.
NOTES
1. Other common neo-classical explanations for growing wage inequality include the growth of international trade; declines in trade union membership and organisational strength; and changes in the wage fixing system (especially the spread of enterprise bargaining).
2. In his discussion of ‘real capitalist competition’ Botwinick argues that even apparently ‘mono-polistic’ industries are, in fact, highly competitive. This derives from problems of exiting with large masses of fixed capital; the high degree of uncertainty which they face; and the vigorous struggles over market share in which they must engage (1993: 257).
3. Nor is it the case that manufacturing workers simply improved their earnings, vis-a-vis other industry groups. There are also declines in the manufacturing proportion within all of the lower deciles for both men and women.
REFERENCES
ABS (1997a) Working Arrangements. Australian Bureau of Statistics, Cat. No. 6342.0
ABS (1997b) Australians’ Employment and Unemployment Patterns 1994–1996. Australian Bureau of Statistics, Cat. No. 6286.0.
ACIRRT (Australian Centre for Industrial Relations Research and Training) (1999) Australia at Work: Just Managing. Sydney: Prentice Hall.
Belchamber G (1996) Disappearing middle or vanishing bottom? A comment on Gregory. The Economic Record72(218), 287–293.
Bhaskar R (1989) Reclaiming Reality: A Critical Introduction to Contemporary PhilosophyLondon: Verso. Blau FD, Kahn LM (1996) International Differences in Male Wage Inequality: Institutions
versus Market Forces. Journal of Political Economy104(4), 791–837.
Borland J (1999) Earnings Inequality in Australia: Changes, Causes and Consequences. The Economic Record75(229), 177–202.
Botwinick H (1993) Persistent Inequalities: Wage Disparity under Capitalist Competition.Princeton: Princeton UP.
Burgess J, Campbell I (1998) Casual Employment in Australia: Growth, Characteristics, A Bridge or a Trap? The Economic and Labour Relations Review9(1), 31–54.
Burtless G (1998) Rising Wage Disparity and U.S. Poverty: Recent Developments and Policy Responses. Presented to conference on: Fathers and Sons: The New Forms of Unemployment, May 8–9, Stresa, Italy.
Campbell I (1996) Casual Employment, Labour Regulation and Australian Trade Unions. Journal of Industrial Relations38(4), 571–599.
Campbell I, Brosnan P (1999) Labour market deregulation in Australia: the slow combustion approach to workplace change. International Review of Applied Economics13(3), 353–394. Castles F (2001) A farewell to Australia’s welfare state. Committee for Economic Development of
Australia Bulletin March, 53–55.
Collier A (1994) Critical Realism: An Introduction to Roy Bhaskar’s Philosophy. London: Verso. Dinardo J, Fortin NM, Lemieux T (1996) Labor Market Institutions and the Distribution of Wages,
1973–1992: A Semiparametric Approach. Econometrica64(5), 1001–1044.
Dunlop Y (2000) Labour Market Outcomes of Low Paid Adult Workers. ABS Occasional Paper. Canberra: Australian Bureau of Statistics Cat. No. 6293.0.00.005
Freedman M (1976) Labor Markets: Segments and Shelters. New Jersey: Allanheld, Osmun & Co. Publishers.
Freeman RB (1996) Labour Market Institutions and Earnings Inequality. New England Economic ReviewMay/June, 157–168.
Gosling A, Machin S, Meghir C (2000) The Changing Distribution of Male Wages in the U.K. Review of Economic Studies67, 635–666.
Gregory R (1993) Aspects of Australian and U.S. Hiring Standards: the Disappointing Decades, 1970–1990. The Economic RecordMarch, 61–76.
Hall R, Bretherton T (2000) ‘It’s not my Problem’: the Growth of Non-standard Work and its Impact on Vocational Education and Training in Australia. Melbourne: National Centre for Vocational Education Research.
Katz LF, Murphy KM (1992) Changes in Relative Wages, 1963–1987: Supply and Demand Factors. The Quarterly Journal of EconomicsFebruary, 35–78.
King J, Rimmer S, Rimmer R (1992) The Law of the Shrinking Middle: Inequality of Earnings in Australia 1975 to 1989. Scottish Journal of Political Economy 39, 391–412.
McCall L (2000) Explaining levels of within-group wage inequality in U.S. labor markets. Demography37(4), 415–430.
McGuire P (1993) Changes in Earnings Dispersion in Australia, 1975–1992. Presented to the 1993 Conference of Economists, Perth, September. Unpublished.
Morehead A, Steele M, Alexander M, Stephen K, Duffin L (1997) Change at Work: The 1995 Australian Workplace Industrial Relations Survey (AWIRS 95).South Melbourne: Longman. Norris K (1977) The Dispersion of Earnings in Australia. The Economic Record53, 475–89. Norris K, McLean B (1999) Changes in Earnings Inequality, 1975 to 1998. Australian Bulletin of
Labour25(1), 23–31.
Sayer A (1992) Method in Social Science: A Realist Approach.London: Routledge and Kegan Paul. Waltman J (2000) The Politics of the Minimum Wage.Urbana: University of Illinois Press. Watson I (2000) Inequality through the back door: industrial relations change and low wage jobs in Australia
during the 1990s. (unpublished draft mimeo, Australian Centre for Industrial Relations Research and Training, June).
Watson I, Briggs C, Buchanan J, Kinnear P (1999)New standards for new times: regulating non-standard employment in manufacturing. A Report for the Australian Manufacturing Workers Union. Unpublished mimeo.
Weeks J (2001) The Expansion of Capital and Uneven Development on a World Scale. Capital and ClassNo. 74, Summer.