Full Terms & Conditions of access and use can be found at
http://www.tandfonline.com/action/journalInformation?journalCode=vjeb20
Download by: [Universitas Maritim Raja Ali Haji] Date: 11 January 2016, At: 19:24
Journal of Education for Business
ISSN: 0883-2323 (Print) 1940-3356 (Online) Journal homepage: http://www.tandfonline.com/loi/vjeb20
The Bias in Favor of Venture Capital Finance in
U.S. Entrepreneurial Education: At the Expense of
Trade Credit
Thomas Clement, Steven LeMire & Craig Silvernagel
To cite this article: Thomas Clement, Steven LeMire & Craig Silvernagel (2015) The Bias in Favor of Venture Capital Finance in U.S. Entrepreneurial Education: At the Expense of Trade Credit, Journal of Education for Business, 90:5, 233-240, DOI: 10.1080/08832323.2015.1019820 To link to this article: http://dx.doi.org/10.1080/08832323.2015.1019820
Published online: 25 Mar 2015.
Submit your article to this journal
Article views: 48
View related articles
The Bias in Favor of Venture Capital Finance in U.S.
Entrepreneurial Education: At the Expense
of Trade Credit
Thomas Clement and Steven LeMire
University of North Dakota, Grand Forks, North Dakota, USA
Craig Silvernagel
South Dakota State University, Brookings, South Dakota, USA
The authors examine whether U.S. college-level entrepreneurship education demonstrates a bias favoring venture capital (VC) financing while marginalizing trade credit financing, and the resulting impact on entrepreneurship students. A sample of U.S. business textbooks and survey data from entrepreneurship students reveals a significant bias toward VC at the expense of trade credit. Despite this overexposure to VC, students only indicate a very basic understanding of how VC works. These findings suggest that business educators are doing a poor job by favoring a complex and rare finance method such as VC over a widely used and accessible source such as trade credit.
Keywords: entrepreneurial finance, entrepreneurship, trade credit, venture capital
Entrepreneurship has established itself as a major compo-nent of business education across the United States (Katz, 2003; Kuratko, 2005). Here we examine the extent to which entrepreneurship education favors VC as a method of finance and if that bias marginalizes more accessible meth-ods such as trade credit. Trade credit is a widely used source of debt financing impacting most business models (Berger & Udell, 1998; Petersen & Rajan, 1997; Wilner, 2000). In contrast, venture capital (VC), a form of private equity financing, is used by a very small percentage of firms (Bygrave & Zacharakis, 2008; Lerner, Leamon, & Hardy-mon, 2012; Metrick & Yasuda, 2011). There is evidence that VC is overexposed to students in textbooks and class-room curriculum relative to other finance sources such as trade credit. What is unknown is the extent of the bias in curriculum and how it may be impacting students. The criti-cal need for this study is to expose a misalignment between theory and practice, where students receive an overwhelm-ing message in textbooks and classroom materials, and yet, encounter a far different reality when entering the business
market to launch a venture. To test the proposed bias and resulting incongruities among students, we examined popu-lar business textbooks for space dedicated to trade credit versus venture capital. We also distributed a survey to stu-dents at 11 U.S. universities measuring student’s exposure to VC and trade credit. In addition, the survey posed ques-tions about very basic trade credit and VC concepts not to demonstration formal learning, but rather to gauge whether students are gaining any understanding of these two finance methods in coursework.
LITERATURE REVIEW
Capital financing for entrepreneurs can be classified three ways: equity, debt, and bootstrapping (Barringer & Ireland, 2012; Kuratko, 2014; Rogers, 2009). Equity financing, including VC, occupies a specific financial position on the balance sheet of a company (Weygandt, Kimmel, & Kieso, 2012) and encompasses raising capital in exchange for an ownership stake (Kuratko, 2014; Rogers, 2009). Debt financing, including trade credit, involves borrowing money or another asset from a third party with a promise to pay plus, in some cases, a user’s fee in the form of interest
Correspondence should be addressed to Thomas Clement, University of North Dakota, Department of Entrepreneurship, 293 Centennial Drive, Stop 8098, Gamble Hall Room 110, Grand Forks, ND 58202-8098, USA. E-mail: [email protected]
ISSN: 0883-2323 print / 1940-3356 online DOI: 10.1080/08832323.2015.1019820
(Kuratko, 2014; Rogers, 2009). Debt is also shown on a company’s balance sheet as a liability (Weygandt et al., 2012). Finally, bootstrapping is raising capital for a venture through nontraditional finance sources. Examples of boot-strapping could include (a) trade and barter and (b) off-bal-ance sheet activities such as borrowing capital assets from acquaintances (Bhide, 2000; Kuratko, 2014; Van Auken, 2004; Winborg & Landstr€om, 2001).
Contrary to popular belief (Kuratko, 2014), the majority of new businesses launched in the United States have very little innovation or novelty (Reynolds, 2005; Shane, 2008). In fact, among the highest growth startup companies in the United States, only about 10% sell something unique that no one else offers (Bhide, 2000; Shane, 2008). Studies also demonstrate that the historical average sales of small, self-employed firms is usually under $100,000 a year (Bitler, Moskowitz, & Vissing-Jørgensen, 2005; Shane, 2008) and
more than 80% of these entrepreneurs report they have little intention of pursuing measurable growth (Shane, 2008; van Gelderen, Thurik, & Bosma, 2005).
These statistics on U.S. entrepreneurs show that a major-ity of entrepreneurial ventures do not seek to produce highly innovative products or services or to develop a rap-idly growing business. The profile of typical U.S. entrepre-neurs plays an important role in this study in determining which type of financing most entrepreneurs pursue and manage. Much of the misconception involving the realities of entrepreneurial finance appears to stem from how infor-mation is delivered through textbooks and curriculum.
Textbooks and Course Curriculum
Ornstein (1994) stated that “textbooks have come to drive the curriculum” (p. 70) and argued that reliance on text-books in curriculum development is a perpetuation, because many teachers are also educated and guided by the text-book. Despite a perceived superior U.S. educational sys-tem, modern teachers are not trained properly and do not have adequate time to develop new curriculum, and there-fore, depend heavily on texts to provide course content (Ornstein, 1994).
Similarly, Kauffman, Moore Johnson, Kardos, Liu, and Peske (2002) found that reliance on textbooks in course or curriculum development is often a result of desperation on the part of teachers. While Lattuca and Stark (2009) argued that textbooks are “cultural artifacts” (p. 10), they recognize that many higher education faculties rely on textbooks for organization and sequencing of a course based on, for example, a table of contents.
Trade Credit
Trade credit financing or the ability to acquire goods and services without having to immediately pay, is the largest source of short-term debt financing in the United States and
is considered, by some, to also be a source of bootstrapping (National Small Business Association, 2008; Rogers, 2009; Wilner, 2000). Petersen and Rajan (1997) noted that trade credit is “the single most important source of short-term external finance for firms in the United States” (p. 661), and that the use of trade credit has been traced as far back as about 1,000 B.C. (Cheng & Pike, 2003; Christie & Bracuti, 1981). The amount of trade credit outstanding is, histori-cally, double that of other short-term credit sources (Wilner, 2000), and about 20% of businesses use it as their exclusive source of finance (Cole, 2010).
Trade credit is synonymous with credit terms such as “2/10 net 30” on a sales invoice (Ng, Smith, & Smith, 1999; Weygandt et al., 2012) with almost two thirds of credit terms falling between 21 and 30 days (Cu~nat & Garcia-Appendini, 2012; Giannetti, Burkart, & Ellingsen, 2011). Trade credit, therefore, requires suppliers and entrepreneurs to enter into a debtor–creditor relationship involving inventory as opposed to money (Ng et al., 1999; Peterson & Rajan, 1997; Wilner, 2000). Trade credit impacts virtually every type of business model (Petersen & Rajan, 1997; Wilner, 2000), and is used at virtually every stage in a company’s life (Berger & Udell, 1998; Cu~nat, 2007).
Trade credit often acts as a substitute for more tradi-tional sources of finance, such as bank loans (Blasio, 2005; Petersen & Rajan, 1997). Huyghebaert, Van de Gucht, and Van Hulle (2007) determined this substitu-tion is especially true for startup companies that banks are not as willing to take a chance on financing. Wilner (2000) found that suppliers are also much more likely than banks to renegotiate terms with entrepreneurs. Some scholars, therefore, have argued that trade credit is as much a form of bootstrap financing as it is tradi-tional debt, because of the leveraging of relationships, negotiability, and the need for entrepreneurs to network with suppliers (Bosse & Arnold, 2010; Winborg & Landstr€om, 2001).
Suppliers also appear to have an advantage over banks in that goods purchased on trade credit can be more easily repossessed or the supply simply cutoff (Mian & Smith, 1992; Petersen & Rajan, 1997). For the entrepreneur, trade credit reduces transaction costs by allowing entrepreneurs to pay for several purchases at one time as opposed to cash on delivery (COD) (Ferris, 1981; Petersen & Rajan, 1997; Schwartz, 1974). Entrepreneurs also use trade credit as a way to monitor the quality of goods and services, with credit term periods allowing for inspection and a potential withholding of payment for poor quality (Long, Malitz, & Ravid, 1993; J. K. Smith, 1987). The impact and benefits of trade credit, therefore, are felt by virtually every type of business at every stage. While trade credit has been studied extensively in the literature for decades, venture capital also attracts the interest of scholars looking to study equity forms of finance.
234 T. CLEMENT ET AL.
Venture Capital
Almost the opposite of trade credit, VC is a type of private equity financing in which an outside investment fund finan-ces a venture in exchange for a percentage of ownership (Lerner et al., 2012; Metrick & Yasuda, 2011). VC impacts less than 2% of all entrepreneurial ventures (Berger & Udell, 1998; Rogers, 2009). The Small Business Adminis-tration Office of Advocacy (2011) reported that private equity financing, including VC, accounts for about 6% of total finance sources. Compared to trade credit, VC is also relatively young, having been formally recognized as a finance source since the mid-1940s and attracting attention in primarily the last 30 years (Cumming & MacIntosh, 2004; Gompers & Lerner, 2004; Lerner et al., 2012; Metrick & Yasuda, 2011; Samila & Sorenson, 2011).
VC is typically used only during the growth or expan-sion of a venture, beyond startup, or as a bridge between bootstrapping and more traditional finance methods (Gom-pers & Lerner, 2001; Zider, 1998). Venture capitalists, therefore, are not generally known for providing develop-ment or startup financing for ventures. Early-stage financ-ing, therefore, comes from sources such as angel investors, or through the use of bootstrapping techniques (Rogers, 2009).
The reasons for the limited use of VC include the expected returns to investors, the narrow fit with specific business models, and the limited geography of VC dollars (Bygrave & Zacharakis, 2008; Lerner et al., 2012; Metrick & Yasuda, 2011). Venture capitalists are attracted to highly innovative businesses that grow very quickly, typically within a two- to eight-year time frame (Cumming & MacIn-tosh, 2004; Rogers, 2009). Gompers and Lerner (2001) noted that in 1999 roughly 60% of VC was invested in com-puter technology and communications, with an additional 10% in medical science firms. Recently, a report prepared by Thomson Reuters (March, 2013) ranked the top three industries attracting VC as software (31%), biotechnology (15%), and industrial–energy (10%).
Geographically, in the United States, VC investing is centered in three primary metropolitan areas: San Francisco and San Jose (a.k.a., Silicon Valley), Boston and greater New England, and New York City (Chen, Gompers, Kovner, & Lerner, 2010; Metrick & Yasuda, 2011). In fact, the state of California alone is home to about 50% of the total VC investments in the United States (Metrick & Yasuda, 2011).
For VC investors, R. L. Smith and Smith (2004) observed, “new ventures are high-risk investments that tie up investor’s capital for several years, with no easy means of exit” (p. 231). Because of the risk, venture capitalists expect very high rates of return on their investments. Typi-cal returns range from 30% to 60% in earlier stages of financing to a lower 20–30% for expansion of established businesses (R. L. Smith & Smith, 2004). The ultimate cost,
however, of VC to the entrepreneur may be an involuntary exit from his or her own firm. Literature suggests that com-panies using VC are far more likely to have their founders removed and replaced by an outside CEO, either for lack of experience, personality clashes with investors, or poor per-formance (Hellmann & Puri, 2002; Kaplan & Lerner, 2010).
Even though VC makes headlines, its impact is signifi-cantly smaller than trade credit. In total dollars financed, trade credit accounts for almost three times the amount pro-vided by private equity investors (Lerner et al., 2012; Ng et al., 1999; Wilner, 2000). As this section showed, VC is rare, narrowly focused, expensive, and complex. Central to the theme of this study, trade credit is not as complex as VC, it impacts a wider array of ventures, and yet, it receives little mention in classrooms or textbooks. As a result, stu-dents may be presented with financing options that do not align with the realities of mainstream business, especially at the early stages of a venture.
METHOD
Textbook Survey/Analysis
To investigate the problem of a potential bias toward VC at the expense of trade credit in entrepreneurial education, a quantitative survey of textbooks (n D 13) was first con-ducted. Specifically, textbooks were analyzed to determine how much physical space was dedicated to discussing trade credit financing versus VC. The textbooks were chosen from sales market share data of the most popular texts in the following disciplines: entrepreneurship, entrepreneurial finance, introduction to business, corporate–managerial finance, and small business management.
The textbooks were examined in two ways. First, each index was reviewed for specific mention of terms related directly to trade credit and VC. The second part of the text-book analysis involved quantification of space dedicated to trade credit versus VC in terms of sentences, paragraphs, pages, or full chapters. The researchers used the evidence found in the textbook analysis to develop a survey instru-ment which was administered to college-level students.
Survey Analysis
Participants. Participants were 126 undergraduate and graduate college students, including 94 men and 28 women. Participants were invited to complete the survey in a class-room setting by instructors known to the principal investi-gators. Students entered in a Midwestern university business plan competition also voluntarily participated. Par-ticipants were either enrolled or had been enrolled in entre-preneurship courses or programs of study at 11 U.S. four-year universities, including eight public and three private
institutions. The geography of these schools included seven Midwestern schools, one Southeastern, one East coast, one Southwestern, and one West coast school. Of the 11 schools participating, two had been consistently ranked as having among the best entrepreneurship programs in the United States (“Colleges & business schools,” 2014). No restric-tions were imposed regarding a student’s status (i.e., under-graduate, graduate), or by their specific field of study (i.e., business, nonbusiness). The estimated response rate to the survey was about 77%.
Instrument. The survey contained demographic ques-tions including gender, education status, area of study, and number of entrepreneurship courses taken. Participants were also asked to rate their level of agreement on 32 ques-tions using a 6-point Likert-type scale ranging from 1 (strongly disagree) to 6 (strongly agree). Four constructs were designed with six specific survey questions within each construct: This accounted for 24 of the 32 survey questions. The survey concluded with eight additional entrepreneurial finance questions to test their more advanced knowledge of trade credit and VC.
Construct 1 (C1), student exposure to VC, contained questions designed to measure how often students were reading, hearing, and seeing VC and related terminology. Construct 2 (C2), student exposure to trade credit, mea-sured the amount of exposure students received to the topic of trade credit. Construct 3 (C3), basic student understand-ing of VC, measured student’s agreement with statements about VC. Finally, construct 4 (C4), basic student under-standing of trade credit, displayed student’s agreement with statements about trade credit concepts.
Analysis. Using the 32 survey Likert-type questions, descriptive data was calculated including each question’s percentage of agreement, mean, and standard deviation. Reliability testing was also performed using IBM SPSS Sta-tistics 20 software calculating Cronbach’s alpha and Pearson’s correlation coefficient for each construct.
To determine if a bias favoring VC existed, participants’ exposure to VC was measured by the mean level of agree-ment with questions in C1. To address whether trade credit was being marginalized in entrepreneurship education, par-ticipants’ mean level of agreement to questions in C2 was examined. In evaluating student’s feelings on VC concepts, the average level of agreement for C3 was reviewed. The overall level of agreement to four of the additional ques-tions not grouped into a construct was also analyzed with levels of agreement testing more advanced concepts of VC. Student opinions on trade credit concepts were determined by the mean level of agreement to questions in C4. Similar to VC, two additional nonconstruct questions were also examined to test more advanced trade credit information among students.
The relationship between exposure and student responses to questions on VC concepts was tested through a Pearson’s correlation between C1 and C3 determining how exposure to VC changed the level of agreement with these conceptual questions on VC. Similarly, the relation-ship between trade credit exposure and conceptual agree-ment was addressed by a Pearson’s correlation between C2 and C4. This correlation determined how exposure to trade credit affected agreement with conceptual statements on trade credit.
Procedure. Recruitment of survey participants was through an oral presentation of the study and survey instru-ment. Subjects were informed that their participation was completely voluntary. If a subject chosenotto participate, (s)he was told to return a blank or incomplete survey along with the rest of the participants, and their survey would be disregarded. This option was made available so that nonpar-ticipants would not feel singled out as a result of their deci-sion to not complete a survey.
Participants were asked to complete all demographic information and provide a response to all 32 Likert-type questions. Once the survey was completed, participants were instructed to return their surveys to an envelope held by the survey proctor. The principal investigators were not present during the completion or collection of the surveys. The survey instrument contained no distinguishable per-sonal information regarding participants, thus safeguarding participant anonymity.
RESULTS
Textbook Data
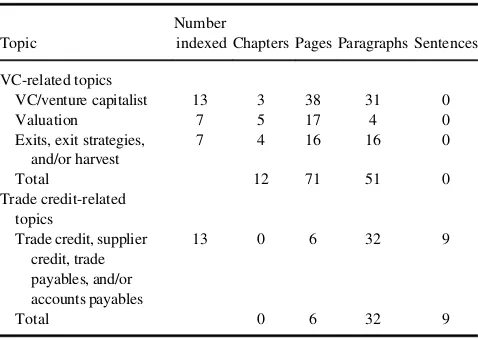
Table 1 presents a summary of the textbook analysis results, which compares the total space allocated to topics related to VC and trade credit among the 13 textbooks reviewed. The table shows the total number of texts con-taining each topic within the index and quantification of separate chapters, pages, paragraphs, and sentences devoted to each topic in hierarchal, noninclusive fashion. The differ-ence in coverage between VC and trade credit topics was substantial. Given that the topic of venture valuation could be independent of VC financing, and setting aside the data in Table 1 for this topic, VC coverage alone still results in seven chapters, 54 pages, and 47 paragraphs of coverage. Even when examined on a topic-by-topic basis, attention to VC far eclipsed that of trade credit.
Survey Data
The significant demographics of the survey participants (nD126) are detailed in Table 2. Nearly 75% of the stu-dents who completed the survey instrument were men. 236 T. CLEMENT ET AL.
Respondents were either studying entrepreneurship in some capacity (nD68) or were pursuing another business major (n D40). Not shown in Table 2, student participants had completed an average of 2.3 entrepreneurship courses prior to participating in the survey. The relatively low average number of entrepreneurship courses could indicate that many of these students were pursuing entrepreneurship as a minor, certificate, or concentration as opposed to a full major.
All of the responses within each construct were averaged and calculated using Cronbach’s alpha reliability coeffi-cient and Pearson’s correlation coefficoeffi-cient. The results of these measures are shown in Table 3. The reliability of each of the subscales was adequate. Correlations existed between all subscales, but in particular, exposure to VC was associated with students’ perceived understanding of VC (rD.78,p<.05).
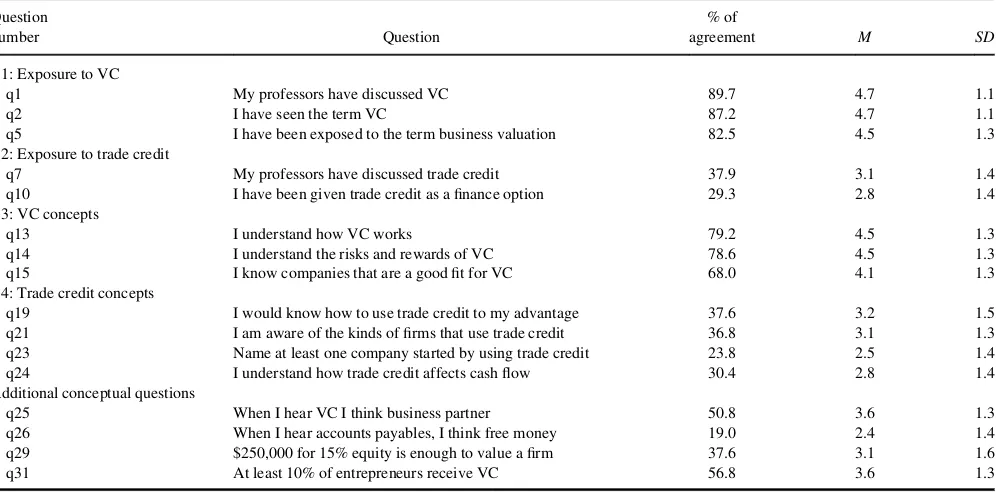
Each individual survey question was also analyzed to determine some form of agreement (i.e., slightly agree,
agree, strongly agree) and highlights of those results are depicted in Table 4. Almost 90% of respondents agreed they had been exposed to VC (q. 1) compared to less than 40% with exposure to trade credit (q. 7), and less than 30% having been offered trade credit as a finance option on an assignment (q. 10). Although not a large margin, the stan-dard deviation of responses to (C2), exposure to trade credit questions, was higher indicating a wider spread of responses from students.
A majority of students indicated that they agreed with statements about basic VC concepts. Mean responses, how-ever, were lower while standard deviations were higher compared with questions about exposure to VC. The change in mean and standard deviation could indicate slightly less confidence and more diversity in responses
The responses to questions about trade credit concepts (C4) were striking given the context of the research revealed here. Key questions in this construct not only pro-duced a percentage of agreement far below 50%, but mean responses were all below 3.2 on a six-point item. Most sig-nificant was the students’ lack of understanding on trade credit’s effect on cash flows (q. 24), and what types of firms might use trade credit (q. 21). Although very low, students’ inability to name a company started with trade credit (q. 23) was not surprising given the relative lack of exposure and understanding of trade credit indicated by other responses.
The final eight questions on the survey instrument, not organized into a specific construct, were meant to delve more deeply into VC and trade credit concepts. Specifi-cally, questions 25, 29, and 31 indicated incongruities between how much exposure students’ received to VC and their opinions of how it really works. For example, in ques-tion 25, 50.8% of students felt that VC financing resulted in additional business partners for the entrepreneur—a major-ity, but with a response mean of only 3.6, not a strong one. A majority of students (62.4%) did not agree that the sce-nario of surrendering 15% equity for a $250,000 investment was enough information to value a firm (q. 29) and 58.1% did not agree that VC-backed ventures have a strong likeli-hood of being sold in five years (q. 30). And most telling of all, a majority of respondents (56.8%) felt that at least 10% of entrepreneurs receive VC, even though almost every document researched regarding VC noted how rare a form of finance it actually was at around 2% or less of firms receiving it (q. 31).
DISCUSSION
Entrepreneurship educators appear to be doing an inade-quate job of informing students about a common finance technique, trade credit, which is used by millions of busi-nesses every day, all around the world (Ng et al., 1999; Petersen & Rajan, 1997; Wilner, 2000). Trade credit is far
TABLE 1
Summary of Textbook Analysis Comparing VC and Trade Credit–Related Topics
Topic
Number
indexed Chapters Pages Paragraphs Sentences
VC-related topics
VC/venture capitalist 13 3 38 31 0
Valuation 7 5 17 4 0
Significant Demographic Information of Sample
Characteristic n %
more accessible than VC (Rogers, 2009) and substitutes for a lack of available bank credit (Blasio, 2005; Huyghebaert et al., 2007; Petersen & Rajan, 1997; Wilner, 2000).
In contrast, entrepreneurial education demonstrates a significant bias in favor of VC, a relatively rare and com-plex form of private equity finance (Lerner et al., 2012; Metrick & Yasuda, 2011). VC is primarily used during the growth and expansion phases of software, biotechnology, and energy companies (Gompers & Lerner, 2001; Zider, 1998) located in places such as San Francisco, Boston, and New York City (Chen et al., 2010; Metrick & Yasuda, 2011). Firms attractive to venture capitalists must generate 20–60% returns and scale very rapidly in sales in order to justify the risk to investors (Rogers, 2009; R. L. Smith & Smith, 2004). As a result, VC has such an acute connection to so few business models that most mainstream
entrepreneurs have a better chance of winning a lottery than attaining VC funding (Bygrave & Zacharakis, 2008).
As the previous textbook sample data showed, there was a noticeable gap in coverage between VC and trade credit, especially in entrepreneurship texts. The survey results indicate that this gap translated directly to the classroom coverage of VC and trade credit. As a result, students could end up lacking sufficient exposure, in the area of trade credit, or, in some cases, forming incorrect opinions on VC financing despite the high exposure. For example, students may not understand how to negotiate with a supplier for better terms (Ng et al., 1999; Petersen & Rajan, 1997), align payments for merchandise with the sale of those goods (Ferris, 1981; Petersen & Rajan, 1997; Schwartz, 1974), or take an early-pay discount to increase the profit-ability of a firm (Ng et al., 1999; Weygandt et al., 2012).
IMPLICATIONS FOR PRACTICE
As a consequence of the bias revealed in this research favoring VC over trade credit, the college students in this national sample are not being shown an accurate picture of how the majority of business ventures are being financed today. This bias appears so prevalent that some students may actually avoid starting ventures if they perceive their business idea does not fit within the VC model. Further-more, if the lack of true understanding of VC persists among students, there is the risk they could seek improper
TABLE 3
Correlation of Subscale Constructs and Measures of Internal Consistency
Subscale
Question numbers
Exposure to VC
Exposure to TC
VC concepts a
(C1) Exposure to VC 1–6 .81
(C2) Exposure to TC 7–12 .53* .86
(C3) VC concepts 13–18 .78* .58* .90 (C4) TC concepts 19–24 .47* .66* .57* .84
*p<.05.
TABLE 4
Highlights of Descriptive Statistics Including Percentage of Some Form of Agreement (Slightly Agree, Agree, Strongly Agree), Mean, and Standard Deviation
Question
number Question
% of
agreement M SD
C1: Exposure to VC
q1 My professors have discussed VC 89.7 4.7 1.1
q2 I have seen the term VC 87.2 4.7 1.1
q5 I have been exposed to the term business valuation 82.5 4.5 1.3
C2: Exposure to trade credit
q7 My professors have discussed trade credit 37.9 3.1 1.4
q10 I have been given trade credit as a finance option 29.3 2.8 1.4
C3: VC concepts
q13 I understand how VC works 79.2 4.5 1.3
q14 I understand the risks and rewards of VC 78.6 4.5 1.3
q15 I know companies that are a good fit for VC 68.0 4.1 1.3
C4: Trade credit concepts
q19 I would know how to use trade credit to my advantage 37.6 3.2 1.5
q21 I am aware of the kinds of firms that use trade credit 36.8 3.1 1.3
q23 Name at least one company started by using trade credit 23.8 2.5 1.4
q24 I understand how trade credit affects cash flow 30.4 2.8 1.4
Additional conceptual questions
q25 When I hear VC I think business partner 50.8 3.6 1.3
q26 When I hear accounts payables, I think free money 19.0 2.4 1.4
q29 $250,000 for 15% equity is enough to value a firm 37.6 3.1 1.6
q31 At least 10% of entrepreneurs receive VC 56.8 3.6 1.3
238 T. CLEMENT ET AL.
financing alternatives, resulting in lost opportunities or bur-densome finance arrangements. Historically, if would-be entrepreneurs perceived and summarily abandoned ideas not innovative enough for venture capitalists, over 97% of the products or services we enjoy today would be either sig-nificantly delayed or worse, never see the light of day. This study indicates a serious gap exists between theory and practice that must be addressed by educators in order to give students the best chance at success in the marketplace.
REFERENCES
Barringer, B. R., & Ireland, R. D. (2012).Entrepreneurship: Successfully
launching new ventures (4th ed.). Upper Saddle River, NJ: Pearson
Education.
Berger, A. N., & Udell, G. F. (1998). The economics of small business finance: The roles of private equity and debt markets in the financial growth cycle.Journal of Banking & Finance,22, 613–673.
Bhide, A. V. (2000).The origin and evolution of new businesses. New York, NY: Oxford University Press.
Bitler, M. P., Moskowitz, T. J., & Vissing-Jørgensen, A. (2005). Testing
agency theory with entrepreneur effort and wealth. The Journal of
Finance,60, 539–576.
Blasio, G. D. (2005). Does trade credit substitute bank credit? Evidence from firm level data.Economic Notes,34, 85–112. doi:10.1111/j.0391-5026.2005.00145.x
Bosse, D. A., & Arnold, T. (2010). Trade credit: A real option for boot-strapping small firms. Venture Capital, 12, 49–63. doi:10.1080/ 13691060903411560
Bygrave, W. D., & Zacharakis, A. (2008).Entrepreneurship. New York, NY: Wiley.
Chen, H., Gompers, P., Kovner, A., & Lerner, J. (2010). Buy local? The geography of venture capital.Journal of Urban Economics,67, 90–102. Cheng, N. S., & Pike, R. (2003). The trade credit decision: Evidence of UK
firms.Managerial and Decision Economics,24, 419–438.
Christie, G. N., & Bracuti, A. E. (1981).Credit management. Lake Suc-cess, NY: Credit Research Foundation.
Cole, R. A. (2010).Bank credit, trade credit or no credit: Evidence from
the surveys of small business finances(Munich Personal RePEc Archive
[MPRA] Paper No. 24689). Retrieved from http://mpra.ub.uni-muen chen.de/24689/1/MPRA_paper_24689.pdf
Colleges & business schools / Top 25 undergraduate entrepreneurial col-leges. (2014, March 7).Entrepreneur. Retrieved from: http://www.entre preneur.com/topcolleges/undergrad/0.html#
Cumming, D., & MacIntosh, J. (2004). Boom, bust, and litigation in ven-ture capital finance.Willamette Law Review,40, 867–906.
Cu~nat, V. (2007). Trade credit: Suppliers as debt collectors and insurance providers.The Review of Financial Studies,20, 491–527. doi:10.1093/ rfs/hhl015
Cu~nat, V., & Garcia-Appendini, E. (2012). Trade credit and its role in entrepreneurial finance. In D. Cumming (Ed.), Oxford handbook of
entrepreneurial finance(pp. 526–557) New York, NY: University Press.
Ferris, J. S. (1981). A transactions theory of trade credit use.The Quarterly
Journal of Economics,96, 243–270. doi:10.2307/1882390
Giannetti, M., Burkart, M., & Ellingsen, T. (2011). What you sell is what you lend? Explaining trade credit contracts.The Review of Financial
Studies,24, 1261–1298. doi:10.1093/rfs/hhn096
Gompers, P. A., & Lerner, J. (2001). The venture capital revolution.The
Journal of Economic Perspectives,15, 145–168.
Gompers, P. A., & Lerner, J. (2004).The venture capital cycle(1st ed.). Cambridge, MA: MIT Press.
Hellmann, T., & Puri, M. (2002). On the fundamental role of venture
capi-tal.Economic Review-Federal Reserve Bank of Atlanta,87(4), 19–24.
Huyghebaert, N., Van de Gucht, L., & Van Hulle, C. (2007). The choice between bank debt and trade credit in business start-ups.Small Business
Economics,29, 435–452. doi:10.1007/s11187-006–9005-2
Kaplan, S. N., & Lerner, J. (2010). It ain’t broke: The past, present, and future of venture capital.Journal of Applied Corporate Finance,22, 36–47.
Katz, J. A. (2003). The chronology and intellectual trajectory of American entrepreneurship education: 1876–1999.Journal of Business Venturing,
18, 283–300.
Kauffman, D., Moore Johnson, S., Kardos, S. M., Liu, E., & Peske, H. G. (2002). “Lost at sea”: New teachers’ experiences with curriculum and assessment.Teachers College Record,104, 273–300.
Kuratko, D. F. (2005). The emergence of entrepreneurship education: Development, trends, and challenges. Entrepreneurship Theory and
Practice,29, 577–598.
Kuratko, D. F. (2014).Entrepreneurship: Theory, process, and practice
(9th ed.). Mason, OH: South-Western Cengage Learning.
Lattuca, L. R., & Stark, J. S. (2009).Shaping the college curriculum:
Aca-demic plans in context(2nd ed.). San Francisco, CA: Jossey-Bass.
Lerner, J., Leamon, A., & Hardymon, F. (2012).Venture capital, private equity, and the financing of entrepreneurship: The power of active inves-ting(1st ed.). Hoboken, NJ: Wiley.
Long, M. S., Malitz, I. B., & Ravid, S. A. (1993). Trade credit, quality guarantees, and product marketability. Financial Management, 22, 117–127.
Metrick, A., & Yasuda, A. (2011).Venture capital and the finance of
inno-vation(2nd ed.). Hoboken, NJ: Wiley.
Mian, S. L., & Smith, C. W. (1992). Accounts receivable management pol-icy: Theory and evidence.The Journal of Finance,47, 169–200. National Small Business Association. (2008).2008 NSBA small and
mid-sized business survey. Washington, DC: Author. Retrieved from http://
www.nsba.biz/docs/2008bizsurvey.pdf
Ng, C. K., Smith, J. K., & Smith, R. L. (1999). Evidence on the determi-nants of credit terms used in interfirm trade.The Journal of Finance,54, 1109–1129. doi:10.1111/0022-1082.00138
Ornstein, A. C. (1994). The textbook driven curriculum.Peabody Journal
of Education,69(3), 70–85. doi:10.1080/01619569409538778
Petersen, M. A., & Rajan, R. G. (1997). Trade credit: Theories and evi-dence.The Review of Financial Studies,10, 661–691. doi:10.1093/rfs/ 10.3.661
Reynolds, P. D. (2005). Understanding business creation: Serendipity and scope in two decades of business creation studies.Small Business
Eco-nomics,24, 359–364. doi:10.1007/s11187-005-0692-x
Rogers, S. (2009).Entrepreneurial finance: Finance and business
strate-gies for the serious entrepreneur(2nd ed.). New York, NY:
McGraw-Hill.
Samila, S., & Sorenson, O. (2011). Venture capital, entrepreneurship, and economic growth.The Review of Economics and Statistics,93, 338– 349. doi:10.1162/REST_a_00066
Schwartz, R. A. (1974). An economic model of trade credit.Journal of
Financial and Quantitative Analysis,9, 643–657. doi:10.2307/2329765
Shane, S. A. (2008).The illusions of entrepreneurship: The costly myths
that entrepreneurs, investors, and policy makers live by. New Haven,
CT: Yale University Press.
Small Business Administration Office of Advocacy. (2011).Frequently
asked questions about small business finance. Washington, DC: Author.
Retrieved from http://www.sba.gov/sites/default/files/files/ Finance%20FAQ%208–25-11%20FINAL%20for%20web.pdf Smith, J. K. (1987). Trade credit and informational asymmetry.The
Jour-nal of Finance,42, 863–872. doi:10.1111/j.1540-6261.1987.tb03916.x
Smith, R. L., & Smith, J. K. (2004).Entrepreneurial finance(2nd ed.). New York, NY: Wiley.
Thomson Reuters. (2013). 2013 National Venture Capital Association
yearbook. Arlington, VA: National Venture Capital Association.
Retrieved from http://www.nvca.org/index.php?option=com_content& view=article&id=257&Itemid=103
Van Auken, H. (2004). The use of bootstrap financing among small technology-based firms.Journal of Developmental Entrepreneurship,9, 145–159.
Van Gelderen, M., Thurik, R., & Bosma, N. (2005). Success and risk factors in the pre-start-up phase.Small Business Economics,24, 365–380.
Weygandt, J., Kimmel, P. D., & Kieso, D. E. (2012).Accounting principles
(10th ed.). New York, NY: Wiley.
Wilner, B. S. (2000). The exploitation of relationships in financial distress: The case of trade credit. The Journal of Finance, 55, 153–178. doi:10.1111/0022-1082.00203
Winborg, J., & Landstr€om, H. (2001). Financial bootstrapping in small businesses: Examining small business managers’ resource acquisition behaviors.Journal of Business Venturing,16, 235–254.
Zider, B. (1998). How venture capital works.Harvard Business Review,76
(6), 131–139. 240 T. CLEMENT ET AL.