Solvatochromism: A Comprehensive Project for the Final
Year Undergraduate Chemistry Laboratory
D. González-Arjona1,*, G. López-Pérez1, M. M. Domínguez1, A. G. González2
1
Department of Physical Chemistry (Faculty of Chemistry), University of Sevilla, Sevilla, España
2
Department of Analytical Chemistry (Faculty of Chemistry), University of Sevilla, Sevilla, España
Abstract
A project for last year students of Chemistry based on solute-solvent interactions from the Physical Chemistry point of view is presented. The UV-Visible solvatochromic effect is used to characterize the solvent polarity. Three different solvatochromic probes, 4-Nitroanisol, 4-Nitrophenol and Reichardt’s dye Betaine (ET30) have been used to estimate thepolarity parameters for eight organic solvents. Kamlet-Taft and Dimroth–Reichardt solvent scales are utilized to estimate the solvent polarity via parameters related with the dispersive forces, dipolar interactions and the tendency to H bond formation. Inside the framework of Linear Free Energy Relationships (LFER), literature data have been utilized to check the validity of these solvent models. The pKa values are analyzed to show the influence of the aprotic solvent polarity in the chemical equilibrium. The change in chemical rate constant of solvolysis due to the solvent polarity displays their possible influence in reaction mechanism. Good replications are obtained with the solvatochromic parameters by means of multi-linear regression relationship, for both LFER data.
Keywords
Solvatochromism, Solvents properties, Solvent scales, Betaine ET301. Introduction
Solvents are chemicals with a fundamental importance. They produce the dissolution and disintegration of one or more other substances obtaining a single homogeneous phase in the dissolution process. They have an undeniable importance in different areas of chemistry. Thus, chemical reactions performed in solubilized media usually take place faster and more easily. In addition, the choice of the right solvent in a chemical reaction is fundamental for an improved specificity and selectivity of reaction products.
From the Thermodynamic point of view, two types of contributions are involved in the dissolution process. The first one is the purely entropy-driven mixing process, usually favored if an entropy increase is obtained simply as result of increasing the number of possible arrangements of molecules. The second one comes from enthalpic considerations, mainly derived from the interactions between the solvent and the substance to be dissolved (the solute), and the interactions of the solute and of the solvent among themselves. If the solute-solvent interactions are very strong (attractive), the solution process is certainly favored. On the other hand, from a kinetic point of view, a fast dissolution process can be expected if the solute is
* Corresponding author:
[email protected] (D. González-Arjona) Published online at http://journal.sapub.org/jlce
Copyright © 2016 Scientific & Academic Publishing. All Rights Reserved
already a liquid, provided that the process is favored from the thermodynamic point of view.
There is a rule of thumb in terms of the solubilization, "simila similibus solventur" or “like dissolves like”. This is an indication that the type of interactions between solvent and solute particles prior to mixing should be similar for the formation of a solution to be favored. The solvent characteristics are marked by kind of its interactions. A solvent classification can be useful to optimize their use.
Solvents are generally divided into two large groups: polar and non-polar. The physical parameter associated with this classification is the relative dielectric permittivity (ε). Solvents with values of 15 or higher are considered polar. If additional considerations are taken into account, such as the formation of hydrogen bonds, polar solvents are classified as protic and aprotic.
This classification scheme only provides a qualitative characterization of solvents. As usual, the boundaries between the different categories are not sharp. It would be interesting to have a scale that provides quantitative information on the specific nature of a given solvent. In particular, it would be desirable that this scale is based on physical properties that can be easily determined experimentally, such as relative dielectric permittivity, dipole moment, specific gravity, boiling point, etc. It is expected that the combination of these physical parameters will provide a more refined solvent polarity scale.
one of the first of this kind to have been proposed [1]. More elaborate parametric scales have been developed: Hansen’s solubility scale uses three parameters: δD, taking into
account the dispersion forces, δP the bonding polarity and δH the hydrogen bonds [2].
0 D P H
P=P +δ +δ +δ (1) Kamlet and Taft [3-5] is another widely used empirical polarity scale for ranking solvents. The solute-solvent interactions are divided into three fundamental contributions: (i) cavity formation (where dispersive forces are primary involved), (ii) a term that takes into account dipolar interactions (dipole-dipole and dipole-induced dipole forces), and (iii) the propensity for forming hydrogen bonds (acceptor/donor). Hildebrand's [1] solubility
parameter (∂) and the molar volume of the solute (Vm)
determine the cavity term. The π*, is the dipolar term. The hydrogen bond formation is described by two parameters: α, ability to donate hydrogen bonds (acidity), and β, ability to
accept hydrogen bonds (basicity).
In general, the interaction between the solute and the solvent can be expressed as a lineal combination of these contributing factors:
2
0 ( 1) 2 1 2 1 2 2 1
P=P + ⋅ ∂A V + ⋅B π π + ⋅C α β +D⋅α β (2) where subscript 1 refers to the solvent and 2 to the solute. In this way a parametric general polarity scale based on the solvation capacity can be attained. The parameters of the above equation are obtained by means of UV-Vis spectroscopy by using the named "solvatochromic effect". This effect appear as UV-Vis λmax absorption shift of some
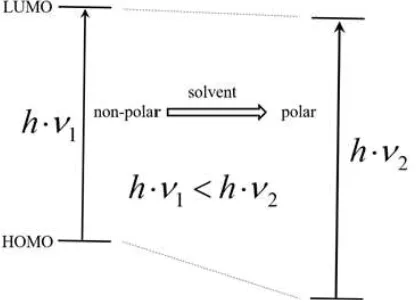
selected compounds, named solvatochromic probes, due to differences in solvation free energy between their ground and excited states [6]. When solvent polarity increases, the
shift can be to shorter λmax, indicating a lower solvation free
energy of the ground state compared to the excited state, a so-called hypsochromic shift, as in Figure 1. A bathochromic shift, to longer wavelength, is observed for the case of greater stability of the excited state [7].
Figure 1. Schematic energy scheme for a solute exhibiting a hypsochromic shift in solvents of increasing polarity
The solvatochromic effect has applications in several areas of chemistry, and has been used to test solvation theories [8], to probe membrane structure [9], and has found use in biochemistry [10], etc. The use of the solvatochromic effect simplifies the task of obtaining solvent polarity parameters [11]. Solvatochromism can help us understand the complex solvation concept and can be used for teaching advanced level chemistry courses, to final-year undergraduate students. Analyses of solute-solvent interactions by means of solvatochromic probes have been published over time in chemical education journals at different levels and for different purposes. As a tool in dye synthesis, as introductory organic chemistry laboratory [12], or as an advanced project [13]. The use of ET30 as a
polarity indicator [14], which is a substance displaying a very strong solvatochromic effect [15, 16], it has been even employed in analytical chemistry for determining the water content of solvents [17]. Thus, a comprehensive project centered on solvatochromism can be adapted to different areas chemistry: Organic Chemistry [12, 13], Analytical Chemistry [17], while in Inorganic Chemistry it can be used to study and characterize ionic liquids [18] as well as in the synthesis of inorganic complexes as solvatochromic probes [19].
Finally, in Physical Chemistry lab it may be used to develop a deeper knowledge of the polarity concept by studying some polarity scales, like Kamlet-Taff [3] and Reichardt ET30 [11]. In this sense, from the different
Physical Chemistry areas, the influence of the solvent polarity in the chemical equilibrium and chemical kinetics aspects has been selected. From a Thermodynamic point of view, the chemical equilibrium constant, (Keq0 ), is linked to the standard reaction free energy change (∆G0P T, ) at constant T and P, by the familiar equation:
0 0
, ln
P T eq
G RT K
∆ = − (3) The chemical equilibrium at constant T and P is modified by its environment [20]. Two main contributions to this change can be distinguished, one related to other solutes that are not directly involved in the equilibrium, and the other to the type of solvent employed. The former influence is usually known as “salting effect”, is related to the impact of the inert solute on the activity coefficients of the reacting species. The second effect is related to the change in the reference state of the free energy when the solvent is changed. Therefore, different equilibrium constants can be expected for different solvents.
From the kinetic point of view, the chemical rate constant is also influenced by their environment. Transition state theory postulates that the reactions occur by passing through an transient activated state to which a free energy of formation (∆G‡), can be assigned. Consequently, ∆G‡
Figure 2. Simplified schematic plots for the influence of solvent polarity in SN1 and SN2 substitution reaction mechanisms
Solvent selection, in the realm of organic synthesis, is a fundamental task. The choice of solvent can greatly influence the type, isomerism and yield of the compounds obtained. Among the possible types of organic reactions, nucleophilic substitution is very common and useful [21]. These reactions are classified as SN1 and SN2 depending on
the reaction order of the rate-determining step, unimolecular and bimolecular, respectively. The mechanism for SN1 is
associated with the formation of a carbocation as the rate-determining step. The SN2 mechanism is postulated as
bimolecular where the transition state is electrically neutral. Therefore, the solvent effect observed for a substitution reaction can help to elucidate their mechanism [22].
Figure 2 displays simplified schematics of transition states for SN1 and SN2 which permits a qualitative prediction of rate
constants from the relative values of ∆G‡ for polar and
Therefore, an increase of the reaction rate should be observed for a SN1 substitution reaction when the solvent
polarity increases, while the opposite effect should be expected for an SN2 mechanism.
These two aspects (thermodynamic and kinetic) were addressed in the present project. Physicochemical properties based on Linear Free Energy Relationships (LFER) between pKa and rate constants were taken from the literature to test
polarity models.
Moreover, developing advanced undergraduate projects based on this effect offers some additional advantages. The instrumentation is based mainly on, relatively cheap, UV-Vis spectroscopy. The use and management of organic solvents in the lab provides another opportunity to address their use in an environmentally sustainable way, as it
involves the recycling of solvents and recovery of the solvatochromic probes employed.
2. Objectives
In this paper, we describe part of a final year undergraduate project, based on the solvatochromic effect performed in the following areas of Physical Chemistry: Characterization by means of solvatochromic probes in different single solvents. Estimation of characteristic parameters that define the Kamlet-Taft and Dimroth–Reichardt solvent scales. Check the validity of these scales in the frame of Linear Free Energy Relationship by using literature data, consisting of pKa and reaction rate constants.
The proposed strategy belongs to a wider, more comprehensive, solvatochromic project which was conducted from three different chemical perspectives, viz. Analytical, Physical and Organic Chemistry. The integral project was completed by some final year graduating students that worked on the subject of solvatochromism from these different points of view for a laboratory work of 180 hours [23].
3. Experimental
UV-Vis spectra were recorded from 350nm to 900 nm for the ET30 probe and from 250nm to 500nm for the other probes, by using a Shimadzu UVmini-1240
Spectrophotometer at 1nm stepwise. A quartz cuvette with a
path length 10 mm, and chamber volume 400 μL were employed.
a) Solvents:
From Panreac [24]: Dimethyl sulfoxide (DMSO) CAS # 67-68-5, N,N-Dimethylformamide (DMF) CAS # 68-12-2
and Tert-butyl alcohol (tBuOH) CAS # 76-65-0 and Methanol (MeOH) CAS # 67-56-1, for analysis; Acetonitrile (CAN) CAS # 75-05-8, Tetrahydrofuran (THF) CAS # 109-99-9 and 2-Propanol (2PrOH) CAS # 67-63-0 for synthesis. From Merck [25]: Acetone (AC), CAS # 67-64-1. b) Solvatochromic probes:
From Sigma-Aldrich [26] Reichardt’s dye (ET30), CAS #
10081-39-7, 4-Nitroanisol (4NA) CAS # 100-17-4 and 4-Nitrophenol (4NP) CAS # 100-02-7.
c) Molecular sieves:
From Sigma-Aldrich, Type 3Å, CAS # 308080-99-1 and Type 4Å, CAS # 70955-01-0.
As desiccant, Sodium sulfate anhydrous, Na2SO4, CAS #
7757-82-6 from Merck for analysis, was used.
The solvents were desiccated by passing them through a 20x1 cm Na2SO4 column. Then, solvents were stored in
amber glass hermetically sealed bottles containing activated molecular sieves type 4Å for DMSO and THF and type 3Å for all other solvents.
10mL 1mM ET30 probe in THF was prepared as stock
solution. Each ET30 solvent working solutions were prepared
adding 20µL ET30 THF stock solution to a 1mL volumetric
flask. A sand bath at 40ªC was used to evaporate the THF, and subsequently the solution was made up with the correspondent solvent. In some cases, further dilution would be necessary to maintain the maximum values of absorbance below unity.
2mM of 4NA and 4NP (5mL) stock solutions were prepared in each solvent. The working solutions were prepared from dilution to 0.1mM to keep them within the required absorbance range.
4. Results and Discussion
The Dimroth-Reichardt ET30 polarity scale is based on the
λmax value of the lower energy band in the UV-Vis spectrum
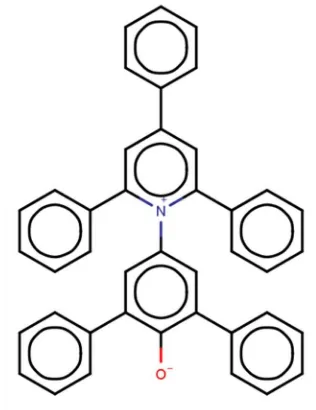
of Reichardt’s dye in the solvent under study. Figure 3 shows its zwitterion molecular structure of this pyridinium N-phenolate betaine dye.
The ET30 energy gap between HOMO-LUMO falls within
the visible/near-infrared spectral range, due the high benzene conjugation. Moreover, the large distance between the two charged heteroatoms (see Figure 3) produces a very large molecular dipole moment, in excess of 10 Debye. This high value ensures strong dipolar interaction with other molecules.
The ET30 scale is defined by one single parameter related
to the electronic transition of lower energy, in kiloKaiser (kK) (1kK = 1000cm-1):
4
T max
max
10 30(kK)=
(nm)
E ν = λ (5) The ET30 visible spectra (Figure 4) show the large change
in λmax for the different solvents studied. The λmax shifts
nearly 250nm between THF and MeOH, indicative of the high sensitivity of this probe to polarity changes.
Figure 3. 2D projection of the zwitterion Betaine ET30 molecular
structure
Figure 4. ET30 visible spectra in the different solvent essays
The Kamlet-Taft solvent scale uses three parameters to
model solute/solvent interactions. The π* parameter
accounts for polarizability/dipolar effects. Its value is estimated from νmax of some solvatochromic probes [4] using
the equation:
max 0
* s
ν ν
π = − (6)
where ν0 and s are parameters obtained from multiple
correlation equations that set π* at zero for cyclohexane and unity for DMSO. In our project, 4NA has been used as a probe and the ν0 and s values, taken from the literature, are
34.12 kK and -2.343 kK, respectively.
The α parameter accounts for the hydrogen bond donor effects and the β parameter accounts for the hydrogen bond acceptor effects, were estimated according to Sindreu et al.
max(E 30) 1.873T max(4NA) 74.58
6.24
ν
ν
α
= + ⋅ − (7)max max
0.901 (4NA) (4NP) 4.16 2.31
ν ν
β= − + (8)
Table 1 lists νmax solvatochromic spectral data calculated
for each solvent together with literature values [3, 11] and the associated relative error. The relatively low relative errors in νmax, indicate that the solvent desiccation process
was carried out satisfactorily. This is particularly evident for the probe ET30 which is very sensitive to polarity changes.
A first approximation to evaluate the solvation capacity can be made from the correlation between macroscopic physical solvent properties and νmax spectral data. Table 2
lists the relative electric permittivity (εr) dipole moment (µ) specific gravity (ρ) and refraction index (n) gleaned from the literature [27].
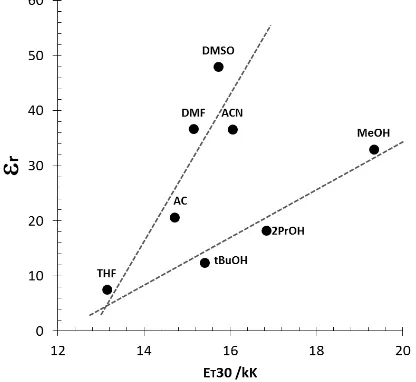
As an example, Figures 5 and 6 show the relation between two physical properties, εr and µ, for the solvents studied with the ET30 parameter. Both plots qualitatively point out
the differences between the different solvents and their capacity for hydrogen bond donation, HBD. Thus, the studied solvents can be classified in two different groups: the alcohol series (MeOH, 2PrOH and tBuOH) and the group formed by AC, ACN, DMF and DMSO. THF can be considered as a common reference for both classes. The straight lines are plotted just to emphasize the class division, not to show a linear relationship between physical properties and solvatochromic parameter. The two groups possess a very dissimilar HBD character.
Figures 5 and 6 show that the ET30 parameter for the
solvents studied seems to bear a complex relationship to the individual physical properties, εr and µ. For the other two physical properties, specific gravity (ρ) and refraction index (n) not even a clear pattern can be displayed in their relationship with the ET30 value. The use of only one of
these solvent properties does not account, in an unambiguous way, for the solute-solvent interaction provided by ET30. The
transition energy parameter of ET30 closely related with
differences in the way that solvents interact with solutes seems to be different for each solvent. Nevertheless, if the ET30 solute/solvent interaction can be considered to be of a
similar general nature for other solutes, this simple
parameter could be used to account directly for solvent/solute interactions. However, constructing parameterized solvation models based on the idealized potential solute/solvent interaction as the Hildebrand [1] or Kalmlet-Taff [5] polarity models would expand the range of applicability of the model.
Figure 5. Plots of solvent dipole moment vs. ET30 polarity scale
Figure 6. Plots of solvent relative dielectric permittivity vs. ET30 polarity
scale
Table 1. Experimental and literature νmax,in kKaiser, for the solvatochromic probes ET30, 4NA and 4NP, and their associated relative errors
Solvent ET30a ET30b %err 4NAa 4NAb %err 4NPa 4NPb %err AC 14.71 14.77 0.41 30.67 - - 30.67 - - ACN 16.05 15.95 -0.63 32.47 32.47 <0.01 32.47 - - DMF 15.15 15.11 -0.26 32.05 32.05 <0.01 31.45 31.35 -0.32 DMSO 15.72 15.77 0.32 31.75 31.70 -0.16 31.35 31.06 -0.93 THF 13.14 13.09 -0.38 32.57 32.79 0.67 32.47 32.47 <0.01 MeOH 19.34 19.38 0.21 32.79 32.79 <0.01 32.26 32.10 -0.50 2PrOH 16.84 16.95 0.65 33.11 32.94 -0.52 32.05 32.00 -0.16 tBuOH 15.41 15.15 -1.72 33.11 32.94 -0.52 31.75 31.74 -0.03
Table 2. Some physical solvents properties related to solvent polarity Solvent εr µ /D ρ /g·mL-1 n
AC 20.70 2.88 0.7845 1.3561 ACN 36.64 3.82 0.7857 1.3460 DMF 36.71 3.82 0.9445 1.4305 DMSO 48.00 3.96 1.1010 1.4790 THF 7.52 1.75 0.8833 1.4040 MeOH 33.00 1.70 0.7914 1.3280 2PrOH 18.23 1.58 0.7809 1.3776 tBuOH 12.47 1.66 0.7887 1.3990
In the second part of the project, the students tested polarity models by using literature data within the framework of linear free energy relationships (LFER).
Izutsu’s book [28], is a compilation of pKa values in aprotic solvents. The students gathered pKa values in different solvents (AC, ACN, DMF and DMSO) for fifteen compounds (twelve benzene-sulfonamides and three nitro-phenol derivatives). Excel data spreadsheets can be provided by the authors upon request. Molecular properties of the compounds and drawings of their structures were obtained by using JChem, a chemical plug-in for Excel from ChemAxon [29].
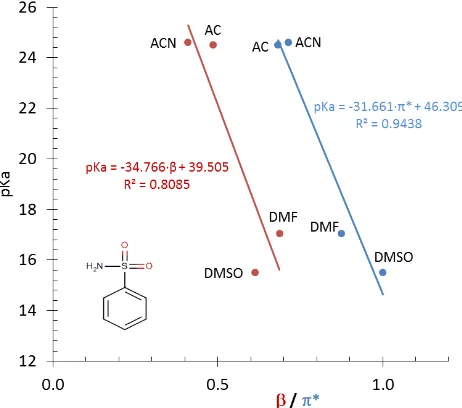
Figure 7. Linear correlation between benzene-sulfonamide pKa and solvatochromic parameters β (red plot) and π* (blue plot) for the four aprotic solvents
There are two fairly linear relationships between the Taft solvatochromic parameters β and π* and the pKa values for the solvents, see Figure 7. A similar linear relationship is not observed between pKa values and ET30 parameter,
indicating that the kind of solvent/solute interactions accounted for in the case of ET30 do not occur for
benzene-sulfonamide and the aprotic solvents. Unfortunately, the number of reported pKa values is limited in the literature cited. However, it is still possible to perform a multi-linear regression (MRL) analysis to study the correlation between
the pKa and the two solvatochromic parameters. The MLR results for the two compounds selected as examples, benzene-sulfonamide and 2,6-dinitrophenol are summarized in the following equations:
a
* 2
a
* 2 pK (benzene-sulfonamide)
46.6 14.3 22.4 (R 0.999) pK (2, 6 dinitrophenol)
39.7 24.9 19.4 (R 0.992)
β π
β π
= − − =
−
= − − =
(9)
The statistics (t test) for each parameter and the MLR (F test) are all significant. MLR results for both compounds are summarized in Figure 8 showing a good linear relationship between the pKa values from literature and MLR estimated (slopes close to unity and intercept close zero). Similar results can be obtained for the rest of compounds selected from the literature.
Solvents also have a very strong effect on the rate constants of organic reactions. Smith et al. [30] studied the rates of solvolysis of p-methoxyneophyl toluenesulfonate in some solvents with different ionizing power. Table 3 presents the solvolysis rate constants for the solvents listed and solvatochromic parameters β and π* taken from Taft
et al. [3, 4] and ET30 from Reichardt [11], respectively.
Figure 8. Comparison between pKa values from the literature and the MRL estimated for benzene-sulfonamide (blue line) and 2,6-dinitrophenol
(red line) in different aprotic solvents taken from the literature [28]
A reasonably linear relationship is obtained between the logarithm of rate constants and the Reichardt solvatochromic parameter (Figure 9):
2 T
log k1 11.9 0.447 E 30 (R 0.930)
− = − = (10) This linear relationship could indicate that similar solvation effects take place for the solvatochromic probe and for the solvolysis reaction components. The analysis of solvent effects on the rate constant is consistent with a SN1
Table 3. Solvolysis rate constants for p-methoxyneophyl toluenesulfonate and solvatochromic parameters from Kamlet-Taft and Reichardt from literature (see text)
Solvent -log k1 π* β ET30 /kK Water 1.180 1.09 0.18 22.07 MeOH 2.796 0.59 0.63 19.38 EtOH 3.204 0.53a 0.70a 19.20
DMSO 3.738 1.00 0.61 15.77 ACN 4.221 0.71 0.41 15.95 DMF 4.298 0.88 0.69 15.11 AC 5.067 0.68 0.49 14.77 EtAC 5.947 0.55 0.45 13.33
a estimated values
Figure 9. Plot of relative rates of solvolysis of p-methoxyneophyl p-toluenesulfonate vs. ET30 parameter for different solvents, taken from
table XI in ref [30]
Multi-linear regression analysis using π*, β and ET30 as
independent variables vs. –log k1, reveals relatively low significant character of β parameter, see eqn. (11).
T 2
log k1 13.3( 0.5) 1.9( 0.3) * 0.8( 0.4) 0.42( 0.02) E 30
(R 0.993)
π β
− = ± − ± ⋅
− ± ⋅ − ± ⋅
=
(11)
Figure 10. Linear relationship between solvolysis rate constants estimated and those taken from literature [22]
Values between parentheses indicate standard error of the
coefficients. MLR relationships using π*, β and ET30
variables provide good data replication as is shown in Figure 10.
A final warning remark should be done about the correlation obtained and MRL applicability. Sometimes artifacts can be found mainly due the multi-collinearity between the parameters utilized [31]. Students should be aware of the fact that a good linear regression fit does not necessarily imply that the model is correct.
5. Conclusions
The proposed comprehensive “Solvatochromic Project” equips students with a wide-angle view of solvent polarity from different chemical perspectives. Students in the Physical Chemistry section learned about the different hypotheses for solvation and how the use of solvatochromic dyes assists in developing different solvent scales. Within the framework of LFER, solvent effects were analyzed by using literature data of pKa and rate constants of organic substitution reactions, obtaining agreement with hypotheses proposed in the literature. Last but not least, students learned how to recycle and recover the solvents and chemicals they used.
ACKNOWLEDGEMENTS
The authors are very grateful to Prof. W.H. Mulder for his helpful comments and suggestions. We also thank the following students of Chemistry: R. Cabezas Rodríguez, A. Martínez Ceballos and M.V. Sánchez Micó for their enthusiasm and dedication in developing part of the “Solvatochromic Project”.
REFERENCES
[1] J.H. Hildebrand and R.L. Scott, The solubility of Nonelectrolytes, 3rd ed., New York: Reinhold, 1950.
[2] C. M. Hansen, The Three Dimensional Solubility Parameter and Diffusion Coefficient, Copenhagen: Danish Tech. Press, 1967.
[3] Kamlet, M.J. and Taft, R.W., The solvatochromic comparison
method. 1. The β-scale of solvent hydrogen-bond acceptor (HBA) basicities, 1976, J. Am. Chem. Soc., 98, 377-383 and The solvatochromic comparison method. 2. The α-scale of solvent hydrogen-bond donor (HBD) acidities, 1976, J. Am. Chem. Soc., 98 2886–2894.
[4] Kamlet, M.J., Abboud, J.L. and Taft, R.W., “The solvatochromic comparison method. 6. The π* scale of solvent polarities, 1977, J Am. Chem. Soc., 99, 6027–6038. [5] Kamlet, M.J., Doherty, R.M., Abboud, J.L., Abraham, M.H.
[6] Reichardt, C., Solvents and Solvent Effects: An Introduction, 2007, Organic Process Research & Development, 11, 105–113.
[7] http://chem-toddler.com/solutions-and-solubility/solvatochro mism.html. Accessed November, 2016.
[8] Sindreu, R.J., Moyá, M.L., Sánchez-Burgos, F. and González-González, A.G., Kamlet-Taft solvatochromic parameters of aqueous binary mixtures of tert-butyl alcohol and ethyleneglycol, 1995, J. Sol. Chem., 25 (3), 289–293. [9] Demchenko, A.P., Mély, Y., Duportail, G. and Klymchenko,
A.S., Monitoring Biophysical Properties of Lipid Membranes by Environment-Sensitive Fluorescent Probes, 2009, Biophysical Journal, 96 (9), 3461–3470.
[10] Dong, J., Solntsev, K.M., and Tolbert, L.M., “Solvatochromism of the Green Fluorescence Protein Chromophore and Its Derivatives”, 2006, J. Am. Chem. Soc., 128 (37), pp 12038–12039. DOI: 10.1021/ja063128a. [11] Reichardt, C., Solvatochromic Dyes as Solvent Polarity
Indicators, 1994, Chem. Rev., 94 (8), 2319–2358.
[12] Minch, M.J. and Shah, S.S., A Merocyanin Dye preparation for the Introductory Organic Laboratory, 1977, J. Chem. Edu., 54(11), 709.
[13] Osterby, B.R. and McKelvey, R.D, Convergent Synthesis of Betaine-30, a Solvatochromic Dye: An Advanced Undergraduate Project and Demonstration, 1996, J. Chem. Edu., 73(3), 260–261.
[14] Johnson, D.A., Shaw, R. and Silversmith, E.F., Visual Demonstration of Solvent Polarities, 1994, J. Chem. Edu., 71(6), 517.
[15] William, T.D. and Acree Jr., E., Selection of an Analysis Wavelength: An Interesting Example Involving Solvatochromism and the Zwitterionic Dimroth-Reichardt’s Betaine ET-30 Dye, 1999, J. Chem. Edu., 76(11), 1555–1556. [16] Machado, C. and Machado, V. G., An Easy and Versatile
Experiment to Demonstrate Solvent W Polarity Using Solvatochromic Dyes, 2001, J. Chem. Edu. 78(5), 649–651. [17] Vitha, M.F., Determining the Percent Water in Organic
Solvents W Using the Zwitterionic Dimroth–Reichardt Betaine ET-30 Dye, 2001, J. Chem. Edu., 78 (3), 370–373. [18] Carmichael, A. J. and Seddon, K. R., Polarity study of some
1-alkyl-3-methylimidazolium ambient-temperature ionic liquids with the solvatochromic dye, Nile Red, 2000, J. Phys. Org. Chem., 13, 591–595.
[19] Al-Alousy, A. and Burgess, J., New solvatochromic Inorganic Complexes, 1991, Spectrochimica Acta, 47(8), 985–989.
[20] I.N. Levine, Physical Chemistry, 6th ed., New York, U.S.: McGraw-Hill, 2009.
[21] L.G. Wade Jr., Organic Chemistry, 6th Ed., New Jersey, U.S.: Prentice Hall, 2005.
[22] Sneen, R.A. and Larsen, J.W., Substitution at a Saturated Carbon Atom. X. The Unification of Mechanisms SN1s and SN2”, 1968, J. Am. Chem. Soc., 91(2), 362–366.
[23] Web2.0, University of Seville (Spanish), https://web20.us.es/node/658 and
https://web20.us.es/node/670. Accessed November, 2016. [24] Panreac, http://www.panreac.es/en/, Accessed November,
2016.
[25] Merck, http://www.emdmillipore.com/US/en?bd=1. Accessed November, 2016.
[26] Sigma-Aldrich, https://www.sigmaaldrich.com. Accessed November, 2016.
[27] D. R. Lide, CRC Handbook of Chemistry and Physics, 83rd ed., Boca Raton, U.S.: CRC Press, 2003.
[28] K. Izutsu, Acid Base Dissociation Constants in Dipolar Aprotic Solvents. IUPAC Chemical Data, IUPAC, London, U.K.: Wiley-Blackwell, 1990.
[29] Chemaxon. https://www.chemaxon.com/. Accessed November, 2016.
[30] Smith, S.G., Fainberg, A.H. and Winstein, S., Correlation of Solvolysis Rates. IX. p-Methoxyneophyl Toluenesulfonate in a Variety of Solvents. Ionizing Power of Hydroxylic and Non-hydroxylic Solvents, 1961, J. Am. Chem. Soc., 83(3), 618–625.