July 2008
Exploring Economy-Wide Impacts of Climate Change
In A Resource-Rich Country
*Iwan J. Azis ([email protected])
Introduction
Concentration of carbon dioxide in the atmosphere is one of the sources of climate change. Its level is influenced by the level of carbon dioxide emissions that can be caused by natural as well as human sources.1 While the impact of the two sources on the climate is the same, the focus of policy debates and discussions has been on what is the most efficient way to reduce the
emissions from human sources. Since there is already warming in the system from the long history of previous emissions, mostly by industrialized economies, the analysis of climate change tends to be directed towards mitigating the change in future climate, and adapting climate change that is uncontrolled by current policy.
To the extent that it is not the amount of emissions in any year but the concentrations in the atmosphere that matters for the climate, anyclimate models should deal directly with the stock measure (i.e., the emissions over a long period of time that cumulate into concentrations). The problem is, climate system is complex, and the level of our understanding about how it works is still limited, albeit improving. The availability of data is also inadequate. This explains why climate models are still imperfect and incomplete; there are no precise conclusions yet as to the actual climate trends, the underlying causes, and their future developments. Indeed, there is a large uncertainty in any climate projection.
The impact of climate change, however, is more known.2 Central to the impact analysis is what happens with the productivity of each sector. In the agricultural sector, there is a strong relation between weather and productivity or yields, e.g., crops have become weaker at withstanding extreme heat above the optimal temperature. Some studies have confirmed that the relation is robust and consistent across space, time, and type of crops. Schlenker and Roberts (2008) also found that the relation tends to be nonlinear: the slope of the decline above (below) the optimal
*
Presented at the Annual International Seminar on “Macroeconomic Impact of Climate Change: Opportunities and Challenges,” August 1-2, 2008, Bali
1
Carbon can be stored in soil and biomass, but it can be released back into the atmosphere through fire, excessive drought, overgrazing etc. It is a greenhouse gas that contributes to global climate change. The World Bank’s figure shows that the rate of global carbon emissions from burning fossil fuels and manufacturing cement rose by 4 billion metric tons between 1990 and 2003, where most of the increase came from high-income countries (2.09 billion metric tons) and East Asia and the Pacific (2.07 billion metric tons).
2
Impacts of climate change are typically represented by a damage function that can take a simple form dependent on regional temperature increases and the damage exponent. The latter, critical in determining the scale of the estimated impacts, can be defined by a probability distribution based on the results from existing studies (IPCC Third
temperature is much steeper (flatter).3 Since each sector’s productivity is affected differently by climate change, and its influences on carbon emissions and poverty depend on where the change in productivity occurs, one needs to distinguish the effect of productivity change in different sector.
For developing countries, the effect is likely greater since many of them are at a geographic disadvantage; they are already warmer and suffer from high rainfall variability, and typically primary sector-dependent and very climate-sensitive. Adaptation to climate change is also more difficult because incomes are low, health provision is inadequate, and the quality of public services is generally poor. Thus, concerns toward poverty in these countries take a central stage. A relevant question to ask is: how much will the resulting productivity decline due to climate change and resource depletion be transmitted into lower income, higher prices and higher poverty. In general, the answer depends on the extent and the pattern of productivity decline.4
In this short paper, I discuss some of the concepts and policy issues related to the economics of climate change. After focusing on the concept of discount rate in the next section, I explore the impact of climate change by simulating an economy-wide model relevant for resource-rich developing countries under different scenarios.
Disagreements on Discount Rate
One of the flaws of the Kyoto Protocol is the lack of a clear link between climate-change policies and economic and environmental objectives. Yet, such a link is necessary if any proposed policy is to be effective. The role of market and prices is indispensable. To reduce carbon emissions at low cost and perhaps in very large quantities will involve a portfolio of policies based on markets and incentives that can ultimately generate a technological change. There is a need to have price signals consistent with a carbon goal that will encourage the emergence, adoption and diffusion of existing and new technologies that enable emissions to be reduced at low cost.
One of the relevant questions in this regards is, should one use fixed prices and let the quantity be determined by the market, or should we use fixed quantities and prices to be determined by the market? Adopting the same principle as in bonds market can also be considered, i.e., use fixed prices in the short run and fixed quantities in the long run.
There is a wide disagreement about the extent of needed cuts in emissions. Some argue that huge cuts are needed from where they are now if we are to have a meaningful effect on global
warming. The Stern Review on the Economics of Climate Change is of such an opinion. Others contend that since there are too many intractable uncertainties surrounding the estimates of costs associated with climate change, making sharp and immediate reductions now would be
3
In the US farm case, it is found that yields increasing in temperature up to a critical threshold of 29C˚ for corn, 30C˚ for soybeans, and 32C˚ for cotton, above which higher temperatures will significantly harm yields.
4
irresponsible. 5 In effect, it forces us to make current decisions about highly uncertain and speculative events in the far distant future.
Central to these contrasting views are the rate of time preference (social discount rate) and the elasticity of marginal utility. As it turns out, the two cannot be chosen independently to match observable variables (see Heal, 2008). A low curvature (e.g., the logarithmic utility function) implies a relatively high social discount rate, while a strong risk aversion to intergenerational inequality--as represented by a high curvature, implies a low social discount rate. Implementing the derived policies, let alone coordinating them, is difficult, since these policies likely cross many jurisdictions – international organizations, national, state and local governments, and they also lead to winners and losers (distributional issues within and between countries).
What is discounting? It is a factor in investment decisions which involves the relative weight of future and present payoffs. The discount factor will generally depend on growth, i.e.,
consumption level in the future relative to that now, and on the social utility or welfare function used to evaluate consumption (i.e., marginal utility of consumption).
The importance of discounting in the analysis of climate change cannot be over-emphasized. As stated in the Stern Review: “…..discounting and the ethics from which it is derived is of great importance for the analysis of climate change.” In a climate change analysis, what is relevant is not discounting consumption or dollars, but more on using the social discount rate (calculated in percent per year), that is, discounting future welfare. In this case relative weights are assigned to different generations or people. A zero (positive) social discount rate means that future
generations are treated equally (less equally, or discounted) as compared to the present or nearer generations.
Consider a case where there are two arguments in a CES utility function: the environmental stock that produces a flow of services (ES) and produced consumption (CS)
and produced consumption:
If the two are complementary (there are technological limits to the possibility of substituting consumption goods for environmental goods), tends to be close to zero. Thus, if the
consumption of the environmental good rises, the consumption discount rate on the consumption declines as the marginal utility of the consumption good will increase.
What discounting to use? As already expected, opinion varies. The one used in the Stern Review is very small (0.1) and essentially close to zero (see Nordhaus, 2006). Such intergenerational neutrality assumption has produced magnified impacts in the distant future and made the report to suggest deep cuts in today’s emissions and all consumption. Obviously, different ethical
5
stance will conclude differently.6 If the discount rate is treated as being uncertain, in the long run one should work with the lowest of all the possible rates (Weitzman, 2007; and Heal, 2008)
Impact Analysis for A Resource-Rich Country
In many resource-rich developing countries, where natural resources and land are being degraded and depleted, the rapid emissions of carbon dioxide drive changes in global climate. The latter poses a grave threat and has become a major obstacle to continued welfare improvements and poverty reduction across many dimensions as it also lowers the future growth capacity by way of reducing the productivity of economic activities.
The standard principle to follow is: the use of non-renewable resources must proceed at a rate that is declining faster than or equal to the rate of depletion (the percentage amount of resources being extracted and used during a specified time interval). In the case of renewable resources, the use must proceed at a rate that is less than or equal to the rate of natural replenishment. For developing countries, however, the principle cannot be detached from poverty and other
backwardness. This suggests that income and prices invoked by productivity changes are among important variables to evaluate.
The rest of the paper is devoted to the discussions on this issue. The economy-wide effects of several scenarios associated with productivity declines driven by climate change and resource depletion are explored in order to get a better understanding of the numerous linkages between activities, poverty, and the rest of the economy including monetary and financial variables. This is done by way of simulating recursive dynamic computable financial generalequilibrium (CFGE) model.7
The current version of the model has a simple recursive dynamic structure. Dynamics in the model originate in three sources: i) accumulation of productive capital and labor growth; ii) shifts in production technology; and iii) the putty/semi-putty specification of technology. In the aggregate, the basic capital accumulation function equates the current capital stock to the depreciated stock inherited from the previous period plus gross investment. However, at the sectoral level the specific accumulation functions may differ because the demand for (old and new) capital can be less than the depreciated stock of old capital. In this case, the sector contracts over time by releasing old capital goods. Consequently, in each period, the new capital vintage available to expanding industries is equal to the sum of disinvested capital in contracting
6
An alternative stance may believe that each generation should leave at least as much total societal capital as it inherited. Another stance would hold that societies maximize the minimum consumption along the riskiest path (e.g., stockpiling medicines, water, food etc to contemplate for possible drastic events). Still another one would hold that societies should maximize the economic well-being of the poorest generation (Rawlsian) that would imply a sharp increase in current consumption.
7
industries plus total saving generated by the economy, consistent with the closure rule of the model.8
I will use resource-rich Indonesia as a case study, by concentrating on three primary activities considered to be resource-depleting and sensitive to the climate change: food, mining, and primary non-food products (forestry and fisheries).In each of these areas, the country faces substantial challenges in terms of declining productivities due to climate change, and reconciling past and current resource use with sustainable growth objectives.It is also useful to consider what happens if the resource-based activities proceed in an unsustainable way that can cause a serious problem of resource depletion.
For the purpose of the analysis, three scenarios of resource depletion are generated. These scenarios are based on the premise that the primarysector will continue to be an important component of GDP in the foreseeablefuture, and that there is a critical linkbetween climate change, resource depletion/degradation and the growth patterns that works through changes in the productivity of different sectors.9 We analyze the consequences of each scenario by comparing the simulation results with those generated under a baseline scenario during the period of 2005-2050. The model is calibrated on exogenous growth rates of population and labor force. It is important to note that the simulation results presented below should not be seen as long-term forecast; it is intended only to illustrate the economic mechanisms at work.
Baseline Vs Alternative Scenarios
In the baseline scenario, the past trend is assumed to continue in the future, to reflect an episode where there is no climate change, or, the effect of it is considered negligible. The capital
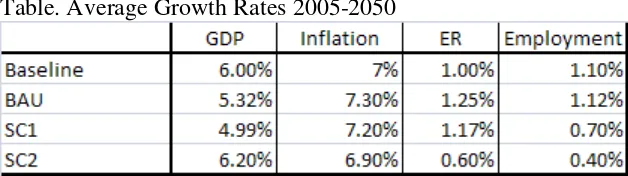
efficiency continues to improve, in such that the GDP under this scenario is estimated to grow at 6 percent annually. The resulting inflation rate is around 7 percent per-annum, the exchange rate is relatively stable with an annual rate of depreciation of 1 percent, the agriculture share in GDP will decline to reach 12 percent by 2050, and the employment generation is slow, mimicking what has occurred in the last few years (see Table 1). Assuming no significant changes in the development strategy, it is expected that a worsening income inequality will persist.10
When alternative scenarios around the baseline are simulated, the technical efficiency parameter is held constant, and the saving/investment relation endogenously determines the growth of capital.Given the current rate of depletion, economic and technological constraints, and information related to climate change, in the so-called Business-as-Usual (BAU) scenario the dynamics are calibrated by assuming a much slower growth of productivity in the
8
Given the detail captured by the model, a fully endogenous or “closed-loop” dynamic specification is not feasible. For the sake of practicality and transparency, a sequential static approach is taken, computing equilibria a five year intervals.
9
In each of the primary sector, the extent to which resource depletion and climate change will prevent sustainable economic development and increased poverty will generally depend on the relative size of the sector and its linkages to the rest of the economy.
10
sensitive primary sectors (food, fishery, forestry, and mining). 11 This scenario reflects a trend with climate change but with limited efforts for mitigation.
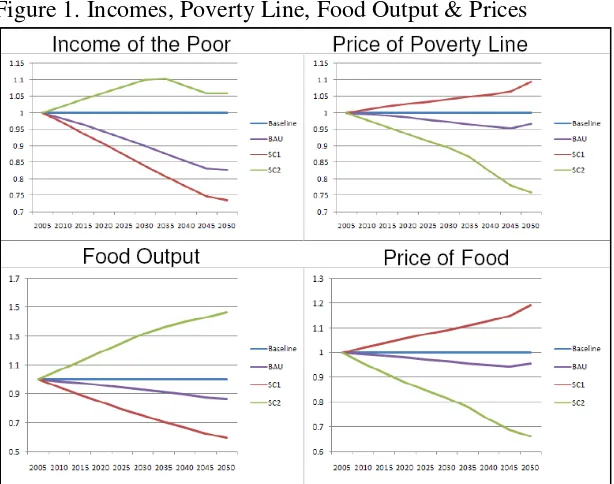
The loss of GDP when the policy response is limited can grow rapidly, reflecting the increased risks associated with climate change.12 The average annual growth rate is around 5.3 percent, or 0.7 percent lower than under the baseline. As a result, the labor absorption is persistently smaller, reaching 30 percent lower than in the baseline by 2050. This implies that the country will have to face a serious unemployment problem. The inflation rate is slightly higher than in the baseline (7.3 percent annual average), and the exchange rate will depreciate faster at 1.3 percent per-annum (Table 1). The poverty impact tends to be unfavorable as the deviation of the poor household’s income from the baseline is larger than the deviation for the poverty line (Figure 1). This is despite the fact that the price and output of agricultural food will not be much different from the baseline, as also the case with the domestic and export demand for food (no additional food surplus is assumed). The share of the agricultural value-added in GDP is consequently similar (Figure 2).
Table. Average Growth Rates 2005-2050
Source: Results of model simulation
An alternative scenario (SC1) is developed to demonstrate the devastating effect of the high-climate setting with catastrophic and non-market impacts when no efforts of mitigation and adaptation are made.13 A balanced growth path is specified, in which the ratio between labor and capital (in efficiency units) is held constant over time.14 No productivity improvement is
assumed in this scenario. That is, given degrading environmental inputs in some sectors due to climate change and resource depletion, the output level will be lower. Thus, the results should capture the long-term expense of neglecting climate change and the cost of resource depletion.
Even if the country maintains a conservative target of 6 percent growth, in this scenario such a goal will be undermined significantly due to no productivity improvements especially in the resource-based sector. The resulting GDP growth rate is less-than 5 percent per-annum with a rapidly growing GDP gap in this scenario compared to the baseline.
11
It is well known that many estimates of the rate of productivity growth are biased upwards since the growth accounts on which they are based do not take into account the depletion of resources or the degradation of natural capital.
12
The direct impact of climate change is generally felt slowly at the beginning before the full direct and indirect impacts take place.
13
On the non-market impact, it is reported that in the last decade Indonesia has lost one species a day, and that 70 per cent of the original habitat of those species has been destroyed. Unless urgent action is taken, these losses in biodiversity will continue at the same rate in the future. Obviously, there are still many other non-market impacts that are difficult to quantify.
14
The effect of a slower GDP growth on employment is devastating. The annual rate of inflation is the worst among all scenarios, such that by 2050 the price of the poverty line reaches 10 percent higher than in the baseline. Combined with the income of the poor being the lowest among all scenarios (Figure 1), this suggests that the poverty incidence will increase significantly.
Figure 1. Incomes, Poverty Line, Food Output & Prices
Source: Results of model simulations
Figure 2. Demand for Food, Exports, Agriculture Share and Gini Index
As the output of food declines (at 0.2 percent annually), its price will increase and consumption decline. The welfare will consequently deteriorate. The resulting agriculture share in GDP falls rapidly to reach 11.4 percent by 2050. With a large number of employment in the agricultural sector, the income share of the poor falls by more-than 0.1 percent each year. Clearly, this scenario depicts the opportunity cost of government failure to recognize the effect of climate change and resource sustainability as a generalized policy objective over the next 50 years.
In the last scenario (SC2), it is assumed that serious attempts are made to foster a more integrated development of biological resources and alternative energy sources to mitigate the climate
change and avoid further resource depletion. To the extent that concerns over the effect of climate change coincide with the trepidation over the growing food crisis, it is further assumed that the country is compelled to do all-out efforts to adapt the effect of climate change on this sector. This is presumably done by introducing an environmentally friendly agricultural policy that leads to better productivity in the sector.15 The same is assumed for the mining sector.
More specifically, the country is assumed to recognize the value created when trees store carbon dioxide and prevent global warming; it is actively engaged in the trading of carbon credits to prevent existing forest from destruction and get paid for doing so such that the sector’s productivity continues to improve.16 In the fishery sector, an emphasis is put on promoting investment, developing coastal fisheries, and undertaking innovative activities designed to use the country’s tropical habitats in a sustainable manner, e.g., aquaculture. The adverse effects of resource depletion in the mining sector are also recognized, although their precise nature varies according to demand responses. For example, progressively higher extraction costs undermine profits and output to a relatively greater extent because of more elastic export demands than in the food, forestry and fishery sectors, which have large sales shares in the domestic market and are therefore less severely affected.
Since weather shocks typically destroy capital investment and disrupt production, it is further assumed in this scenario that a steady improvement in the capital productivity across all sectors is maintained (at 0.5 percent per-annum). Thus, all sectors and agents will gain under this scenario, although some may gain more than others.
The results show that the GDP growth rate would be 6.20 percent per-annum throughout 2050. This is the case despite the fact that a rather conservative estimate of productivity improvements in resource-based activities is used. It demonstrates how Indonesia’s enormous biological
15
I have shown elsewhere that by far the most important area for resource sustainability and renewal is the food sector: an annual productivity growth of 3% can double food output and contribute more than 10% to annual GDP growth within 20 years (Azis & Salim, 2004).
16
potential can be realized through innovative approaches to resource development and use, including the use of new technologies.
There does not seem to be a trade-off between mitigating climate change and maintaining
macroeconomic stability. As shown in the CPI trajectories, the general price level is likely lower, suggesting that the GDP growth associated with sustaining productivity increase as a result of appropriate policy response to climate change is non-inflationary. While more sustainable resource utilization has a neutral impact on exports, partly because the exchange rate tends to appreciate, the higher GDP growth is stimulated mostly by higher investment and consumption, including food consumption. Indeed, the food production is much more favorable under this scenario, causing food prices to fall faster than under any other scenario. With more affordable food products, consumption steadily grows, i.e., at 1.8 percent per-annum. This helps lower the poverty incidence.
With a lower general price level than in any other scenario, the poverty line has a similar pattern. Combined with a higher income of the poor (see Figure 1 under SC2), the poverty condition will improve. Thus, there is no trade-off between growth, stability and poverty reduction if
appropriate policies are fostered to mitigate the climate change and maintain productivity improvements. The “win-win” situation delivered by the carbon credit scheme, where most financial revenue goes directly to the poor living in the villages and forest area, is a noted example of how the devastating impact of climate change can be mitigated while at the same time the welfare of the poor is improved.17 However, since all agents gain from productivity improvements, and given the country’s socio-economic structure, the gain is likely higher for the more modern and technologically advanced sector.18 This explains why the Gini index does not change much in spite of a reduction in the poverty incidence.
Closing Remarks
Disagreements over what discounting factor to use in the analysis of climate change leaves the central questions about global-warming policy remain open. A small (large) social discount rate requires much deeper (smaller) cuts in emissions and consumption today. While it may be indefensible to make long-term decisions with a large positive social discount rate, adopting a strict intergenerational neutrality in developing countries may pose a risk that the cost of action exceeds the expected benefit of taking action because there are many other problems that need to be urgently addressed such as low income, poverty, and weak socio-economic conditions.
Dealing with these problems requires scarce resources which otherwise might be devoted to tackling climate change. The good news is, as demonstrated in the modeling exercise,
appropriate policies of mitigation that lead to productivity improvements do not always involve a trade-off with income growth and poverty reduction.
One of the principal lessons to emerge from the modeling exercise has been the importance of systemic linkages and indirect effects, the sum total of which routinely exceed (and sometimes
17
Such a conclusion, however, cannot be generalized; the ultimate outcome depends on the country’s level of development, economic structure, and development policy in general.
18
can contradict) direct effects that motivate policies. It is shown that the long-term expense of neglecting climate change and the cost of resource depletion can be substantial. In particular, the growth target will be undermined significantly if the productivity decline in the primary sector caused by the climate change is being considered. Policies that not only mitigate the climate change but also reduce resource exploitation by investing in resources and increase their long term productivity are essential to sustaining the transition from a low income primary exporter to a mature and diversified economy. The simulation result also highlights the need for economic diversification and the development of non-primary resources. Unfortunately, the promotion of such a policy is not without challenges, especially from the world trading system, i.e., developed countries continue to impose high import duties on processed products and low import duties on raw materials.