For further information, please contact:
Economic Outlook & Policy Dissemination
Economic Outlook & Policy Dissemination
Economic Outlook & Policy Dissemination
Economic Outlook & Policy Dissemination
Economic Outlook & Policy Dissemination
Bureau of Monetary Policy
Bureau of Monetary Policy
Bureau of Monetary Policy
Bureau of Monetary Policy
Bureau of Monetary Policy
Directorate of Economic Research and Monetary Policy
Directorate of Economic Research and Monetary Policy
Directorate of Economic Research and Monetary Policy
Directorate of Economic Research and Monetary Policy
Directorate of Economic Research and Monetary Policy
Telephone :
+62 61 3818163
+62 21 3818206
Fax.
:
+62 21 3452489
:
BANK INDONESIA
The Monetary Policy Report is published quarterly by Bank Indonesia after the Board of
Governors» Meetings in January, April, July, and October. In addition to fulfilling the
mandate of article 58 of Act Number 23 of 1999 concerning Bank Indonesia, amended
by Act No. 3 of 2004, the report has two main purposes: (i) to function as a tangible
product of a forward-looking working framework in which formulation of monetary
policy is based on economic and inflation forecasts; and (ii) as a medium for the Board of
Governors of Bank Indonesia to present to the public the various policy considerations
underlying its monetary policy decisions.
The Board of Governors
Boediono
Governor
Miranda S. Goeltom
Senior Deputy Governor
Hartadi A. Sarwono
Deputy Governor
Siti Ch. Fadjrijah
Deputy Governor
S. Budi Rochadi
Deputy Governor
Muliaman D. Hadad
Deputy Governor
Ardhayadi Mitroatmodjo
Deputy Governor
Budi Mulya
Deputy Governor
BANK INDONESIA
Monetary Policy Strategy Underlying Principles
Under the ITF, the inflation target is established as the overriding objective and nominal anchor for monetary policy. In this regard, Bank Indonesia has adopted a forward looking strategy by guiding the present monetary policy response for achievement of a medium-term inflation target.
The application of the ITF does not mean that monetary policy disregards economic growth. The basic monetary policy paradigm of striking the optimum balance between inflation and economic growth is retained in both setting the inflation target and in the monetary policy response by focusing on achievement of low, stable inflation in the medium to long-term.
The Inflation Target
After consultations with Bank Indonesia, the Government has determined and announced the CPI inflation target at 5%+1%, 4.5%+1% and 4%+1% for 2008, 2009 and 2010. The inflation target is consistent with the process of disinflation aimed at medium to long-term inflation competitive with other nations at about 3%.
Monetary Instruments and Operations
The BI Rate is the published policy rate reflecting the monetary policy stance adopted by Bank Indonesia. The BI Rate is a signal for achieving the medium to long-term inflation target and is announced periodically by Bank Indonesia for a specific period. To strengthen the operational framework for monetary policy, Bank Indonesia changed from use of the 1-month SBI rate as the operational target to the overnight interbank rate with effect from 9 June 2008. In monetary operations, the BI Rate is implemented through liquidity management on the money market to achieve the monetary policy operational target, reflected in movement in the overnight interbank money market rate. To enhance the effectiveness of liquidity management on the market, a set of standing facilities in combination with an interest rate corridor is employed in day-to-day monetary operations.
Policymaking Process
The BI Rate is determined by the Board of Governors in the Monthly Board of Governors» Meeting. In unforeseen circumstances, the monetary policy stance may be adjusted in advance of the Monthly Board of Governors» Meeting in a weekly Board of Governors» Meeting. Changes in the BI Rate essentially depict the Bank Indonesia monetary policy response for guiding the forecasted level of inflation within the limits of the established inflation target. Transparency
Monetary policy is regularly communicated to the public through customary media for communication, such as statements to the press and market actors, website postings and publication of the Monetary Policy Report (MPR). This transparency is aimed at building improved understanding and shaping public expectations of the economic and inflation outlook and the monetary response taken by Bank Indonesia.
Coordination with the Government
For the purpose of coordination in inflation targeting, monitoring and control, the Government and Bank Indonesia have established a team of officials representing the various relevant agencies. The task of the Team is to deliberate and recommend the necessary policy actions for the Government and Bank Indonesia in managing inflationary pressures for achievement of the established inflation target.
Steps for Reinforcing Monetary Policy with the Overriding Objective of Price Stability (Inflation Targeting Framework) In July 2005, Bank Indonesia launched a reinforced monetary policy framework consistent with the Inflation Targeting Framework (ITF), encompassing four key elements: (1) use of the BI Rate as the policy reference rate, (2) anticipatory monetary policymaking process, (3) more transparent communications strategy and (4) closer policy coordination with the Government. These measures are intended to strengthen monetary policy effectiveness and governance in order to achieve the overriding objective of price stability in support of sustainable economic growth and greater
Enhanced Monetary Policy Measures
Under Inflation Targeting Framework
Monetary Policy Report - Quarter IV-2008
Contents
BANK INDONESIA
Contents
1. General Review ... 1
2. Latest Macroeconomic Indicators ... 4
Economic Growth ... 4
Balance of Payments ... 10
3. Monetary Indicators and Policy, Q4/2008 ... 12
Inflation ... 12
Rupiah Exchange Rate ... 14
Monetary Policy ... 15
4. The Indonesian Economic Outlook ... 21
Assumptions and Scenarios ... 21
Economic Growth Outlook ... 22
Inflation Forecast ... 28
Risks ... 29
5. Monetary Policy Response, Q4-2008 ... 30
1. General Review
In Q4/2008, Indonesia»s economic performance began to show signs of impact from the global economic downturn. The continued weakening in the global economy and plunging commodity prices weighed heavily on Indonesia»s exports, which in turn impacted the balance of payments and the exchange rate. On financial markets, the global financial crisis has triggered widespread turmoil on money markets, currency markets and bond markets. On the other hand, falling world commodity prices and slowing aggregate demand have eased inflationary pressure. Looking ahead, the outlook for further economic slowdown in 2009 augurs for a sustained downward trend with inflation forecasted at 5%-7%. In January 2009, following an assessment of the current economic conditions and outlook, Bank Indonesia lowered the BI Rate 50 bps to 8.75%.
During 2008, the Indonesian economy charted generally strong performance amid the global turmoil. The Indonesian economy managed an estimated 6.1% growth, driven primarily by the engines of consumption and exports. In Q3/2008, the economy was still charting above 6% growth with continued healthy performance in the financial sector reflected in a stable exchange rate, mounting stock index and declining yield on Government Securities.
However, in Q4/2008, the global financial turbulence began to bear down on the Indonesian economy. Weakening exports, pressure on the balance of payments and turmoil on the money market took their toll on Indonesia»s economic growth. On financial markets, global liquidity conditions tightened up in tandem with mounting perceptions of emerging market risks. This in turn triggered a slide in the IDX and Government Securities prices alongside a sharp downturn in the exchange rate in early Q4/2008. During 2008 overall, the average value of the rupiah fell 5.4% to Rp 9,666 to the US dollar.
In 2008, Indonesia recorded a balance of payments deficit. The current account began showing a deficit in Q2/2008. This deficit is explained more by the brisk pace of imports driven by robust domestic demand. At the same time, the capital and financial account and particularly portfolio investments continued to chart a surplus. The capital account surplus was buoyed by the issue of global bonds and foreign capital inflows, especially on the Government Securities market, which saw significantly increased activity in Q2/2008. As Indonesia entered the second half of the year, the balance of payments came under mounting pressure. Within the current account, exports began tapering off in response to falling commodity prices. Similarly, the capital and financial account was impacted by diminishing investor interest in the domestic financial market.
current account and the capital and financial account resulted in a surging balance of payments deficit in the final quarter of the year. Measured for 2008 overall, the balance of payments recorded an estimated deficit of USD2.2 billion. At end-December 2008, international reserves stood at USD51.6 billion, equivalent to 4.0 months of imports and servicing of official debt.
Responding to these developments, monetary policy in 2008 was targeted at subduing inflationary pressures fuelled by high aggregate demand, especially during the first half of the year, as well as the second round effect of the quarterly fuel price hike that sent inflation soaring to 12.1%. The strong inflationary pressure driven by aggregate demand was also reflected in the onset of deficit in the current account from Q2/2008 due to rapidly growing imports and expansion in the money supply, most importantly M1.
To fend of mounting inflationary pressure, Bank Indonesia progressively raised the BI Rate from 8% in May 2008 to 9.5% in October 2008. This monetary policy action prevented further acceleration in public inflation expectations and eased the downward pressure on the balance of payments. Following this, Bank Indonesia forecasted reduced future inflationary pressure in the wake of falling world commodity prices and slowing aggregate demand as a result of the global economic crisis. Thus in December 2008, the BI Rate was lowered a further 25 bps. Overall CPI inflation in 2008 reached 11.06%, with core inflation recorded at 8.29%.
Looking ahead, the Indonesian economy in 2009 will be strongly influenced by the dynamics of the global economy. Indonesia»s economic growth is forecasted in the range of 4.0%-5.0%, driven primarily by the household consumption component of domestic demand. Despite predictions of slowing, household consumption is still expected to show resilience, particularly in view of the government plans for an added fiscal stimulus in 2009. Furthermore, the government commitment for earlier realisation of budget expenditures, civil servant pay rises, the election year and increases in provincial minimum wage levels will also spur household consumption.
In regard to the balance of payments, the current account is forecasted to run a deficit in 2009 at about 0.11% of GDP due to deteriorating export performance, while imports are not set to decline at the same rate. International reserves at end-2009 are estimated at USD 51 billion, equivalent to 4.7 months of imports and servicing of official foreign debt.
Indonesia»s banking industry is expected to feel the effects of the global financial crisis and world economic slowdown. Nevertheless, the overall banking industry will still retain considerable resilience, as reflected in the CAR and NPL key banking indicators. The capital adequacy ratio (CAR) will remain high despite dropping slightly to 14.3%. Despite a rising trend in NPLs, the expected level is still at about 5%.
2. Latest Macroeconomic Indicators
During Q4/2008, the impact of the global economic slowdown became more deeply entrenched in the domestic economy. However, while the economy showed signs of slowing in Q4/2008, overall economic growth for the year remained relatively high. The flagging world economic growth and heightened uncertainty on financial markets bore down on Indonesia»s exports. Added to this, the deteriorating outlook for the world economy depressed investment. Indonesia»s falling export and investment growth has in turn impacted public purchasing power, putting pressure on private consumption growth. Imports have also tapered off in response to sagging domestic demand and reduced need for imported goods.
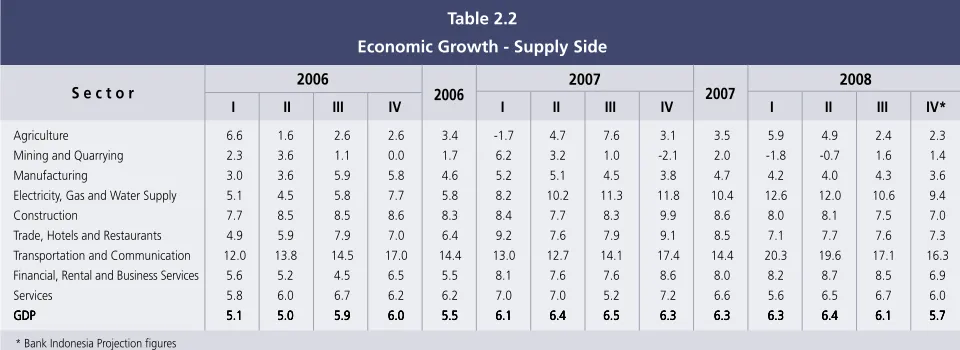
On the supply side, manufacturing, trade and transportation, while showing progressively slower expansion, still account for a dominant contribution to growth. Manufacturing growth in preliminary figures for Q4/2008 was down from the preceding period. Key to this was a drastic fall in export demand during that quarter. Similarly, preliminary figures point to slowing growth in the trade, hotels and restaurants sector in response to loss of purchasing power. On the other hand, the transport and communications sector charted high estimated growth during Q4/ 2008. Despite some slowing compared to the preceding period, growth in the transport and communications sector remained above the 2007 average. Based on these assessments, Q4/2008 GDP growth is estimated at 5.7% (yoy).
ECONOMIC GROWTH Aggregate Demand
In preliminary figures, Indonesia»s Q4/2008 economic growth slowed from the preceding quarter to 5.7% (yoy) (Graph 2.1). This downturn is explained mainly by declining export growth which in turn has weakened growth in private consumption and investment (Table 2.1). Even with the less vigorous performance of Q4/2008, the Indonesian economy still charted an estimated 6.1% growth (yoy) for 2008 as a whole.
Analysed by distribution, private consumption and exports again dominated GDP in 2008. However, the share of private consumption to GDP eased in comparison to 2007, in contrast to the mounting share of exports. The increased share of exports to GDP is explained to some extent by export growth, as expected from soaring commodity prices in the first half of 2008.
Household consumption widened by an estimated 5.0% (yoy) in Q4/2008, representing slowing growth compared to the preceding quarter. This slowdown is consistent with the movement in leading consumption indicators, currently in the contractionary stage of the cycle. Flagging growth in household
Graph 2.1
Growth of Gross Domestic Product (GDP) % y-o-y
2005 2006 2007 2008
I II III IV I II III IV I II III IV I II III IV* I II III IV
2004
5.0 6.0 7.5
6.5
5.5
4.5 7.0
Graph 2.2
Leading Indicators of Private Consumption
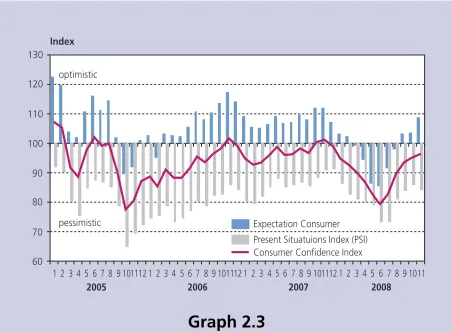
consumption is also confirmed by other indicators, including the downward trend in motor vehicle sales and slackening growth in imports of consumer goods. On the other hand, the Bank Indonesia Consumer Survey (Graph 2.2) points to improvement in consumer confidence, reflecting public optimism in future conditions. Taken together, even though household consumption recorded declining growth in Q4/2008, the effect was offset by the brisk growth in household consumption until Q3/2008, with the result that overall growth for the year was still ahead of 2007.
Investment growth slowed in Q4/2008 slowed in response to weakening external demand coupled with the heightened uncertainties in the global economy. Q4/2008 investment growth is estimated at 9.9% (yoy), down from the 12.2% growth (yoy) of the preceding quarter. Slowing investment is not only confirmed by the leading investment indictors, currently in the contractionary phase of the cycle (Graph 2.4), but also by imports of capital goods, where growth has tapered off since the beginning of Q4/2008. Nevertheless, in preliminary figures, investment grew at a faster pace overall in 2008 compared to 2007.
Analysed by component, Q4/2008 investment growth was again buoyed by non-construction investment (Graph 2.6). Non-construction investment growth edged lower in keeping with declining support from investment financing, as reflected in the onset of slowing real investment credit expansion. Compounding this was business interest in investment, which dropped slightly. According to the BPS Survey, the Business Tendency Index lost ground due to falling orders for inputs and foreign orders, added %Y-o-Y, Base Year 2000
I II III IV I II III IV I II III IV*
I t e m
Table 2.1
Economic Growth - Demand Side
2007
* Bank Indonesia Projection figures
Total Consumption 3.8 5.6 2.8 3.5 3.9 4.6 4.6 5.3 5.1 4.9 5.5 5.5 6.7 6.3 Private Consumption 2.9 3.0 3.0 3.8 3.2 4.7 4.7 5.1 5.6 5.0 5.7 5.5 5.3 5.0 Government Consumption 11.5 28.8 1.7 2.2 9.6 3.7 3.8 6.5 2.0 3.9 3.6 5.5 16.9 14.6 Gross Fixed Capital Formation 1.4 0.9 0.8 6.8 2.5 7.0 6.9 10.4 12.1 9.2 15.6 13.1 12.0 9.9
Domestic Demand 3.2 4.4 2.3 4.3 3.5 5.2 5.2 6.6 6.8 6.0 8.0 7.4 8.1 7.2
Export of Goods and Services 11.8 11.4 8.3 6.6 9.4 8.1 9.8 6.9 7.3 8.0 15.5 15.9 14.3 9.4 Import of Goods and Services 4.8 9.3 10.9 9.2 8.6 8.5 6.5 7.0 13.6 8.9 17.8 16.7 11.9 7.1 GDP
GDPGDP
GDPGDP 5.15.15.15.15.1 5.05.05.05.05.0 5.95.95.95.95.9 6.06.06.06.06.0 5.55.55.55.55.5 6.16.16.16.16.1 6.46.46.46.46.4 6.56.56.56.56.5 6.36.36.36.36.3 6.36.36.36.36.3 6.36.36.36.36.3 6.46.46.46.46.4 6.16.16.16.16.1 5.75.75.75.75.7
2007 2008
2006
2006
Import of Consumer Goods, Real M1, CPI
99 99 99 100 100 100 100 100 101
gGDPHousehold Consumer2 Series
97.5 98.0 98.5 99.0 99.5 100.0 100.5 101.0 101.5
I II III IV I II III IV I II III IV I II III IV I II III IV I II III IV I II III IV I II 2002 2003 2004 2005 2006 2007 2008 2009 contraction phase contraction phase contraction phase
Graph 2.3
Consumer Confidence Index - BI Consumer Survey
Expectation Consumer Present Situatuions Index (PSI) Consumer Confidence Index Index 60 70 80 90 100 110 120
2005 2006 2007 2008 optimistic
pessimistic 130
Graph 2.6
Construction and Non-Construction Investment Growth (%, yoy) 0 2 4 6 8 10 12 14 16 18 -30 -20 -10 0 10 20 30 40 50 (%, yoy) Manufacturing Non Manufacturing
Gross Fixed Capital Formation (rhs)
2005 2006* 2007** 2008***
I II III IV I II III IV I II III IV I II III IV
to which was real decline in selling prices. This downturn was consistent with the findings of the Bank Indonesia survey, which pointed to reduced planned investment in the second half of 2008 compared to the preceding half.
The deteriorating condition of the world economy in Q4/2008 had significant impact on export growth. Falling commodity prices on international markets alongside weakening demand for exports from developing nations, such as China and India, resulted in a pronounced drop in export growth during Q4/2008. Indications of slowing exports were evident from the export levels of various mainstay non-oil and gas commodities, led by animal/ vegetable oils and fats, rubber and rubber goods, all down compared to the preceding month (Graph 2.8). In response, exports are estimated to have charted 9.4% growth (yoy).
With domestic and external demand in decline, preliminary figures suggest falling import growth in Q4/2008. Indications of this are evident in the leading import indicators, set to remain in the contractionary stage of the cycle as far as one quarter ahead (Graph 2.9). The key reason for tapering import growth is the slowdown in imports of raw materials and capital goods. As a result, import growth in Q4/2008 is estimated lower at 7.1% (yoy).
Government Financial Operations
During Q4/2008, Government financial operations produced a fiscal deficit at Rp 35.3 trillion, down considerably from the Q4/ 2007 deficit of Rp 64.2 trillion. Accordingly, the overall deficit charted by Government financial operations during 2008 came to Rp 4.2 trillion (0.1% of GDP), a much more contractionary level compared to the same period in 2007 when the deficit reached Rp 48.8 trillion (1.3% of GDP). The low deficit is explained by higher than targeted revenues and reduced absorption of budget expenditures with revenues and grants increasing ahead of expenditures. The increased budget revenue outcome is attributable to performance in tax and non-tax revenues, while increases in budget expenditures resulted mainly from higher subsidies to cover soaring crude oil prices.
Overall budget expenditures came to 99.6% of the Revised Budget, down from 100.6% for the same period last year. Realised Central Government Expenditures came to only 99.4% of the Revised Budget, down from the outcome for the same period one year before at 101.2% of the Revised Budget. Line
Graph 2.4
Investment Leading Indicators
Graph 2.5 Import of Capital Goods
IPI, Sales Commercial Car, IPI Machinery and Equipment, Cement Consumption 99 99 100 100 101 101 102 102
2002 2003 2004 2005 2006 2007 2008
I II III IV I II III IV I II III IV I II III IV I II III IV I II III IV I Gross Fixed Capital Formation2 CLI
II III IV
(%) -10 -5 0 5 10 15 20 25 (%)
Gross Fixed Capital Formation (y-o-y)
Import of Capital Goods
-30 -10 10 30 50 70 90 110
2005 2006 2007 2008
Ministry/Government Agency expenditures for Q4/2008 did not show any increase in personnel, material and capital expenditure outcomes. Expenditure absorption improved only in the Miscellaneous Expenditures category, due to the substantial rise in Direct Cash Transfers for the poor.1 Realised Line Ministry/ Government Agency expenditures totalled only 91.5% of the Revised Budget target for 2008. However, within the non-Line Ministry/Government Agency expenditure category, the fuel subsidy began to ease in Q4/2008 in response to falling oil prices in the second half of the year. Even so, actual expenditure on the fuel subsidy for January-November 2008 surpassed the Revised Budget target, due to mounting consumption of fuels and the high crude oil prices that persisted until Q3/2008. In regard to regional government expenditures, the expenditure outcome in 2008 came to 100.1% of the Revised Budget, relatively unchanged from 99.6% of Revised Budget in the preceding year.
Concerning budget financing, the deficit that came below target resulted in a financing surplus. Due to significantly increased yields on its instruments, the Government did not launch any new issues of Government Securities during Q4/2008. The Government also cancelled an issue of global sukuk (Islamic Government Bonds) to the Islamic Development Bank at end-2008. At the end of December, net Treasury Notes totalled Rp 85.9 trillion, or 72.9% of the Revised 2008 Budget target. However, with the deficit at only 0.1% of GDP, this was more than enough for the required financing from Treasury Notes. With deficit down in comparison to financing, the Government booked a financing surplus of Rp 51.3 trillion. This surplus will be applied towards the 2009 Budget deficit, delivering an extra fiscal stimulus in 2009.2
In keeping with the pattern of previous years, Q4/2008 showed an expansionary surge due to the size of monetary expansion in December 2008. Throughout the quarter, the revenues side was marked by relatively stable taxation revenues, rising non-tax revenues and an absence of receipts from issues of Government Securities. On the other hand, expenditures mounted most importantly from progress payments on projects, redemption of maturing Government Securities and the various subsidy payouts
Graph 2.7 Business Sentiment - BPS
Graph 2.8 Export Growth by Sector
0 5 10 15 20 25 (%) (%)
Export (yoy) rhs agriculture export
industry export mineral export
I II III IV I II III IV I II III IV I II III IV I II III
2004 2005 2006 2007 2008
-50 -20 10 40 70 100 130 Nov Index
2005 2006 2007 2008
80 90 100 110 120 130 140 80 90 100 110 120 130 Index 2004
I* II* III* IV* I* II* III* IV* I* II* III* IV* I* II* III* IV* I* II* III* IV*
BTI Domestic Order Foreign Order Input Goods Order Real Sales Price (Rhs)
1 Absorption reached 98.75% for Phase 1 Direct Cash Transfers and 98.42% for Phase 2, bringing Direct Cash Transfer payments to Rp 13.12 trillion at 31 December 2008 (PT Pos Indonesia).
2 Ministry of Finance Press Release, 1 January 2009.
Graph 2.9 Leading Import Indicators
Industrial Production Index, Volume of Industrial Electricity, Automotive Production, Japan Manufacturing Index, Paper/Paper Products Production Index, Clothing and, Rp to Accessories Production Index, Korea Production and Services Index, Rp to USD, Rp to JPY, Real Consumption Credit, Real M1
98 99 99 100 100 101 101 102 102 imp_gdp import_cli 99.2 99.4 99.6 99.8 100.0 100.2 100.4 100.6 100.8
2002 2003 2004 2005 2006 2007 2008
I II III IV I II III IV I II III IV I II III IV I II III IV I II III IV I II III IV I
2009
contraction phase contraction
during December. These conditions produced Rp 106.6 trillion rupiah expansion during Q4/2008. In overall terms, Government financial operations generated Rp 128.3 trillion expansions fuelled primarily by progress payments on projects and higher than expected non-fuel subsidies. Alongside this, Q4/2008 again booked inflows from foreign currency transactions, marked by a high rate of disbursements on external borrowings and external debt repayments.
Aggregate Supply
On the supply side, preliminary figures for Q4/2008 point to slowing economic growth in keeping with demand-side developments. In Q4/2008 preliminary figures, growth in all economic sectors was down from Q3/2008 levels (Table 2.2). Manufacturing, the trade, hotels and restaurants sector and agriculture still accounted for the lion»s share of economic activity. However, analysed by contribution, the most important sources of growth were the trade, hotels and restaurants sector, manufacturing and transport and communications. The reduced sectoral growth in Q4/2008 is confirmed by a range of indicators, such as production capacity utilisation and the BPS Business Tendency Index. Capacity utilisation recorded significant decline early in Q4/2008. In a similar vein, the BPS Business Tendency Index and all component factors began to show signs of faltering during Q3/2008.
%Y-o-Y, Base Year 2000
I II III IV I II III IV I II III IV*
S e c t o r
Table 2.2
Economic Growth - Supply Side
2007
Agriculture 6.6 1.6 2.6 2.6 3.4 -1.7 4.7 7.6 3.1 3.5 5.9 4.9 2.4 2.3 Mining and Quarrying 2.3 3.6 1.1 0.0 1.7 6.2 3.2 1.0 -2.1 2.0 -1.8 -0.7 1.6 1.4 Manufacturing 3.0 3.6 5.9 5.8 4.6 5.2 5.1 4.5 3.8 4.7 4.2 4.0 4.3 3.6 Electricity, Gas and Water Supply 5.1 4.5 5.8 7.7 5.8 8.2 10.2 11.3 11.8 10.4 12.6 12.0 10.6 9.4 Construction 7.7 8.5 8.5 8.6 8.3 8.4 7.7 8.3 9.9 8.6 8.0 8.1 7.5 7.0 Trade, Hotels and Restaurants 4.9 5.9 7.9 7.0 6.4 9.2 7.6 7.9 9.1 8.5 7.1 7.7 7.6 7.3 Transportation and Communication 12.0 13.8 14.5 17.0 14.4 13.0 12.7 14.1 17.4 14.4 20.3 19.6 17.1 16.3 Financial, Rental and Business Services 5.6 5.2 4.5 6.5 5.5 8.1 7.6 7.6 8.6 8.0 8.2 8.7 8.5 6.9 Services 5.8 6.0 6.7 6.2 6.2 7.0 7.0 5.2 7.2 6.6 5.6 6.5 6.7 6.0 GDP
GDP GDP GDP
GDP 5.15.15.15.15.1 5.05.05.05.05.0 5.95.95.95.95.9 6.06.06.06.06.0 5.55.55.55.55.5 6.16.16.16.16.1 6.46.46.46.46.4 6.56.56.56.56.5 6.36.36.36.36.3 6.36.36.36.36.3 6.36.36.36.36.3 6.46.46.46.46.4 6.16.16.16.16.1 5.75.75.75.75.7
2007 2008
2006
2006
* Bank Indonesia Projection figures
These subsectors include non-ferrous basic metals, the bamboo, timber and rattan subsector and the oils and fats industry.
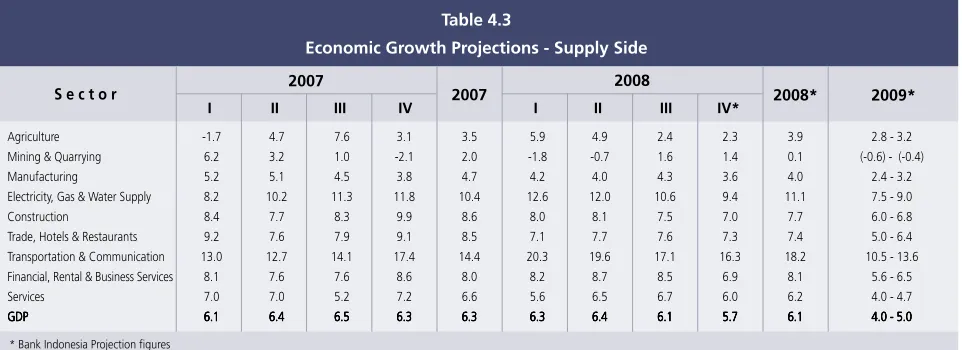
Similarly, the leading manufacturing subsectors also saw performance decline. The predominant subsectors, namely transportation, machinery and tool manufacturing and the foods, beverages and tobacco industry recorded lower estimated growth during Q4/2008. Factors contributing to flagging growth in the transportation, machinery and tools manufacturing category include depressed public purchasing power, particularly for durable goods, and the liquidity crunch. In a similar vein, Q4/2008 business expectations indicated by the Business Tendency Survey edged downwards due to falling overseas orders and orders for inputs. Taken together, overall manufacturing growth in 2008 slipped from 4.7% (yoy) in 2007 to an estimated 4.0% (yoy).
The trade, hotels and restaurants sector grew by an estimated 7.3% (yoy) in preliminary figures for Q4/2008. Slowing growth in the trade sector is explained primarily by indications of flagging household consumption brought on by loss of public purchasing power during the quarter. Further confirmation of falling growth in trade, hotels and restaurants is provided by several leading indicators, including the levelling off in the growth trend in cargo loading and unloading at the four major seaports (Belawan, Tanjung Priok, Tanjung Perak and Ujung Pandang). Similar movement was also visible in the retail sales index generated by the BI Retail Survey, which plunged significantly during the second half of 2008. At the same time, average hotel occupancy in Jakarta and Bali, the main indicator for the hotels subsector, was down as of early Q4/2008. In view of the latest developments, overall trade sector growth in preliminary figures for 2008 also slipped from 8.5% (yoy) in 2007 to 7.4% (yoy) in 2008.
In the agriculture sector, Q4/2008 growth by preliminary figures came to 2.3% (yoy), slightly lower than one quarter earlier. Among the reason for modest agriculture sector growth was the passing of the rice harvest. Also contributing to declining performance was the estates subsector, which sustained the impact of reduced export demand and falling estate commodity prices. Despite slowing Q4 performance, overall agriculture sector growth in 2008 reached an estimated 3.9%, up from 3.5% in the previous year. This was achieved on the strength of improved agriculture performance in the earlier quarters of 2008.
and quarrying sector saw reduced growth from the preceding year, with overall growth in 2008 estimated at 0.1%.
Q4/2008 growth in preliminary figures for the transport and communication sector reached 16.3% (yoy), having eased from one quarter earlier. The still brisk growth in this sector was driven mainly by the communications subsector, which showed a steady upward trend reflected in total numbers of cellular subscribers. On the other hand, the transportation subsector charted relatively stable growth as at mid-Q4/ 2008. Taken together, the transportation and communications sector grew 18.2% (yoy) in 2008, ahead of the 2007 growth recorded at 14.4% (yoy).
Construction sector growth slowed during Q4/2008 to 7.0% (yoy) in preliminary figures. Confirming this performance were several indicators, including growth in commercial property construction in the BI Commercial Property Survey. Slowing growth was also reflected in the flagging level of cement consumption until mid-Q4/2008. For 2008 overall, preliminary figures point to 7.7% growth in the construction sector, down from the 8.6% growth recorded in the preceding year.
BALANCE OF PAYMENTS
The mounting intensity of the global crisis and world economic slowdown put growing pressure on Indonesia»s balance of payments during Q4/2008. Slowing world growth and the resultant drop in commodity prices produced a contraction in exports during Q4/2008 compared to the previous quarter. As a result, the current account sustained a deficit during the quarter under review, despite the onset of declining imports. In similar developments, the capital and financial account came under further pressure in response to changes in foreign capital flows. Following these developments, international reserves reached USD51.6 billion at end-Q4/ 2008, equivalent to 4.0 months of imports and servicing of official debt.
The Current Account
Preliminary figures for the current account in Q4/2008 point to sustained downward pressure due to Indonesia»s deteriorating export performance. Weakening external demand and falling prices for export commodities combined to depress exports during Q4/2008. On the other hand, imports began to slow during Q4/2008 as a result of slowing domestic economic activity, falling oil prices and increasingly limited availability of foreign currency financing. Taken together, the merchandise trade balance is estimated to have maintained a surplus while the services, income and current transfers balance charted a deficit.
copper exports and plunging metal commodity prices on international markets. On the other hand, non-oil and gas imports in January-November 2008 reached USD93.1 billion, with growth at 41% (yoy). Imports maintained growth across all categories, with imports of consumer goods, raw materials and capital goods up 27%, 40.6% and 51.2%.
In the oil and gas sector, buoyant natural gas exports contributed to a trade surplus. During January-October 2008, oil and gas exports reached US$14.0 billion and US$14.7 billion, up 43.7% and 52.4% over the same period one year earlier. On the import side, the falling volume of oil imports was offset by soaring oil prices during the first eight months of the year. As a result, oil import value for January-October 2008 still mounted a substantial 50.1% (yoy). Accordingly, Indonesia»s oil balance of trade for January-October 2008 recorded a USD8.3 billion deficit. Nevertheless, with robust gas exports, the oil and natural gas sector still managed to chart a USD6.4 billion surplus.
Capital and Financial Account
Pressures bore down on the capital and financial account in Q4/2008. The progressively harsher and spreading impact of the crisis and the resulting global liquidity crunch has impacted inflows into Indonesia. During Q4/2008, the exodus continued of foreign funds placed in SBIs and Government Securities. On the other hand, positive developments took place in foreign direct investment flows, which charted an estimated surplus. This surplus is explained by foreign capital inflows following the mergers of several domestic banks with foreign banks. On the stock market, the index correction under way in Indonesia since mid-Q3/2008 took an even steeper turn in response to the instability on global stock markets and downward trend in world commodity prices.
International Reserves
3. Monetary Indicators and Policy,
Q4/2008
Inflationary pressure was down in Q4/2008 in comparison to both the preceding quarter and the same period one year before. The reduced inflation is explained primarily by non-fundamentals reflected in falling inflation in administered prices in the wake of the Government decision to lower subsidised fuel prices. Volatile foods inflation also showed a downward trend consistent with falling global food commodity prices. On the fundamentals side, core inflation eased in response to reduced pressure from imported inflation. At the same time, the average rupiah exchange rate plunged 15.5% during the quarter under review from Rp 9,221/ USD to Rp 10,914/USD. Pressure bore down on the rupiah from the mounting intensity of the global financial market crisis since September 2008, triggered by the Lehman Brothers bankruptcy. Nevertheless, prudent macroeconomic policy accompanied by market interventions to stabilise the rupiah helped to minimise excessive pressures brought on by these external developments.
To maintain macroeconomic stability, Bank Indonesia decided to lower the BI Rate 25 bps during Q4/2008 to 9.25%. This decision was supported by a series of measures to safeguard rupiah stability and actions to bolster the strength of monetary control operations.
INFLATION
CPI inflation eased lower during Q4/2008 in comparison to both the preceding quarter and the same period one year before. Measured quarterly, CPI inflation in Q4/2008 reached 0.54%, significantly below the preceding quarter, recorded at 2.88%, and the same quarter in the preceding year that recorded 2.09%. In response, the annual rate of inflation at end-Q4/2008 climbed to 11.06% (yoy) from 10.47% (yoy) in the previous quarter (Graph 3.1). Analysed by expenditure category, inflation came down most strongly in the foodstuffs and transportation categories (Graph 3.2). This decline is explained by the end of the Ramadan fasting month and cuts in subsidised fuel prices during December 2008. Inflation mounted only in the clothing category, due to increased prices for gold jewellery in keeping with escalating international gold prices.
The drop in CPI inflation is explained most importantly by non-fundamentals, with falling pressure from administered prices and volatile foods. Administered prices inflation eased in response to the cuts in subsidised fuel prices on 1 and 15 December 2008. In similar movement, volatile foods inflation
Graph 3.1 CPI Inflation
%, mtm %, yoy
-1 1 2 3 4 5
2006 2007 2008
MtM (SBH 2007) YoY (RHS)
0 4 8 12 18 20
16 14
10
6
2
Graph 3.4
Exchange Rate and Trade Partner Countries Inflation Graph 3.3
Inflation Expectation - Consensus Forecast
maintained a downward trend due to falling prices for international food commodities. However, analysed by contribution, core inflation was the most important factor in Q4/2008 inflation. This is explained by continued strong inflation expectations (Graph 3.3), while exchange rate depreciation had only limited impact.
Volatile foods inflation eased in Q4/2008 from both the preceding quarter and the same period one year before. This condition is explained by adequate levels of supply and falling global food commodity prices. Measured quarterly, volatile foods inflation in Q4/2008 came to 0.80%, down from both 4.65% in the preceding quarter and 4.39% in the same period in the preceding year. The softer inflation during the quarter came in response to lower international food commodity prices in which savings were passed on to downstream products, most importantly cooking oil. In the outcome of these developments, volatile foods inflation in Q4/2008 reached an annual rate of 16.48% (yoy).
Administered prices inflation was down in Q4/2008 compared to both the preceding quarter and the same period one year before. Key to this was the government decision to lower subsidised fuel prices in line with world crude oil prices. Measured quarterly, administered prices inflation slipped into deflationary territory in Q4/2008 at negative 2.36%, down from 2.89% in the previous quarter. Taken together, the annual measure of Q4/ 2008 administered prices inflation came to 15.99%.
With reduced pressure from imported inflation, core inflation moved lower during the quarter under review in comparison to both the preceding quarter and the same period one year before. The downward trend in imported inflation was signalled by softening inflation in trading partner countries and the imported wholesale price index inflation, which provides an indicator of price movements for imported goods (Graph 3.4). On a quarterly basis, core inflation in Q4/2008 reached 1.64%, down from both 2.27% in the preceding quarter and 1.93% in the same period one year earlier. Nevertheless, exchange rate depreciation during the quarter under review had a limited effect in preventing further decline in core inflation. Analysis of inflation by merchandise component shows that gold jewellery accounted for a significant share of Q4/2008 inflation at 0.18%. After factoring in these developments, core inflation for Q4/2008 reached 8.29% (yoy).
Graph 3.2
Inflation and Contribution to Inflation by Category, Goods and Services Q4/2008 (q-t-q)
12.53 10.92 7.96 6.66 7.49 3.49 2.1 2.74 0.53 0.34 0.5 1.36 16.35 7.33
0 2 4 6 8 10 12 14 16 18 % Share (m-t-m) Inflation (m-t-m)
Proccesed Food Food, Beverages, Cigarattes & Tobacco Housing, Electricity, Water, Gas, and Fuel Clothing Health Education, Recreation & Sport Transportation, Communication & Financial Service
%, yoy 5 6 7 8 9 10 11 2007 2008 2008 2009
1 2 3 4 5 6 7 8 9 10 11 12 1 2 3 4 5 6 7 8 9 10 11 12
Trade Partner Countries Inflation (RHS)
%, yoy CPI (LHS) %, yoy -12 -7 -2 3 8 13 18 23 0 1 2 3 4 5
2004 2005 2006 2007 2008
Depreciation/Appreciation Rp/USD (LHS)
2 4 6 8 10 12 2 4 6 8 10 12 2 4 6 8 10 12 2 4 6 8 10 12 2 4 6 8 10 12
16.88 4.07
Graph 3.5
Rupiah Exchange Rate Average
RUPIAH EXCHANGE RATE
The rupiah exchange rate came under unrelenting pressure from the rising intensity of the global financial market crisis since September 2008, following the bankruptcy of the Lehman Brothers investment house. As a result, the rupiah depreciated both in average value and point-to-point in Q4/ 2008, while charting increased volatility. During the quarter, the average rupiah value fell to Rp 10,914/USD, a drop of 15.5% from the previous quarterly average at Rp 9,221/USD (Graph 3.5). Point-to-point, the rupiah weakened 13.9% to Rp 10,900/USD compared to the previous end-quarter level of Rp 9,385/USD. The downward movement in the rupiah led to a sharp rise in volatility from 1.17% to 9.78% in Q4/2008 (Graph 3.6).
The heightened risks of global financial market turmoil, the escalation of the financial sector crisis in the US and perceptions of the balance of payments outlook all influenced movement in the rupiah during Q4/2008. The economic slowdown in advanced nations (G3) brought on by the liquidity squeeze and collapse in bank lending has had far reaching impact on regional economies. The fall in exports in response to weakening export demand in recession-hit developed nations has worsened the outlook for Indonesia»s balance of payments. At the same time, the spillover of the US financial crisis to the automotive sector triggered capital flight, as foreign investors shift into risk aversion mode. This led to reverse flows of foreign capital from regional market assets and downward pressure on regional currencies. Still robust fundamentals in the domestic economy combined with a tight monetary policy stance and stability on the forex market enabled Bank Indonesia to fend off further depreciating pressure on the rupiah.
The continued pressure in external conditions led to renewed escalation in risks. The deteriorating condition of the global economy triggered a resurgence of flight to quality, particularly from emerging markets. Reflecting this was a sharp rise in the EMBIG (Emerging Market Bond Index Global) indicator, representing the spread between US Treasury yield and composite yield from emerging markets. Investor pessimism over placements in rupiah assets sparked a steep rise in the yield spread from 411 bps (end-Q3/2008) to 716 bps at end-Q4/2008 (Graph 3.7). Alongside this, expectations of depreciation were still evident from a rise in the swap premium indicator, which at one point touched 20% (Graph 3.8).
Graph 3.6
Rupiah Exchange Rate Volatility
Graph 3.7
Yield Spread between Global Bond RI and UST-Note
Daily Exchange rate Quarterly Average
2007 2008 Rp/USD 8600 9000 9400 9800 10200 10600 11000 11400 11800 12200 12600 10900 9,103 9,221 10,914 1
Jan29JanFeb26Mar26Apr23May21Jun1816JulAug13Sep10Oct8Nov5Dec3Dec31Jan28Feb25Mar24Apr21May19Jun1614JulAug11Sep8Oct6Nov3Dec1Dec29
Rp/USD % 1/3 9.78 -5.00 10.00 15.00 20.00 25.00 Daily Exchange Rate
Daily Volatility Quarterly Volatility
2005 2006 2007 2008
1/3 1/3 1/3
8000 8500 9000 9500 10000 10500 11000 11500 12000 12500 Rp/USD
IDR/USD Yield Spread
2008 10900 7.16 % 9,000 9,500 10,000 10,500 11,000 11,500 12,000 12,500 2.00 4.00 6.00 8.00 10.00 12.00
Mar Apr Jun Aug
Graph 3.9
Comparison of Yields Across Various Countries
Graph 3.10 Forex Demand and Supply
The tight bias policy stance adopted by BI at a time of global rate cuts has widened the yield spread for the rupiah. Yield on rupiah investments, indicated by the interest rate differential and the spread between domestic currency Government Bonds and yield on US T-Notes, remained high in comparison to regional neighbours (Graph 3.9). The interest rate differential, or Uncovered Interest Parity, widened from 7.05% at end-Q3/2008 to 10.9% at the end of the quarter under review. After adjusting this yield for risks,1 the Covered Interest Parity for the quarter under review came to 3.78%.
The money market turmoil triggered by the crisis on US credit markets have borne down on market actors, engendering global market pessimism. As a result, foreign investors pulled their money out of SBIs and Government Securities, despite share prices on the rise. Foreigner offloading of SBIs and Government Securities reached Rp 11.9 trillion (USD1.2 billion) and Rp 16.8 trillion (USD1.6 billion) during the quarter, bringing foreign holdings to Rp 8.5 trillion (USD752 million) and Rp 87.4 trillion (USD7.8 billion) respectively. In contrast, foreign placements in stocks widened by Rp 11.6 trillion (USD1.06 billion).
Domestic demand for foreign currencies was again dominated by corporates in line with sustained high imports and servicing of external debt (Graph 3.10). Averaged over the quarter under review, corporate demand for foreign currencies fell from USD354 per day in the preceding quarter to about USD253 million per day.
MONETARY POLICY Policy Strategy
In Q4/2008, Bank Indonesia initially raised the BI Rate by 25 bps early in the quarter, before lowering the rate 25 bps to 9.25% in the final month. This decision was taken to safeguard the achievement of the inflation target with consideration of overall macroeconomic conditions and financial system stability. This level of the BI Rate was subsequently reflected in movement in the overnight interbank rate.
Following the introduction of interest rates as the operational target in monetary policy, the monetary policy signal indicated by movement in the BI Rate has been transmitted by several
Graph 3.8
Swap Premium in Various Tenors
1 In this case, the risk indicator used is the yield spread between Indonesian Government foreign currency bonds and US T-Notes.
Source: Reuters (processed) %
6-Months Premium 12-Months Premium 1-Month Premium 3-Months Premium
2008 25 20 15 10 5 0
Jan Jan Mar Mar Apr May Jun Jul Aug Sep Oct Nov
bps Source: Bloomberg 50 250 450 650 850 1050 1250 2008
Jul Aug Sep Oct Nov Dec
Philippines Thailand Malaysia Indonesia Vietnam China
Net S(+)/D(-) from domestic actors Net S(+)/D(-) from foreign actors Net S(+)/D(-) Total foreign and domestic actors Exchange Rate (rhs)
Million USD IDR/USD
Excess Supply Excess Demand -1000 -5000 -3000 1000 3000 5000 8600 9100 9600 10100 10600 11100 11600 2007 2008
Jun Aug Oct Apr
Feb Dec
Jul Aug Sep Oct Nov Dec Jan Feb Mar Apr May
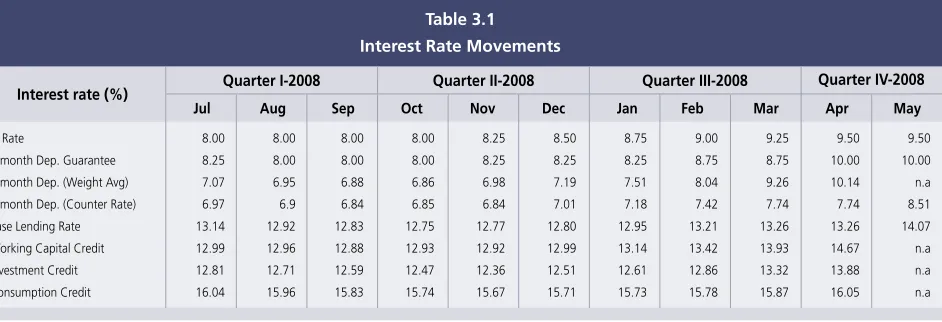
Interest rate (%)
BI Rate 8.00 8.00 8.00 8.00 8.25 8.50 8.75 9.00 9.25 9.50 9.50
1-month Dep. Guarantee 8.25 8.00 8.00 8.00 8.25 8.25 8.25 8.75 8.75 10.00 10.00
1-month Dep. (Weight Avg) 7.07 6.95 6.88 6.86 6.98 7.19 7.51 8.04 9.26 10.14 n.a 1-month Dep. (Counter Rate) 6.97 6.9 6.84 6.85 6.84 7.01 7.18 7.42 7.74 7.74 8.51
Base Lending Rate 13.14 12.92 12.83 12.75 12.77 12.80 12.95 13.21 13.26 13.26 14.07 Working Capital Credit 12.99 12.96 12.88 12.93 12.92 12.99 13.14 13.42 13.93 14.67 n.a
Investment Credit 12.81 12.71 12.59 12.47 12.36 12.51 12.61 12.86 13.32 13.88 n.a Consumption Credit 16.04 15.96 15.83 15.74 15.67 15.71 15.73 15.78 15.87 16.05 n.a
Table 3.1 Interest Rate Movements
Quarter I-2008 Quarter II-2008 Quarter III-2008 Quarter IV-2008
channels to the financial sector. On the money market, rates for various tenors tracked movement in the BI Rate with improvement in variation among tenors. This has resulted in a strengthening of transmission to bank interest rates, led by time deposit rates. Loan interest rates, on the other hand, have responded more slowly. The BI Rate hikes have begun to stimulate more vigorous growth in bank depositor funds alongside slightly reduced lending growth. On the stock market, the IDX composite index sustained 51% correction during 2008 to close the year at 1,355. In October 2008, the IDX composite sank to as low as 1,139. Market pressure bore down on Government Securities, with yields rising above the levels reached in 2005. However, approaching end of year, Government Securities began to show renewed improvement in performance. On the mutual funds market, NAV steadily weakened in keeping with performance of underlying assets.
In the area of exchange rate policy, Bank Indonesia steadily pursued a series of measures to maintain stability in the rupiah. Efforts to safeguard rupiah stability were pursued through prudent monetary policy alongside consistent actions to stabilise the exchange rate. This action was taken to curb excessive exchange rate volatility by maintaining adequate levels of foreign exchange reserves commensurate with the needs of economic fundamentals. Complementing this was a more robust communications strategy, improved effectiveness in prudential regulations and continual monitoring of forex payments in support of this policy.
Interest Rates
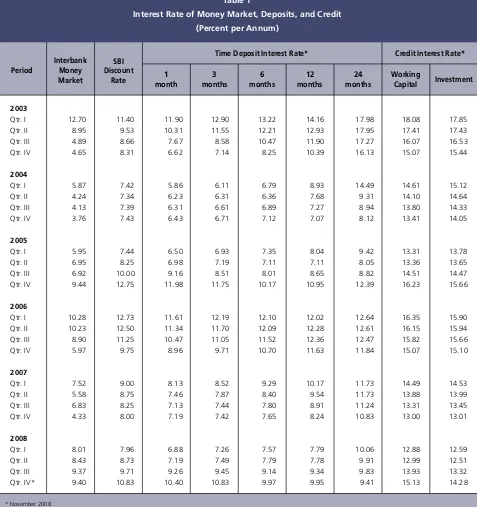
The rise in the BI Rate was followed by greater magnitude of upward movement in time deposit rates as banks sought to increase their deposit funding base. Calculated by weighted average, the 1-month deposit rate climbed 44.65% (321 bps) during November 2008, significantly greater than the hike in the BI Rate. Leading in the rise in deposit rates were private national banks, followed by foreign and joint ventures and domestic private commercial banks. In contrast, regional development banks were again slow to follow suit with their deposit rates. Measured over the month, time deposit rates were highest for the 1-6 month tenors, having risen to 14.62%-15.42%. However, rates in the 12 and 24 tenors eased at end of year, due to expectations of a cut in the BI Rate.
Increases in the BI Rate were also transmitted to lending rates. The rise in cost of funds was passed on to loan interest rates, most importantly for working capital and investment credit. In November 2008, the weighted average rate for working capital credit soared 197 bps on the back of increases at foreign and joint venture banks and private national banks. The average rate for investment credit similarly climbed 109 bps, with rate increases recorded mainly by foreign and joint venture banks and private national banks. On the other hand, regional development banks were again the slowest to respond to increases in the BI Rate.
Funds, Credit and the Money Supply
Depositor funds showed upward movement at the end of the year, following an increase in time deposit rates (Graph 3.11). In November 2008, depositor funds recorded 19.13% expansion (yoy), ahead of 17.67% (yoy) in 2007 (Graph 3.11). The leading growth component was time deposits, which climbed 22.28%. Savings and demand deposits, however, saw growth slip to 18.58% and 14.25%. The most important depositors contributing to growth in time deposits were regional government enterprises, private companies and individuals. Contrasting this was slowing growth in savings deposits across all depositor categories (state owned enterprises, private companies, regional governments and individuals), with the exception of government agencies/ institutions. This appears to be linked to migration of funds to time deposits in pursuit of more attractive interest rates.
The hikes in the BI Rate were in fact followed by further acceleration in credit expansion. On the credit market, the monetary policy lag persisted, as evident in annual credit expansion at 37.9% in November 2008. At this level, credit expansion was ahead of end-2007, when expansion reached only 26.5%. Analysed by purpose of use, the leading component in annual credit expansion was investment credit, followed by working capital credit and consumption credit. In disaggregation by debtor, the increased credit expansion was channelled mainly to state-owned insurance and finance companies, private finance companies and rural banks.
Graph 3.11 Funding vs Credit
Credit Interest Rate and Deposits (%) (%, y-o-y)
6 9 12 15 18 21 24 33 36 39
6 8 10 12 14 16 18
2005 2006 2007 2008
Total Deposits Total of Credit rCredit (average) rDeposits (average) 30
27
Graph 3.13 JCI in Year 2008 2,900 2,700 2,500 2,300 2,100 1,900 1,700 1,500 1,300 1,100
Jan Feb Mar Apr May Jun Jul Aug Sep Oct Nov Dec
IDX Composite, 30 December 2008: 1,355.4
USA Recession Risk Threat of Global Economic Slowdown (G7)Oil Price Hike toUSD110/barrel
-Unwinding Carry trade
Fiscal Risk Increase, Government Securities
Markets Worsen, Inflationary Pressure GSE
Financial Crisis Bankruptcy of Lehman Brothers, other institution have potential to go bankrupt as well Uncertain Global Condition, Liquidity Injection Speculation
can't hold recession Stock Exchange Suspended FFR 1%
Capital Outflow by Weakening of the exchange rate, the widening of the rupiah exchange rate on the NDF market against the spot position
Domestic stock exchange increase, worsen by global condition FFR 3% FFR 3.5% Rating Warren Buffet reinsured FFR 2.5% + liquidity injection FFR 2% GDP release of 6.3% (above projection figures of
6.1%)
Fed and other Central Bank statements concerning doing liquidity injection once again
USA election BI and Government new policy and also buyback 8 8 8 8 8.25 8.5 8.75 9 9.25 9.5 9.25 2008
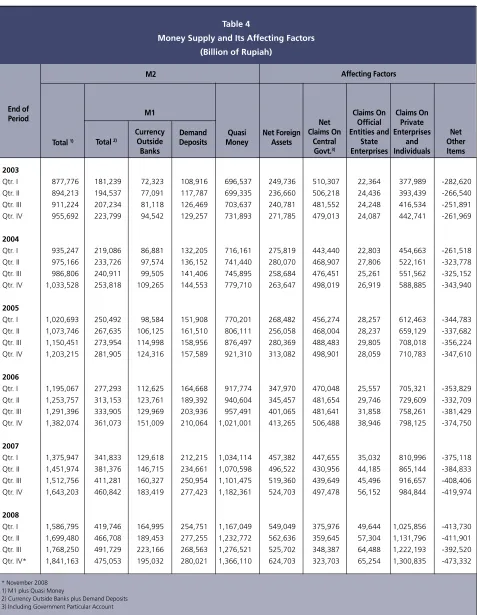
Economic liquidity expanded at a slower rate, below historical levels. In November 2008, M1 and M2 growth reached 11.9% and 18.3%. M1 and M2 growth for January-November averaged 18.9% and 16.3%, representing an overall decline from 2007 when growth reached 22.7% and 15.6%. Similarly, real M1 and M2 growth for January-November 2008 averaged 8.4% and 5.1% (Graph 3.12), down from the same period one year earlier. This comes alongside weakened purchasing power in the wake of the steeper inflation and exchange rate depreciation in 2008 compared to 2007.
Financial Markets
In 2008, the stock market underwent steep correction. After trading opened in 2008, the IDX composite touched a level of 2,830 (9 January 2008), the highest ever in Indonesia»s stock market history. Following this, however, the IDX underwent heavy correction to touch 1,111.39 (28 October 2008), the lowest ever since 2005. In recent developments, the IDX began recovering ground as global financial market turmoil eased, with the index up slightly at 1,355 on close at year-end (Graph 3.13). Consistent with these conditions, market capitalisation tumbled 43.89% to close at Rp 1,076.5 trillion.
IDX index correction was driven more by external factors that have their origin in the unwinding of the global financial market bubble and resultant global liquidity crunch and significant US dollar gains against other world currencies. This process ultimately triggered deleveraging and global recession. As a result of this crisis, financial institutions face liquidity shortages and some are even bankrupted, prompting foreign investors to pull their funds out of emerging markets, including Indonesia. This fallout from this has impacted stock markets on a global scale, which took significant correction during 2008. The action by the Fed in progressive cuts in the Fed Funds Rate to near zero, followed by coordinated interest rate cuts by other nations, liquidity injections and bail outs of some financial institutions and companies in the real sector helped boost market confidence, despite the inevitable correction.
In Indonesia, IDX index movement in 2008 was influenced by various risks including the slide in the rupiah to a low of Rp 12,700 to the USD (24 November 2008) and the widening of the rupiah exchange rate on the Non Delivery Forward (NDF) market against the spot position. In addition, share prices were influenced by negative rumours over bank liquidity and the complexity of problems affecting stocks.
Despite heightened uncertainty on financial markets, foreign investors still booked a net purchase with a short-term ownership trend. In 2008, foreign investor activity
Graph 3.12 Real Growth in M1 and M2 %, y-o-y (12) (9) (6) (3) 0 3 6 9 12 15 18 21 24 27 30 M1 Real Currency Real M2 Real
2000 2001 2002 2003 2004 2005 2006 2007 2008
on the stock market took a speculative turn, evident in the rapid pace of selling and buying activity. This condition reflects foreign investor behaviour marked by responsive tendencies amid global financial market uncertainty. Near the end of 2008, predominantly undervalued shares in combination with the onset of recover in global financial market conditions encouraged foreign investors to book a net purchase. Even so, foreigner buying activity tended to be short-term, with investors engaging in profit taking on these undervalued assets. For 2008 overall, foreign investors booked a net purchase of Rp 18.7 trillion, substantially down from 2007 when the net purchase reached Rp 32.92 trillion (Graph 3.14). The dynamic activity of foreign investors on the stock market during 2008 in tandem with heavy selling by domestic investors also impacted the foreign ownership portion, which widened from 63.6% in the preceding year to 67.8%.
Government Securities again came under pressure during Q4/ 2008. In 2008, yield on Government Securities in the benchmark 10-year tenor reached a high of 20.96% (27 October 2008). Yield was also up evenly across all tenors and series. The BI decision to lower the BI Rate from 9.5% to 9.25% in December 2008, downward revision of inflation forecasts, appreciation in the exchange rate and onset of improvement in external risks led to renewed decline in Government Securities yield. Measured annually, yield on Government Securities mounted 270 bps for long-term tenors, while yields on short and medium-term tenors were up 231 bps and 207 bps (Graph 3.15).
The deteriorating performance of Government Securities in 2008 is explained more by external factors. The global financial market turmoil that has led to a global liquidity crunch and the deleveraging process prompted a sustained rise in Government Securities yield across all tenors. Further pressure on yields came with the weakening of the exchange rate. The slipping performance of Government Securities was consistent with the increased emerging market risk reflected in various indicators presented in the IMF»s October 2008 Global Stability Financial Report (GSFR). There is even a newly emerging tendency for emerging market assets to start behaving in a matter akin to toxic assets.2 In a similar development, Indonesia»s EMBIG mounted significantly. Under these conditions, the widening interest rate differential had no visible significant influence.
Graph 3.14 Net Foreign Buying
Graph 3.15
Yield Government Securities in Various Tenors
Graph 3.16
Daily Volume Trade of Government Securities Average Trillion Rp -20 40 60 80 100 120 140 160 180 2007 2008
Foreign Net Buying Accumulation
1 2 3 4 5 6 7 8 9 10 11 12 1 2 3 4 5 6 7 8 9 10 11 12
Data, 12/31/2008 Source: Bloomberg % 100bps 0 4 8 12 16 0 1 2 3 4 5 6 7 8 Change of Monthly (RHS) Now Last Month
1YR 2YR 4YR 5YR 6YR 7YR 8YR 9YR 10YR 15YR 20YR 30YR
Trillion Rp 0 2 4 6 8 10
RRH-Government Securities Trade Volume
2007 2008
1 2 3 4 5 6 7 8 9 10 11 12 1 2 3 4 5 6 7 8 9 10 11 12
Graph 3.17
Daily Frequency Trade of Government Securities Average
3 Official Bapepam data for October 2008. NAV data not updated due to ongoing development of the mutual fund information system.
X, Times
0 50 100 150 200 250 300 350 400 450 500
1 2 3 4 5 6 7 8 9 10 11 12 1 2 3 4 5 6 7 8 9 10 11 12
2007 2008
RRH-Frequency
Market confidence was jarred by the turmoil on the Government Securities market. Reflecting this was the thin volume and frequency of Government Securities transactions, indicating a continued wait-and-see stance among market actors in responding to the volatility on global financial markets. Total 2008 trading volume in Government securities reached Rp 1,246.7 trillion, down from the 2007 level of Rp 1,564 trillion (Graph 3.16). Alongside this, average daily frequency of Government Securities trading was relatively stable at 266 trades daily in 2008, compared to 253 in 2007 (Graph 3.17).
4. The Indonesian Economic Outlook
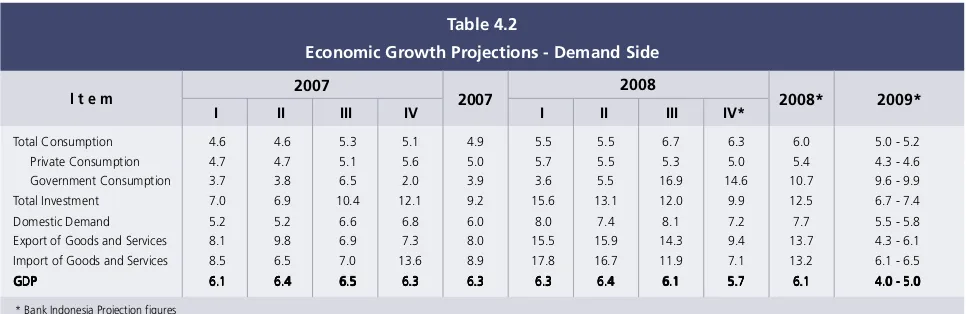
In 2009, the Indonesian economy is forecasted to chart 4.0%-5.0% growth. The downturn in economic growth is explained largely by the dynamics of the global economy, marked by recession in major trading partners and economic slowdown among trading partners in general. The economic recession and slowdown, followed by falling export commodity prices and limited availability of trade financing, augurs for substantially lower export growth in 2009 compared to 2008. Depressed export growth is expected to impact public purchasing power and put downward pressure on household consumption. Financing of consumption is similarly predicted to grow at a reduced rate. Despite this, consumption growth is forecasted to stay relative strong in comparison to the historical average, due to several factors: increases in provincial minimum wage levels (UMP), pay rise for civil servants, the election year, government decisions concerning taxation and the multiplier effects of government policies. Slowing export and consumption growth followed by tightened investment financing will in turn reduce investment growth and also imports. Analysed by sector, the external slowdown is predicted to have direct impact on tradable sectors (manufacturing, agriculture and mining).
Inflationary pressure is forecasted to ease in 2009, with inflation falling to 6%±1%. On the fundamentals side, inflationary pressure will soften in response to reduced imported inflation due to the effect of falling world commodity, food and energy prices and subdued expectations of inflation. Indonesia»s excellent food crop harvests in 2008 and the slowdown in aggregate demand will also support low inflation levels in 2009. On the non-fundamentals side, lower inflation in 2009 will be supported by adequate supply and smooth distribution of staple goods, as well as minimum increases in administered prices.
ASSUMPTIONS AND SCENARIOS International Economic Conditions
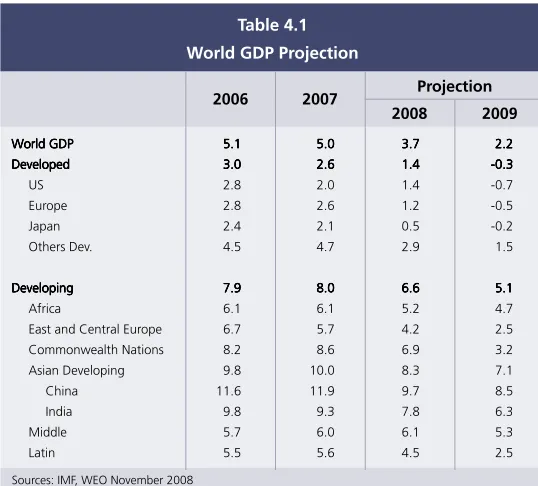
growth is forecasted at 2.2% in 2009, down from 2008 (Table 4.1).
Due to weakening world demand, commodity prices are expected to drop significantly in 2009. In early 2009, global commodity prices are forecasted to maintain a downward trend. In Q1/2009, the average Minas crude price is set to fall below the annual average. The influence from sentiment driven by falling world demand remains stronger than that of conflict in the Middle East, with Minas crude forecasted to reach about USD50 per barrel in Q1/ 2009. Metal prices are expected to decline further overall in Q1/2009 compared to Q4/2008. This is explained by falling demand for metals in response to manufacturing sector contraction in some countries. With international commodity prices in decline, inflationary pressure is expected to ease in 2009. Inflationary pressure in developed nations will come down from the effect of falling global commodity prices driven by weakening demand, US dollar appreciation and heightened uncertainty on financial markets. The ongoing decline in domestic demand in developed countries now augurs for potential deflation, especially in nations with near-zero interest rates. At the same time, inflation in developing countries is also slowing, more because of the effect of falling prices for global commodities and especially oil. The downward trend in world inflationary pressure supports the outlook for a loose bias in world monetary policy.
Fiscal Policy Scenario
The ongoing global economic crisis could potentially inflate the 2009 Budget deficit. The Budget Law (Act No. 41/2008 dated 10 November 2008) stipulates the 2009 Budget deficit at Rp 51.28 trillion, or 1% of GDP. However, the global financial crisis, which is far from over, has potential for exacerbating the deficit, mainly due to the economic growth forecast that comes below the 2009 Budget assumption set at 6%. The increased deficit is expected to be financed by excess financing from the 2008 Revised Budget and drawing on bilateral and multilateral standby loans. The deficit is expected to ease as crude oil prices move to lower levels.
ECONOMIC GROWTH OUTLOOK
The global financial turmoil is expected to bear down on the Indonesian economy in 2009. Economic growth is predicted to slow from 6.1% (2008) to 4.0%-5.0% (2009). Slackening global demand and falling commodity prices will be transmitted to the domestic economy through the international trade channel. Exports of goods World GDP
World GDPWorld GDP
World GDPWorld GDP 5.15.15.15.15.1 5.05.05.05.05.0 3.73.73.73.73.7 2.22.22.22.22.2 Developed
DevelopedDeveloped
DevelopedDeveloped 3.03.03.03.03.0 2.62.62.62.62.6 1.41.41.41.41.4 -0.3-0.3-0.3-0.3-0.3 US 2.8 2.0 1.4 -0.7 Europe 2.8 2.6 1.2 -0.5 Japan 2.4 2.1 0.5 -0.2 Others Dev. 4.5 4.7 2.9 1.5
Developing DevelopingDeveloping
DevelopingDeveloping 7.97.97.97.97.9 8.08.08.08.08.0 6.66.66.66.66.6 5.15.15.15.15.1 Africa 6.1 6.1 5.2 4.7 East and Central Europe 6.7 5.7 4.2 2.5 Commonwealth Nations 8.2 8.6 6.9 3.2 Asian Developing 9.8 10.0 8.3 7.1 China 11.6 11.9 9.7 8.5 India 9.8 9.3 7.8 6.3 Middle 5.7 6.0 6.1 5.3 Latin 5.5 5.6 4.5 2.5
Table 4.1 World GDP Projection
Sources: IMF, WEO November 2008
and services are set to grow at only half the rate achieved in 2008. Amid these adverse external conditions, domestic demand is expected to provide the driving force for growth. Steeper decline in private consumption in 2009, a result of deterioration in the income effect and exports, will be offset by the spending by election contestants, increases in provincial minimum wages and civil servant salaries and government policies designed to boost incomes. On the other hand, investment will see reduced growth due to weakening demand and increased business uncertainty.
Outlook for Aggregate Demand
Household consumption is forecasted to slow considerably during 2009. After a year of high growth in 2008, household consumption is set to climb only 4.3%-4.6% in 2009. The slowing in household consumption that became visible during Q3/2008 will take deeper hold in 2009. This downturn will result from declining public purchasing power, hit by the fallout from deteriorating export performance (income effect) and weakening prices for stocks/other financial assets (wealth effect). Declining exports are expected to reduce available employment, as experienced by oil palm smallholders and workers in the textile and textile products industry. These job losses will encourage precautionary saving by consumers. Also sapping household consumption will be reduced availability of household consumer financing, particularly from banks. In 2009, growth in loan disbursements - including consumption credit - is forecasted to drop to the 15%-20% range. This decline is linked to perceptions of rising debtor risks and the tendency by banks to maintain relatively high levels of liquidity in times of uncertainty.
In spite of these developments, household consumption growth is expected to hold slightly above the 2001-2008 historical average of 4.2%. This prediction takes account of increases in provincial minimum wage levels and civil servant salaries, fiscal support from government policies and the holding of the 2009 national
%Y-o-Y, Base Year 2000
I II III IV I II III IV*
I t e m
Table 4.2
Economic Growth Projections - Demand Side
2007
* Bank Indonesia Projection figures
Total Consumption 4.6 4.6 5.3 5.1 4.9 5.5 5.5 6.7 6.3 6.0 5.0 - 5.2 Private Consumption 4.7 4.7 5.1 5.6 5.0 5.7 5.5 5.3 5.0 5.4 4.3 - 4.6 Government Consumption 3.7 3.8 6.5 2.0 3.9 3.6 5.5 16.9 14.6 10.7 9.6 - 9.9 Total Investment 7.0 6.9 10.4 12.1 9.2 15.6 13.1 12.0 9.9 12.5 6.7 - 7.4 Domestic Demand 5.2 5.2 6.6 6.8 6.0 8.0 7.4 8.1 7.2 7.7 5.5 - 5.8 Export of Goods and Services 8.1 9.8 6.9 7.3 8.0 15.5 15.9 14.3 9.4 13.7 4.3 - 6.1 Import of Goods and Services 8.5 6.5 7.0 13.6 8.9 17.8 16.7 11.9 7.1 13.2 6.1 - 6.5 GDP
GDPGDP
GDPGDP 6.16.16.16.16.1 6.46.46.46.46.4 6.56.56.56.56.5 6.36.36.36.36.3 6.36.36.36.36.3 6.36.36.36.36.3 6.46.46.46.46.4 6.16.16.16.16.1 5.75.75.75.75.7 6.16.16.16.16.1 4.0 - 5.04.0 - 5.04.0 - 5.04.0 - 5.04.0 - 5.0
elections. Provincial minimum wages are set to rise ahead of inflation in 2009. Government policies stimulating economic activity include the increased tax-free income bracket, simplification of corporate and personal taxation rates, tax incentives for publicly-listed companies and MSMEs, reduced tax on corporate dividends increased budget allocations for social assistance. These budget allocations will be used for the Rural Community Block Grant Empowerment Programme (PNPM), subsidised health care and conditional direct cash transfers.
The national elections in 2009 are expected to provide a boost for household consumption growth, although not to the same extent as in the 2004 elections. This is explained by diminished financial contributions to contesting parties as a result of reduced export revenues and deteriorating stock market gains. In addition, the share of credit-financed household consumption remains low at about 8%-9%, indicating that credit still does not play a major role in financing household consumption. Higher incomes among the middle and upper class groups, which generally mounted 19%-22% in 2008 compared to 2007, are envisaged as a key source bolstering household consumption in 2009.
Government consumption is predicted to taper off in 2009, with growth in the range of 9.6%-9.9%. This downturn is explained most importantly by reduced equalisation fund allocations for the regions in the wake of falling crude oil prices. However, central government consumption is forecasted to widen further, driven among others by the budget for national election activities and salary increases for civil servants. In the first half of 2009, government consumption is forecasted to maintain positive growth before gradually easing in the second half of the year with the conclusion of the national elections.
Investment activity is forecasted to grow 6.7%-7.4% in 2009, down from 2008. This is a result of weakening demand and likelihood of tight financing availability from the banking system. In 2009, the investment slowdown will be especially steep in non-construction activity. This type of investment depends to a great extent on economic conditions. Under conditions of heightened uncertainty, business tends to delay expansion. Indications of delayed investment are evident in textile and textile products manufacturing, the cement industry and expansion of oil palm plantations. These investment delays are to a large extent caused by financial constraints and weak demand.
Significant slowdown is expected in growth of merchandise exports to 4.3%-6.1%, due to the effects of the downturn in the world economy. The prolonged recession in developed nations, including the United States, Japan and the Eurozone, alongside depressed growth in emerging markets serving as key destinations for Indonesian exports, such as China and India, will bear down on Indonesia»s export growth. At the same time, limited availability of trade financing is also predicted to hamper future exports. The impact of sluggish external demand and financing that began sapping export performance in Q4/2008 is forecasted to carry over into 2009. According to Bank Indonesia research, Indonesia»s major export commodities are highly elastic to incomes in key trading partners, i.e. Singapore, the US and Japan. Falling incomes in these nations will impact exports of mainstay commodities such as textiles and textile products, metals, paper, coal and chemicals. Added to this, the tightening of export financing schemes is forecasted to dampen exporter performance. Concerning imports, growth is expected to see significant cuts in 2009 (growth in 6.1%-6.5% range) compared to 2008. Weak demand - both from domestic economic activity and exports - resulted in low levels of import demand.