ESS
–
Extension of Social Security
Social protection systems in Latin America:
An assessment
José Antonio Ocampo and Natalie Gómez-Arteaga
ESS
–
Working Paper No. 52
Social Protection Department
ILO Regional Office for Latin America and the Caribbean
Copyright © International Labour Organization 2016 First published 2016
Publications of the International Labour Office enjoy copyright under Protocol 2 of the Universal Copyright Convention. Nevertheless, short excerpts from them may be reproduced without authorization, on condition that the source is indicated. For rights of reproduction or translation, application should be made to ILO Publications (Rights and Licensing), International Labour Office, CH-1211 Geneva 22, Switzerland, or by email: [email protected]. The International Labour Office welcomes such applications.
Libraries, institutions and other users registered with a reproduction rights organization may make copies in accordance with the licences issued to them for this purpose. Visit www.ifrro.org to find the reproduction rights organization in your country.
ILO Cataloguing in Publication Data
Ocampo, Joś Antonio; Ǵmez-Arteaga, Natalie
Social protection systems in Latin America : an assessment / Joś Antonio Ocampo, Natalie Ǵmez-Arteaga ; International Labour Office, Social Protection Department (SOCPRO). - Geneva: ILO, 2016
(Extension of Social Security series ; No. 52) International Labour Office Social Protection Dept.
social protection / social security / poverty alleviation / equal rights / economic development / Latin America 02.03.1
The editor of the series is the Director of the Social Protection Department, ILO. For more information on the series, or to submit a paper, please contact:
Isabel Ortiz, Director Social Protection Department International Labour Organization
4, route des Morillons
CH-1211 Geneva 22 (Switzerland)
Tel.: +41.22.799.62.26 Fax:+41.22.799.79.62 email: [email protected]
The designations employed in ILO publications, which are in conformity with United Nations practice, and the presentation of material therein do not imply the expression of any opinion whatsoever on the part of the International Labour Office concerning the legal status of any country, area or territory or of its authorities, or concerning the delimitation of its frontiers.
The responsibility for opinions expressed in signed articles, studies and other contributions rests solely with their authors, and publication does not constitute an endorsement by the International Labour Office of the opinions expressed in them.
Reference to names of firms and commercial products and processes does not imply their endorsement by the International Labour Office, and any failure to mention a particular firm, commercial product or process is not a sign of disapproval.
ILO publications and digital products can be obtained through major booksellers and digital distribution platforms, or ordered directly from [email protected]. For more information, visit our website: www.ilo.org/publns or contact [email protected].
Abstract
This paper assesses the present state of social protection systems in Latin America and their future challenges. It analyses the positive effects of the recent efforts to expand Social Protection Systems (SPS) on the reduction of poverty and inequality in the region. SPS have improved both in terms of coverage as well as in the scope of the protection offered with new dimensions of the system in most countries in Latin America. Nevertheless, there are still important inequalities in the access to social protection by type of employment and income. Contributory coverage is still low, and a significant portion of the population is unprotected. In turn non-contributory assistance, with higher coverage, provides only small benefits. In this context, the incidence of social spending through direct transfers is still low compared to other developed countries. An expansion of social protection systems based on a combination of both non-contributory and contributory schemes to achieve universal coverage is essential.
JEL Classification: H53, H55, D63.
Contents
Page
Abstract ... iii
Authors ... vii
Acknowledgements ... vii
Executive summary ... ix
Acronyms ... xi
1. Introduction ... 1
2. A multidimensional index to measure Social Protection Systems in Latin America ... 3
3. The present state of Social Protection Systems in Latin America: higher coverage but important inequalities ... 9
4. Three myths about social protection, redistribution and economic development ... 16
5. The redistributive effectiveness of transfers and the effect of fiscal policy ... 22
6. The challenges in building more comprehensive SPS ... 29
7. Conclusion ... 34
References ... 35
Annexes 1. Indicators to construct the Social Protection Index ... 41
2. Overview of national Social Security Systems ... 42
3. Achievments on each of the nine indicators of the SPI by country – Circa 2002-2012... 43
4. Concentration Coefficient disaggregated by program for latest available year ... 44
Concentration share by decile of all direct transfers (non-contributory pensions, flagship CCT and other direct transfers, mainly food programs), Circa 2010 ... 44
Page
Figures
1. Social Protection Index Score, circa 2002 and 2012 ... 6
2. Affiliation to health and pensions by type of employment and per capita income quintile in Latin America, circa 2002 and circa 2012 ... 10
3. Affiliation to health and pension schemes for working population in Latin America, by type of employment and income quintile, circa 2012 ... 11
4. Estimated legal coverage (only contributory mandatory coverage) for old age as a percentage of the working-age population, 2013 ... 11
5. Composition of public sector spending as percentage of GDP in Latin America, 1990-2013 (weighted average by population) ... 13
6. Social spending as percentage of GDP, 2010 or latest available ... 13
7. Affiliation to health and pensions, Total and bottom 40% of income distribution (average by social protection category, in %, circa 2012) ... 14
8. GDP per capita and Social Protection Index, circa 2012 ... 17
9. Average annual growth rate of GDP per capita and change in the Social Protection Index, 2002-2012 ... 17
10. Poverty rate change and average annual growth rate of GDP per capita (right-hand figure) and change in the Social Protection Index (left-hand figure), 2002-2012 ... 19
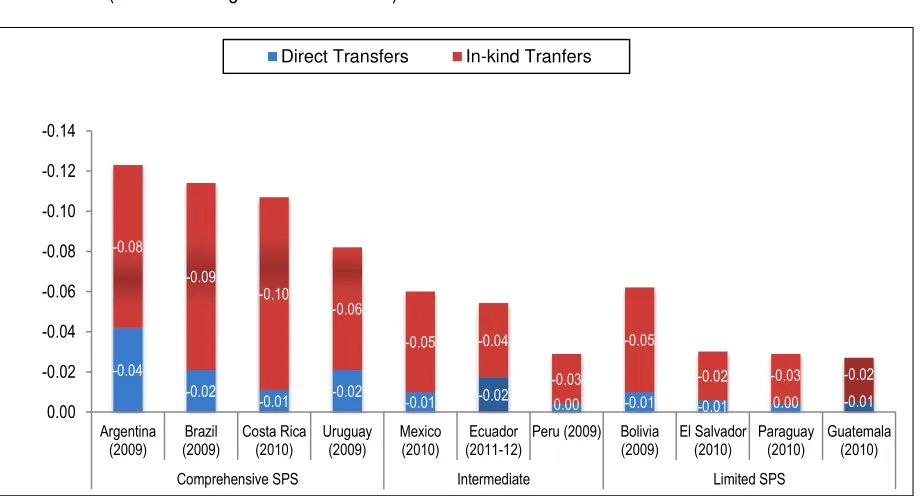
11. Redistributive effect of social spending, direct and in-kind transfers (Absolute change of Gini coefficient) ... 22
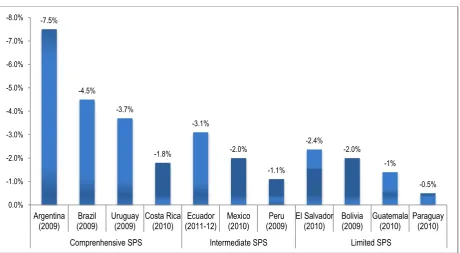
12. The effect of direct transfers on poverty (change in poverty rate at US$2.5 per day) ... 23
13. Redistributive impact of social spending (Direct and In-kind transfers), circa 2010 ... 24
14. Concentration Coefficients (CC) of different types of spending... 25
15. The redistributive impact of fiscal policy including taxes and transfers, circa 2012 ... 27
16. Per cent of informal employment in LAC, as percentage of total employment ... 29
17. Working population by employment status, circa 2012 ... 30
18. Per cent of households that lack access to some kind of contributory social protection, by quintile, circa 2013 ... 32
19. Contributory old-age pension coverage and average monthly pension for persons aged 65 and older, 2011 (regional simple average for 14 countries) ... 33
Tables 1. Average indicator by category, 2012 ... 8
2. Coverage of persons 65 years and over and average monthly amount (in US$) of non-contributory pensions, 2002 and most recent year ... 12
Acknowledgements
The authors acknowledge with gratitude the guidance and extensive comments provided by Isabel Ortiz, José Manuel Salazar, Christina Behrendt and Karuna Pal from the International Labour Office, and thank Maria José Abud for her research support in drafting this paper.
Authors
José Antonio Ocampo is Professor at Columbia University, Chair of the UN Committee for Development Policy and Goodwill Ambassador of the International Labour Organization for Social Protection. He was UN Under-Secretary-General for Economic and Social Affairs, Executive Secretary of the UN Economic Commission for Latin America and the Caribbean (ECLAC), and Minister of Finance, Minister of Agriculture and Rural Development and Director of the National Planning Department of Colombia.
Executive summary
Despite a global trend of rising inequality both in developed and developing countries, Latin America has seen an improvement in all its social indicators, including a reduction in income inequality in most countries in the region over the past decade. This improvement was matched in some periods by satisfactory economic performance, particularly during 2003–2007. Aside from favorable external conditions (high commodity prices and ample access to external financing), improvements during this “golden social decade” can be attributed to the construction of a stronger and innovative welfare state. New forms of social protection (both in social security and social assistance) have been emerging in the region, including the universal basic pensions of the Plurinational State of Bolivia, Brazil and Chile, the universal health system of Colombia, and the growing popularity of cash transfer programs, as well as universal transfers like child benefits in Argentina. Most interestingly, social security for the formal economy has not been undermined like in the United States and Europe; on the contrary, the region has experienced important reversals of pension privatizations, like in Argentina and the Plurinational State of Bolivia, and expansion of contributory social security, like in Ecuador and Uruguay. This is also matched by advances in other dimensions of social policy, such as the significant increase of wages and the rapid increase in access to education, despite quality gaps. Improvements in social protection, better income distribution combined with satisfactory economic growth resulted in turn in massive reduction of poverty.
Based on a multidimensional index that measures the “comprehensiveness” of social protection systems in the region, this paper assesses recent improvements and compares the achievements of 18 Latin American countries with respect to three dimensions of social protection. Between 2002 and 2012, 17 out of the18 countries, which formed part of this study, improved their score in their social protection index, meaning that they increased coverage in both health and pensions, reduced coverage gaps between wage and non-wage earners, increased social spending and/or had higher efficiency of social assistance. Coverage among non-wage earners has increased significantly. In fact, improvements in health have been higher among non-wage earners, reducing and even eliminating past segmentations as in the case of Colombia. However, important inequalities remain, both by type of employment and income. Non-salaried workers are less likely to be affiliated to health and pension schemes, furthermore pension coverage is still highly deficient, both in terms of low affiliation among the occupied population and low coverage of pensions during old-age.
These expansions of SPS have in turn fostered economic growth. There is a positive link between an expansion of social protection systems and economic development. As recent studies have shown, there is no trade-off between redistribution and growth. In fact, Latin American countries with a higher social protection index, or even higher social spending, have had higher growth rates. Furthermore, there is high variation with respect to the correlation between welfare states and Gross Domestic Product per capita, which refutes the myth that achieving a comprehensive welfare state should come after achieving relatively high income levels.
Acronyms
CCT Conditional Cash Transfer Programs
CEQ Commitment to Equity
ECLAC Economic Commission for Latin America and the Caribbean
EU European Union
GDP Gross Domestic Product
ILO International Labour Organization/Office
IMF International Monetary Fund
LAC Latin America
OECD Organisation for Economic Co-operation and Development
SPI Social Protection Index
SPS Social Protection Systems
1.
Introduction
The social unrest 1 and rising income inequality experienced in many parts of the world in recent decades highlight the domestic social challenges countries face in a highly integrated global economy. Amidst a global trend of rising inequality both in developed and developing countries, the role of fiscal policy and social protection as primary tools to fight inequality is being underscored both by policymakers and academics across the globe, which also coincides with growing public support for income redistribution. Recent studies have focused on how to improve the efficiency of fiscal policy both through progressive taxation and higher social spending, especially in a context of important fiscal constraints. Given that most of the redistributive impact of fiscal policy is achieved through the expenditure side of the budget (direct income transfers), the call for building universal and more comprehensive Social Protection Systems (SPS) is making its way back in the agenda as a “primary development priority” 2 and as the main tool to fight poverty and reduce income inequality.
Contrary to global trends, most Latin American (LAC) countries experienced an improvement in income inequality over the past decade. This trend, together with the generalized increase in social spending that took place since the 1990s, has resulted in significant improvements in their social indicators. This was enhanced by rapid economic growth in 2003-2007, and satisfactory economic performance between 2008-2013, which generated significant improvements in labour markets, including a strong reduction in unemployment and a more moderate one in labour market informality. The improvements in income distribution combined with satisfactory economic growth resulted, in turn, in massive poverty reduction, and an expansion of the middle class. According to ECLAC data, poverty in the region fell from 44 to 28 per cent between 2002 and 2013. However, some of these gains are now at risk, particularly in South America, due to the end of the “super-cycle” of high commodity prices and the significant slowdown of economic growth in 2014-15.
Aside from favorable external conditions (high commodity prices and ample access to external financing), improvements during this “golden social decade” 3 can be attributed to the construction of stronger and innovative welfare states. New forms of social protection have been emerging in the region, including universal basic pensions with non-contributory components in Argentina, the Plurinational State of Bolivia, Brazil and Chile; the universal health system in Colombia; the expansion of contributory social security in Ecuador and Uruguay; the monotax schemes in Uruguay for microenterprises and self-employed workers; and the growing popularity of conditional cash transfer programs, which developed under the initial leadership of Brazil and Mexico as small targeted programs and have been expanding significantly, including in the form of universal transfers, like child benefits in Argentina.
1 See Ortiz et al. (2013) for a recount of the social protests between 2006 and 2013.
2 The ILO and the World Bank recently launched their joint initiative towards universal social
protection, encouraging governments to expand their social protection systems as a primary development priority (ILO/WB, 2015).
3Some analysts have talked of a “golden decade” also in economic terms, but rapid economic growth
The expansion of SPS in Latin America, heavily contrasts with recent experiences in the rest of the world, and particularly in advanced economies, where reforms since the mid-1990s have lessened the generosity of social benefits (particularly unemployment and social assistance benefits) and reduced the progressivity of income tax systems, making fiscal policy less redistributive (Bastagli et al., 2012). In Latin America some countries are expanding their SPS, not only improving their targeted social assistance programs, but also moving towards universal social protection policies with innovative mechanisms to reach the informal and poor population. In contrast, “retrenchment” trends in several high- and middle-income countries have led to reforms of their SPS in which the more costly universal programs have been reduced while increasing the more targeted, and means-tested programs with more limited benefits.
2.
A multidimensional index to measure
Social Protection Systems in Latin America
Social protection systems in Latin America vary significantly from one country to another. While some countries have more comprehensive and stronger systems, both in terms of population coverage and policy areas covered, others remain relatively limited, providing only social insurance through formal employment, 1 or have dual systems, one with higher benefits but lower coverage based on contributory schemes and another with lower benefits through targeted programs for the poor.
Despite this high heterogeneity regarding the actual implementation of SPS, 2 the region is moving towards more comprehensive systems based on three basic principles: universal coverage, solidarity and higher social spending. The first two have been considered as essential characteristics of a “welfare state” based on human rights and social citizenship, indispensable for the construction of more inclusive and equitable societies (ECLAC, 2000).
The principle of universality seeks that all citizens have access to at least a basic level of protection, in terms of both the scope and quality that are deemed necessary for full participation in society. This principle implies that the entitlements associated with social policy are more than services or commodities; they are rights and therefore, should be guaranteed to all citizens. Social security as a human right was first expressed in the Universal Declaration of Human Rights and then further specified by the International Covenant on Economic, Social and Cultural Rights (ICESCR), which has been ratified by 164 State Parties. States have the obligation to ensure the satisfaction of, at the very least, minimum essential levels of all economic, social and cultural rights such as the right to social security and the right to health for all members of society. It is based on this principle that the ILO has more recently conceptualized the universal right to social protection in the form of Social Protection Floors that provide a basic level of protection for all. 3
Solidarity entails differentiated participation in the financing of benefits in accordance with the contributory capacity of the individuals concerned; ensuring that universal access to social protection can be achieved. In this sense, access of the poor to social protection entitlements should be made possible through a progressive structure of public spending and taxation as well as through equitable risk-sharing mechanisms in the case of compulsory contributions, which could also involve cross-subsidies between different income strata and risk groups. This principle seeks to break down the mechanisms through which poverty and inequality are reproduced from one generation to the next, giving differential treatment to the most vulnerable population.
1 For a history of SPS in LAC, see Cecchini and Martínez (2012) and Kaplan and Levy (2014). 2 There is no clear consensus on a unique definition of SPS. There is for example, some disagreement
on the dimensions and areas that should be included within the SPS. Market regulation and active labour market policies, for example, are considered by some as part of the SPS and not so by others. See Ferreira and Robalino (2011) and Cichon and Scholz (2009).
3 See Social Protection and Human Rights http://socialprotection-humanrights.org/ [22/02/2016] and
A Social Protection Index (SPI) was developed to measure the achievements of 18 Latin American countries in these three dimensions using nine indicators 4 as shown in Diagram 1.
Diagram 1. A Social Protection Index for LAC
Source: Author’s development.
The first dimension, Universality, measures the coverage for health and pension among the total occupied population, and the percentage of the elderly population that receives a pension. Because of the historic segmentation of SPS in Latin America due to its link with formal employment, 5 this dimension includes two indicators that measure the coverage gap between salaried workers and non-salaried workers 6 for both health and pensions (measured as a percentage of the coverage level of salaried workers). The data comes from ECLAC’s 2013 Social Panorama of Latin America (ECLAC, 2014a), which had a special focus on access to health and pensions in the region.
Although universal coverage should of course apply to other areas of the SPS 7, only data on affiliation to health and pension schemes among the working-age population (active labour force) differentiated by wage and non-wage earners, and percentage of old-age population receiving a pension 8 is available for all countries at two points in time. Protection for persons with disabilities, or work-related risks, cannot be measured with the available data. Others like unemployment benefits are so deficient in the region that only few countries
4 See Annex 1 for detailed information on the indicators, including the construction of the normalized
index and the source of the data used.
5 See Barrientos (2011) and Kaplan and Levy (2014).
6 Non-salaried workers include employers, own-account workers, members of producers’ cooperatives,
and unpaid family workers. The coverage gap measures the differences in coverage because of segmentation in the SPS by type of employment.
7 According to the ILO’s Social Security (Minimum Standards) Convention, 1952 (No. 102) there are
nine contingencies covered: medical care, sickness benefits, unemployment benefits, old-age benefits, employment injury benefits, family/child benefits, maternity benefits, invalidity/disability benefits
and survivors’ benefits.
8 Most of the countries have only information on contributory pensions as non-contributory pensions
are a recent development and started to be implemented after 2008.
Universality
Health coverage among wage earners
Affilitation to pension schemes among wage earners
Old-age population receiving a contributory pension Coverage gap on access to
health between wage and non-wage earners Coverage gap on affilition to pension schemes between wage
and non-wage earners
Solidarity
Per cent of poor people with access to some kind
of social protection (insurance or assistance)
Coverage by social assistance in poorest
quintile
Social
Spending
Social spending in social protection (insurance
and assistance) as per cent of GDP
Social spending in health as per cent
have programs, generally with very low coverage as it is only through social insurance. 9 Also, although non-contributory pensions are rising in several countries and are becoming an important instrument to achieve universal social protection for the elderly, these are a recent development and in most cases it is not possible to have differentiated information on non-contributory pensions through household surveys for two points in time. Only six countries have information for 2002 and 2012 on non-contributory pensions; this will be analysed in a later section.
The second dimension, Solidarity is approximated by two indicators, one that measures the access of the poorest households to some form of social protection and one that measures targeting efficiency of social assistance 10 among the poor. The first one measures the percentage of multidimensional poor households which have at least one member with access to health insurance, contribute to any form of social insurance or receive a pension or retirement benefit. This indicator is one of the dimensions of a multidimensional poverty index for Latin America proposed by the Oxford Poverty & Human Development Initiative (OPHI) and included in the latest ECLAC’s Social Panorama of Latin America 2014. 11 Coverage within the poorest quintile of the population by all social assistance programs measures the targeting efficiency of social assistance based on World Bank data.
Finally, the last dimension measures public spending, both in health and social protection (insurance and social assistance), as a percentage of GDP. Cross-country evidence suggests that a higher budget for social spending is positively associated with higher effects on poverty and inequality reduction. Furthermore, the size of the budget also reflects the social contract and type of institutions in a given country and the universality of the system. “The hypothesis here is that the size of the budget available for redistribution is not fixed and that the institutional structures of welfare states are likely to affect the definitions of identity and interest among citizens. Thus, an institutional welfare state model based on a universalistic strategy with higher budget intended to maintain normal or accustomed standards of living is likely to result in greater redistribution than a marginal one based on targeting.” (Korpi and Palme, 1998, p. 663). Although the index may have some limitations and missing variables, as we will see in the next sections, it is a very useful measure for the purpose of this work and an interesting proxy to measure changes in SPS.
Normalized indices for each of the nine indicators were constructed using the maximum (goalpost) and minimum achievement of the pool of countries. Coverage at 100 per cent was used as the max (goalpost) for the coverage indicators, and 0 per cent for the gap indicators. For the indices of the two years to be comparable, common minimum and maximum values (goalposts) were defined. The final index is a summary measure, obtained through the arithmetic mean of the normalized indices for each of the nine indicators, and goes from 0 to 1, where 1 represents the most comprehensive system with relatively universal coverage, less inequality in the affiliation to health and pension schemes within different types of employment, high social inclusion, well targeted social assistance and high social spending.
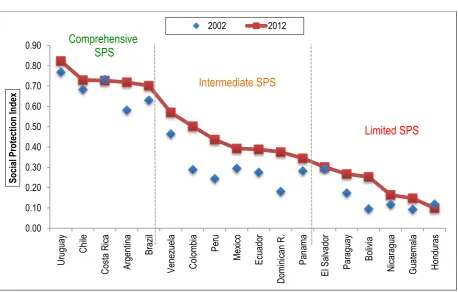
The final score of the SPI for both 2002 and 2012 can be seen in Figure 1. Based on the SPI score of 2012, three categories were defined. Honduras, Guatemala, Nicaragua, the
9 According to the ILO data measuring the effective coverage for unemployment, Uruguay and Chile
have the highest percentage of unemployed receiving unemployment benefits among Latin America and the Caribbean, reaching 27.9 per cent (in 2012) and 29.9 per cent (in 2013) respectively (ILO, 2014a).
10 Social assistance consist of all benefits targeted to vulnerable groups of the population, especially
households living in poverty, aimed at poverty reduction. Most social assistance schemes are means-tested.
Plurinational State of Bolivia, Paraguay and El Salvador are identified as having relatively limited systems, with low Social Protection Index scores and thus low achievements in universality, solidarity and social spending. The group of countries with intermediate systems includes Panama, Dominican Republic, Ecuador, Mexico, Peru, Colombia and Bolivarian Republic of Venezuela. Finally, Uruguay, Chile, Costa Rica, Argentina and Brazil with the highest SPI scores have been identified as having comprehensive systems. This classification is in line with different rankings on the topic all concluding that countries in the Southern Cone, with higher development, have built more comprehensive welfare states. Costa Rica in itself has always excelled and is pointed as having a fairly universal welfare state despite its much lower GDP per capita with respect to some of the other countries in the region.
[image:18.595.64.523.286.578.2]Between 2002 and 2012, 15 out of the 18 countries, improved their SPI score, meaning that they had significant improvements in at least one of the dimensions of social protection moving towards a more universal and comprehensive system. The rest did not experience any significant change in the index.
Figure 1. Social Protection Index Score, circa 2002 and 2012
Source: Authors using data from ECLAC (2014a and 2014b), Santos et al. (2015) and WB Data. The figures for 2012 vary from 2010 to 2013. Note: SP Index is the arithmetic mean of the normalized achievements of each country in all 9 indicators.
Countries with an intermediate SPS improved the most. Colombia showed the highest improvement in the SPI score, followed by Peru, Dominican Republic, and a country with a limited SPS, the Plurinational State of Bolivia. In the case of Colombia, the improvement was a result of the efforts to achieve universal health coverage using a combination of contributory and non-contributory (subsidized) schemes to reach the poor and independent workers. 12 Through this all citizens, irrespective of their ability to pay, are entitled to a comprehensive health benefit package. Colombia significantly increased health coverage for both salaried and non-salaried workers, reducing the affiliation gap between both types of
12 See the case study of Colombia on universal health coverage from the World Bank (Montenegro
workers. While 53 per cent of salaried workers had access to health protection in 2002, by 2012 coverage was 91 per cent. The coverage increased even more among non-salaried workers, reducing the coverage gap between salaried and non-salaried workers from 75 per cent in 2002 to 5 per cent in 2012. Peru, the country with the second biggest improvement in the index made also significant progress in the access to health protection and pensions. Both indicators almost doubled between 2002 and 2012. Also, coverage of the poorest quintile by social assistance provisions increased from less than 10 per cent to 70 per cent between the two years analysed. In turn, the Plurinational State of Bolivia significantly improved access to contributory pension provisions among the elderly, from 13 per cent to 21 per cent; although this coverage is still low compared to other countries, it has achieved almost universal coverage among the elderly (65 and older) through a non-contributory scheme.
Among the countries with comprehensive systems, Argentina is the one that improved the most on its SPI score. This was mainly driven by the expansion of pension provisions, by providing a mandatory minimum basic pension for all, independently of whether the beneficiary meets the minimum contributory period requirement. 13 In turn, countries with limited systems did not improve significantly their SPI score.
Table 1 shows, the average achievement on the nine indicators included in the index by SPS category for 2012. As expected, on average, countries with relatively more comprehensive SPS have better achievements in eight of the nine indicators. While on average 82 per cent of the old-age population of countries with comprehensive SPS have access to a pension and thus income security in old age, only 28 per cent and 15 per cent of the old-age population in countries with intermediate and limited SPS respectively have income security. The difference in the achievements of countries with comprehensive systems and countries with limited systems is especially high among coverage of old-age pensions and on the percentage of poor households with some kind of protection. The percentage of people 65 and older that receive a pension in countries with comprehensive systems is five times the level in countries with limited SPS. Similarly, the percentage of poor households that have some kind of social protection in countries with comprehensive systems is three times the number in limited systems.
The indicator measuring coverage by social assistance provisions in the poorest quintile is the only indicator where there is no clear difference between categories; countries with intermediate SPS seem to have better targeting efficiency. Given the importance of some social assistance programs in the region, mainly Conditional Cash Transfer Programs (CCT), it is not strange that all countries have similar levels of coverage. Furthermore since low-income countries rely relatively more on means-tested targeting programs, because of low spending and deficient health and pensions coverage, it is possible that they have higher coverage by social assistance provisions than comprehensive SPS, which can rely on a combination of programs (Ferreira and Robalino, 2011). Also, in recent years countries like Mexico, Colombia and Peru have continued to improve their targeting mechanisms to reach the poorest households and expand their CCT programs.
13 See Lusting and Pessino (2013). Moratoria Previsional (the pension moratorium), introduced in
Table 1. Average indicator by category, 2012 (in percentage)
Group of Social Protection System
Contributor y pension coverage (65 and older)
Wage earners affiliation to pension schemes
Wage earners affiliation to health system
Access to pensions: Gap between salaried and non-salaried workers
Access to health: Gap between salaried and non-salaried workers
Poor Households with access to some kind of social protection provision
Coverage in poorest quintile
– Social
Assistance Social spending in social protection as % of GDP
Social spending in health as % of GDP
Comprehensive 81.76 77.12 89.98 –52 –12 92.8 65.0 9.92 5.08
Intermediate 28.40 58.28 75.07 –70 –42 71.3 68.6 3.67 2.07
Limited 15.26 37.57 41.90 –96 –79 44.9 63.3 3.32 2.72
Source: Authors’ estimates using data from ECLAC (2014a and 2014b), Santos et al. (2015) and WB Data.
Note: The last available year of data, from 2010-2013, has been used.
3.
The present state of Social Protection Systems
in Latin America: higher coverage but important
inequalities
This section asses the present state, past trends and some challenges of SPS in the region looking at the access to health and pension provisions between 2002 and 2012. Although a description of the present state of SPS in Latin America should go beyond the dimensions of health and pension provisions, these two represent the cornerstones of social protection. Health and pensions represent the most important expenditure items in total public spending on social protection. This is not surprising, as health protection and income security for the elderly have been widely recognised as the most important risks, and always constitute the minimum dimensions of protection in the diverse literature on social protection. They are also fundamental as they affect other dimensions of present and future well-being.
There have been significant improvements in the access to health and pension provisions 1 across the region, with recent innovations in flexible contributory mechanisms, basic pensions like in Argentina, non-contributory pensions like in the Plurinational State of Bolivia and Chile, universal health coverage with an important solidarity mechanism in Colombia, among others. Nevertheless, the access to both health and pension provisions is still low compared to developed countries. Furthermore, there are still important differences between the coverage of salaried (wage earners) and non-salaried workers (non-wage earners), and between income quintiles, indicating that access to social protection is unequal and still depends on the type of employment. Finally, despite important increases in social spending, Latin America still lags behind developed countries.
The most salient aspects in the evolution of health and pension coverage in Latin America over the past decade have been the following:
(1) Between 2002 and 2012, access to pensions and health provisions increased throughout the region, regardless of the type of employment or income quintile. Improvements have been higher on health coverage and especially among non-wage earners (see Figure 2).
The improvements have been greater for non-salaried workers and for the lower quintiles, which arise from the recent efforts throughout the region to extend social protection to the poorest population and those not working in the formal economy. In any case, the improvement has been higher in access to health systems than in affiliation to pension systems. The percentage of non-salaried workers that has access to health systems almost doubled during the past decade, while access to pension systems increased by only 3 percentage points. Independently of the type of employment or income quintile, it is generally more likely for individuals to have access to a health insurance than to be affiliated to a pension scheme.
1 Access to health and pension provisions is measured as the working age population (15 years and
Figure 2. Affiliation to health and pensions by type of employment and per capita income quintile among the total occupied population in Latin America, circa 2002 and circa 2012
Wage earners Non-wage earners
% affiliated % affiliated
Source: ECLAC (2014a). The last available year for some countries was updated with 2012 or 2013 figures based on (ECLAC, 2015) Note: Q1-Q5 refers to per capita income quintiles.
(2) Despite recent improvements, there are still important differences with respect to access to protection by type of employment, or income quintile.
As can be seen in Figure 3, despite the improvements since 2002, there are still two important segmentations in the access to social protection: one by type of employment and one by income group. Inequality in access is higher for pension provisions than for health protection.
While 66 per cent and 55 per cent of salaried workers are affiliated to health protection and a pension fund respectively, for non-salaried workers the coverage is lower (41 per cent and 12 per cent respectively). In 2012 access to pension provisions for non-salaried workers in the lower quintile was less than 5 per cent, compared to 24 per cent of salaried workers in the same quintile. Even in the richest quintiles, non-salaried workers have lower access to both pension provisions and health protection.
Poor households and non-salaried workers are less likely to be covered by both types of protection. This is true in all countries, even in countries with comprehensive systems, although the coverage gaps in those countries are less marked.
46 54 17 28 28 37 39 47 50 58 65 71 55 66 24 44 38 53 49 61 60 69 73 80 P en si on s H ea lth P en si on s H ea lth P en si on s H ea lth P en si on s H ea lth P en si on s H ea lth P en si on s H ea lth
Total Q1 Q2 Q3 Q4 Q5
2002 2012 9 28 2 24 4 23 6 26 10 29 21 39 12 41 3 42 6 39 10 40 14 41 26 48 P en si on s H ea lth P en si on s H ea lth P en si on s H ea lth P en si on s H ea lth P en si on s H ea lth P en si on s H ea lth
Total Q1 Q2 Q3 Q4 Q5
Figure 3. Affiliation to health and pension schemes for the working population in Latin America, by type of employment and income quintile, circa 2012
Source: ECLAC (2014a).
(3) Given on average the low contributory coverage, non-contributory pensions are increasing in the region as a solution to reach universal protection for the elderly.
In Latin America the average coverage for mandatory pensions is still low compared to more developed welfare states, with important differences by country, as depicted in Figure 4 which shows only mandatory contributory pension coverage.
Figure 4. Estimated legal coverage (only contributory mandatory coverage) for old age as a percentage of the working-age population, 2013
Source: ILO (2014a).
Note: The extent of legal coverage for old age is defined as the proportion of the working-age population (or alternatively the labour force) covered by law with schemes providing periodic cash benefits once statutory pensionable age or other eligible age is reached. The population covered is estimated by using the available demographic, employment and other statistics to quantify the size of the groups covered as specified in the national legislation. Actual, effective coverage is often significantly lower than legal coverage where laws are not implemented fully or enforced. The estimation includes contributory mandatory coverage. The figure for Latin America is calculated as a simple average.
24.4 44 37.9 53.2 55.4 66.4 3.4 41.7 6.3 38.7 12.4 41.2 0 10 20 30 40 50 60 70
Pensions Health Pensions Health Pensions Health
Poorest 20% Second poorest 20% Total
C o ve ra g e (in % )
Salaried workers Non-salaried (independent) workers
24
.7 30.0
37 .8 38 .2 40 .3 42 .8 51 .0 51
.1 53.7 53.8 55.1 55.9 56.3 56.7 60
.0
61
.1
62
.0 67.0 69
.0 69 .1 70 .7 71 .3 71 .5 72
.4 76.6
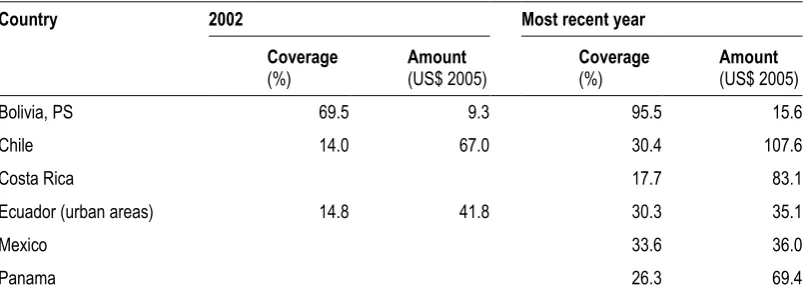
[image:23.595.76.533.458.676.2]Given the low coverage of mandatory contributory pensions among the elderly especially in countries with limited systems, new non-contributory pension schemes are being developed in some countries of the region. The six countries where household survey data allows differentiating non-contributory pensions are shown in table 2.
Table 2. Coverage of persons 65 years and over and average monthly amount (in US$) of non-contributory pensions, 2002 and most recent year
Country 2002 Most recent year
Coverage
(%)
Amount
(US$ 2005)
Coverage
(%)
Amount
(US$ 2005)
Bolivia, PS 69.5 9.3 95.5 15.6
Chile 14.0 67.0 30.4 107.6
Costa Rica 17.7 83.1
Ecuador (urban areas) 14.8 41.8 30.3 35.1
Mexico 33.6 36.0
Panama 26.3 69.4
Source: ECLAC (2015) Box 1.2 pg 41, based on household surveys.
Note: Data for the most recent year pertains to 2011 for Bolivia, PS; to 2012 for Mexico and to 2013 for Chile, Costa Rica, Ecuador and Panama.
As can be seen, the Plurinational State of Bolivia provides the lowest average non-contributory monthly pension amount of US$15.6, however it enjoys the highest coverage with 95 per cent of the elderly over the age of 65 covered in 2011. In turn, Chile is the country with the best solidarity-based pension offering the highest value amount, followed by Costa Rica. Compared with contributory coverage, both the Plurinational State of Bolivia and Mexico have higher coverage through non-contributory rather than through contributory pension provisions (using data from the previous section). In the Plurinational State of Bolivia, it is 95 per cent versus 21 per cent in 2011, respectively, whereas in Mexico it is 33 per cent vs. 26 percent. 2 Chile, Costa Rica, Ecuador and Panama, have higher coverage through contributory pensions.
(4) Social spending has increased significantly, but it is still low compared to other developed countries.
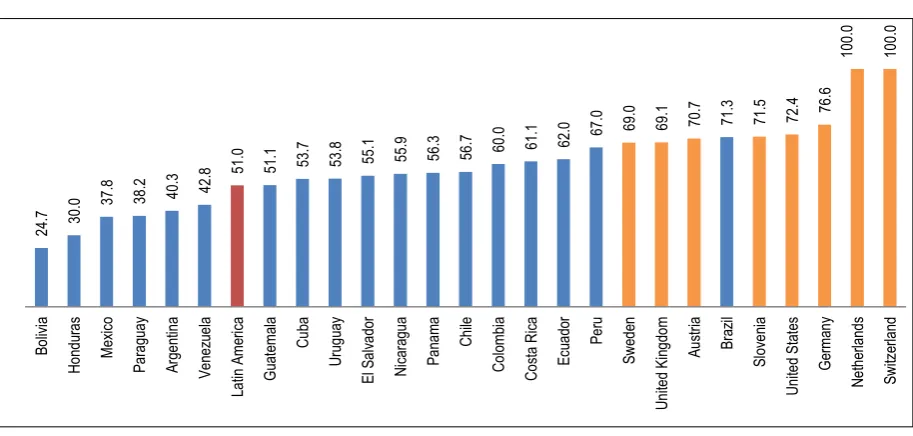
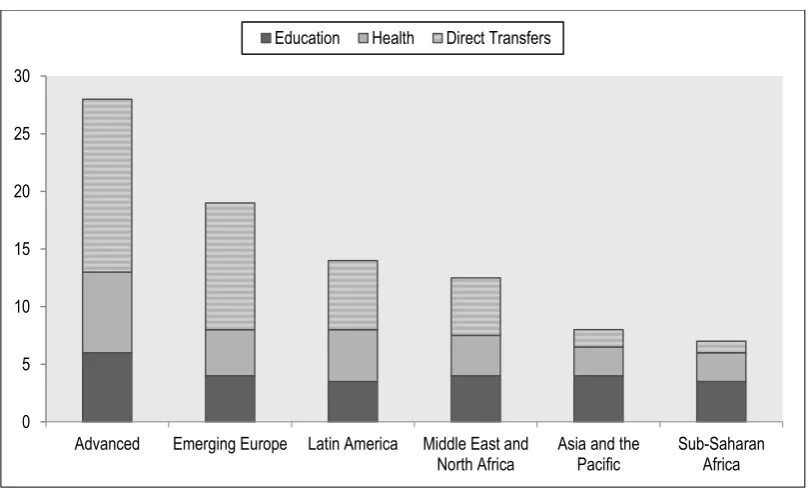
The efforts to expand social protection have come with an important increase in social spending. Social spending as a percentage of GDP has increased significantly since 1990, particularly in health and social protection (insurance and social assistance) (see Figure 5). However, and although Latin America ranks second in the emerging and developing world in terms of social spending as a proportion of GDP, it allocates much less resources relative to developed countries, both for direct transfers (which include social insurance and social assistance, non-contributory pensions and other benefits like child benefits) and also for health and education (see Figure 6).
Figure 5. Composition of public sector spending as percentage of GDP in Latin America, 1990-2013 (weighted average by population)
Source: ECLAC (2014a).
Figure 6. Social spending as percentage of GDP, 2010 or latest available
Source: Bastagli et al. (2012) based on IMF data.
When looking at the access to health and pension provisions (see Figure 7) in the three categories of SPS defined in the precious section, three results emerge:
(i) On average, countries with comprehensive systems have higher coverage than countries with intermediate systems, in both access to health and affiliation to pensions (among occupied population) and throughout the whole income distribution. In turn, both have higher coverage than countries with limited systems. This also applies to coverage for each type of employment status and income quintile: higher coverage for
3.7 4.0 4.2 5.0 4.9
3.5 2.9 3.0
3.8 4.0
5.5 6.2 6.6
7.9 8.0
0.6 0.7
0.8
1.0 0.8
1990-1991 1996-1997 2002-2003 2008-2009 2012-2013
Weighted Average
Education Health Social Protection Housing
0 5 10 15 20 25 30
Advanced Emerging Europe Latin America Middle East and North Africa
Asia and the Pacific
[image:25.595.130.536.382.626.2]countries with comprehensive systems, less for intermediate and it is lowest in countries with limited systems.
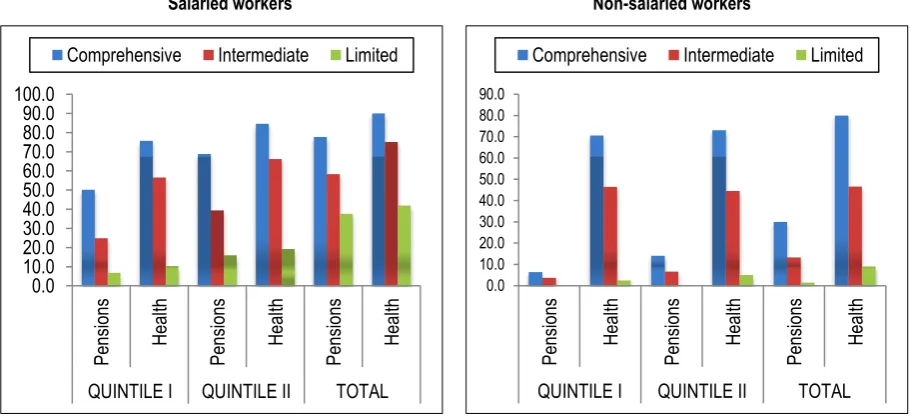
(ii) The differences in coverage between the three categories of SPS are wider when looking at coverage of non-salaried workers. Countries with limited SPS still exclude the majority of the non-salaried working population from social protection. In these countries, social security is only available for a small proportion of workers with formal employment, in contrast to countries with intermediate and comprehensive systems, which have made advances in this regard. For example, while 80 per cent and 46 per cent of non-salaried workers in countries with comprehensive and intermediate systems respectively have access to health protection, only 10 per cent in countries with limited systems have access. This variance is much higher than the variance for salaried workers across types of SPS.
[image:26.595.62.518.427.635.2](iii) Between 2002 and 2012, intermediate systems have been most successful in improving coverage for pensions and health and also within the groups of salaried and non-salaried workers. This explains why these countries were the ones that improved their social protection index score the most as seen in chapter 2. They have made important efforts to provide universal coverage and have reduced inequalities in the access to protection by reaching the lowest quintiles and informal workers. For example, between 2002 and 2012 the coverage in health protection for salaried workers increased in countries with intermediate systems on average by 43 per cent, while the coverage for non-salaried workers increased by, on average, 207 per cent passing from 15 per cent in 2002 to 46 per cent in 2012. Despite this increase, the health coverage is still lower than that of countries with comprehensive systems.
Figure 7. Affiliation to health and pensions, total and bottom 40 per cent of income distribution (average by social protection category, in %, circa 2012)
Salaried workers Non-salaried workers
Source: author with data from ECLAC (2014a).
Note: Countries with comprehensive systems include Argentina, Chile, Costa Rica and Uruguay, those with intermediate systems includes Colombia, Ecuador, Mexico, Panama, Peru and Dominican Republic, and with limited systems includes Bolivia, PS, El Salvador, Guatemala, Honduras, Nicaragua and Paraguay.
Although there are important cross-country differences, even among countries of the same SPI category, two traits of SPS remain constant among all countries. Firstly, health protection coverage is always higher than coverage for pensions regardless of the type of employment. Secondly, access to both pension provisions and health protection is higher among salaried workers than non-salaried workers. Although the gap is very small regarding 0.0 10.0 20.0 30.0 40.0 50.0 60.0 70.0 80.0 90.0 100.0 P en si on s H ea lth P en si on s H ea lth P en si on s H ea lth
QUINTILE I QUINTILE II TOTAL
Comprehensive Intermediate Limited
0.0 10.0 20.0 30.0 40.0 50.0 60.0 70.0 80.0 90.0 P en si on s H ea lth P en si on s H ea lth P en si on s H ea lth
QUINTILE I QUINTILE II TOTAL
access to health protection for some countries, mainly the countries with comprehensive systems, the gap regarding affiliation to pension provisions is still high even among these countries that have implemented reforms to facilitate flexible payments or voluntary contributions.
Latin America has already made advances in the expansion of social protection, introducing innovations to eliminate the segmentation or “truncation” in the access to social protection by type of employment. For example, by the end of the twentieth century, when it became clear that the problem of limited coverage (only covering formal employment through contributory schemes) was not going to resolve itself as countries developed, 3 a wave of innovative mechanisms to provide some form of basic protection for all, especially for self-employed workers, spread throughout the region. Also, after the crises of the end of the century, innovations in poverty reduction and risk-management mechanisms gave rise to the “social assistance revolution”. A new wave of innovations is needed now, mainly to expand social insurance, especially with respect to pensions and child benefits, with flexible mechanisms for non-wage workers, to break the link between social insurance and wage formal employment.
Some examples already exist, with subsidized contributions for pensions or progressive subsidies to encourage contribution. Also, there are some innovative solutions to facilitate access to social protection for self-employed workers. For example, in 2001, Uruguay implemented a monotax scheme to improve coverage of self-employed workers. It unified different social security contributions and taxes into a single payment through a simplified process, allowing people covered by the monotax to have the same social security benefits as salaried workers, based on the principle of solidarity (ILO, 2014b). Argentina has a similar experience with subsidization of social security contributions for self-employed workers and micro-enterprises and in Brazil, SIMPLES (a simplified taxation scheme designed for micro- and small business) has significantly contributed to reducing the labour costs of micro-enterprises.
The development of more innovative solutions should be the next step in the progress of Social Protection Systems in Latin America. While the social assistance revolution was very effective as a poverty reduction strategy, the next step has to go beyond narrow targeting mechanisms towards more universal SPS, including an expansion of social insurance, as countries develop. A universal social protection system that protects people from all types of risks is necessary not only to continue with massive poverty reduction, but also to increase the resilience of the vulnerable population, 4 which despite being lifted out of poverty during the last decade, if unprotected has a high probability of falling back into poverty (Ferreira et al., 2013). Without universal social protection mechanisms, previous gains could be wiped out. This implies, of course, that more resources are needed for social spending.
3 As a consequence of economic growth, it was expected that the informal economy would gradually
disappear as workers shifted from more traditional (mainly informal) to more modern (formal) sectors. See Kaplan and Levy (2014).
4 See Ferreira et al (2013) for a study on social mobility and middle classes in the region and a
4.
Three myths about social protection,
redistribution and economic development
Social Protection Systems consist of the integrated set of policies designed to ensure income security and support to all people across the life cycle, paying particular attention to the poor and the vulnerable. The basic protection encompassing Social Protection Floors includes (i) access to essential health care, including maternity care; (ii) basic income security for children, providing access to nutrition, education, care and any other necessary goods and services; (iii) basic income security for persons in active age who are unable to earn sufficient income, in particular in cases of sickness, unemployment, maternity and disability; and (iv) basic income security for older persons (ILO, 2014a and the Social Protection Floors Recommendation, 2012 (No. 202)). In this regard, SPS are the main tool by which States can guarantee the fundamental right to social security set out in the Universal Declaration of Human Rights, reduce poverty and inequality and support inclusive growth.
Although national SPS around the world have achieved important reductions in poverty and redistribution, there is always a doubt on whether these results are obtained through incurring high opportunity costs in terms of economic growth, which would otherwise have been welfare improvement for all in the longer term. This implies, according to several authors, that there is a trade-off between growth and redistribution. However, this trade-off is largely a myth. In broader terms, and following Cichon and Scholz (2009), we can say that there are three major myths regarding the relationship between social protection and economic performance:
(i) At each stage of development societies can only afford a certain level of social expenditure (the affordability myth);
(ii) There is a trade-off between social expenditure (redistribution) and economic growth (Okun’s famous trade-off myth);
(iii) Economic growth will automatically reduce poverty (trickle-down myth).
Using the SPI for Latin America developed in the first part of this paper, it is possible to refute these myths. There is, first of all, high heterogeneity in SPS in the region even when per capita GDP differences are taken into account. Second, there is no clear evidence that countries that expanded their SPS grew less. And third, there is stronger correlation between the improvements in the SPI and poverty reduction than between growth and poverty reduction.
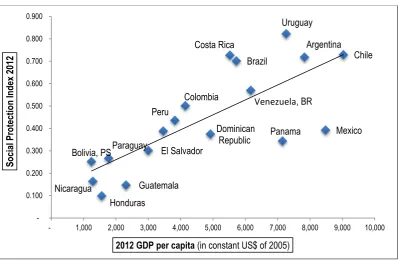
As seen in Figure 8, although there is a positive association between higher GDP per capita and a higher Social Protection Index (SPI) score, 1 there is high variation in the SPI by level of GDP per capita. The best comparisons are Costa Rica vs. Panama, and Uruguay vs. Mexico. Costa Rica, with a little more than the region’s average GDP per capita, has the second highest SPI score. Since 1941, Costa Rica has promoted universal coverage both for health and pensions as mandatory pillars of the welfare state. With lower GDP per capita Costa Rica has always exceled at social inclusion indicators. On the other hand, Panama has a higher GDP per capita but has relatively low social spending and ranks low in the SPI. The same is true when we compare Uruguay and Mexico. Mexico, despite having the second highest GDP per capita in the region, has an intermediate SPS even more limited that many countries with lower GDP per capita.
Figure 8. GDP per capita and Social Protection Index, circa 2012
Source: GDP data from ECLAC.
[image:29.595.133.535.507.741.2]Figure 9 shows the change in the SPI between 2002 and 2012 and the average annual growth rate of GDP per capita. As can be seen, there is no negative association between improvement in SPS and economic growth. Rather, the correlation between these two variables is close to nil (–0.007). And, in fact, the three countries that increased their SP Index the most, Peru, Dominican Republic and Colombia, grew at faster rates than the Latin America average over the period analyzed. There is, therefore, no evidence of a trade-off between expanding SPS and growth.
Figure 9. Average annual growth rate of GDP per capita and change in the Social Protection Index, 2002-2012
Source: GDP data from ECLAC. Lines refer to averages for each indicator.
Honduras Guatemala Nicaragua
Bolivia, PSParaguay El Salvador
Panama Mexico
Peru
Dominican Republic
Colombia Venezuela, BR
Chile Costa Rica Brazil Argentina Uruguay 0.100 0.200 0.300 0.400 0.500 0.600 0.700 0.800 0.900
- 1,000 2,000 3,000 4,000 5,000 6,000 7,000 8,000 9,000 10,000
S o cia l P ro te ct io n In d ex 2 01 2
2012 GDP per capita (in constant US$ of 2005)
Guatemala Nicaragua Paraguay Panama Ecuador Peru Dominican Repblic Colombia Chile Costa Rica Argentina Uruguay 0.00% 1.00% 2.00% 3.00% 4.00% 5.00% 6.00% 7.00%
-0.050 - 0.050 0.100 0.150 0.200 0.250
A ve ra g e an n u al G D P p er c ap it a g ro w th (2 00 2-20 12 )
This result remains if looking only at social spending, which is in line with recent studies that find no evidence of a trade-off between redistribution and growth. For example, using cross-countries comparisons, Ostry et al. (2014) showed that there is no such trade-off between higher social spending and economic growth. This has, of course, major implications for public policy. According to the study “Redistribution appears generally benign in terms of its impact on growth; only in extreme cases is there some evidence that it may have direct negative effects on growth” (Ostry et al., 2014, p. 4) which means that the combined direct and indirect effects of redistribution – including the growth effects of the resulting lower inequality – are on average pro-growth.
Finally, the last myth argues that economic growth will automatically reduce poverty. The poverty headcount ratio has decreased significantly in Latin America during the last decade even at faster rates than poverty reduction in other regions of world. While in the beginning of the 2000s, 43 per cent of the population in the region lived in poverty, the poverty rate, in 2013 was only 28 per cent, according to ECLAC data. This means that between 2000 and 2013 more than 80 million persons were lifted out of poverty in the region.
The fast poverty reduction in the region relied on a combination of both faster economic growth and redistribution. Economic growth was significantly pro-poor, in the sense that incomes of the lowest deciles of the distribution grew relatively more than the incomes at the top; also, faster growth translated into higher formal employment. On the redistribution side, higher social spending and the expansion of SPS, with important innovations in the dimension of non–contributory programs to reach excluded households, had important redistributive effects, reducing poverty and also the inequality among the poor. 2 In terms of social spending, the poverty reduction effects of CCT programs have to be highlighted. CCT proliferated in the region in the beginning of the 2000s after the first programs in Mexico and Brazil. One of the many impact evaluations of the CCTs of Brazil and Mexico, showed that the programs reduced the poverty headcount ratio by 2.1 per cent in Brazil and by 7.6 per cent in Mexico; the impact on the poverty square gap was even higher, 14.8 per cent and 29.4 per cent, respectively (Fiszbein et al., 2009, Table 4.3).
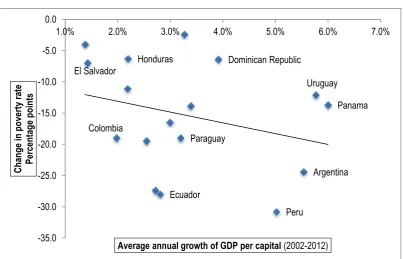
Looking at our statistical evidence, it is true that both higher social protection index (high social spending) and higher GDP per capita reduce poverty. However, and interestingly, as seen in Figure 10, the correlation in Latin America seems to be higher between changes in SP Index and poverty reduction (left-hand figure) than between annual growth rate of GDP per capita and poverty reduction (right-hand figure). 3
2 See Cecchini and Martínez (2014) and Fiszbein et al., (2009).
3 Even running some simple regression, the R2 of the SPI is higher and it is more significant than the
Figure 10. Poverty rate change and average annual growth rate of GDP per capita (right-hand figure) and change in the Social Protection Index (left-hand figure), 2002-2012
Source: GDP and poverty data from ECLAC.
This indicates that poverty reduction is more associated with an increase in the SPI, than with GDP growth rates. Leaving aside the causality debate, it is possible to evidence, as many studies on pro-poor growth have already shown, that although GDP growth can reduce poverty, this is not always automatic, refuting the tickle-down myth. On the contrary, better SPS are more likely to reduce poverty.
Bolivia Peru Dominican Republic Ecuador Colombia Mexico El Salvador Panama Venezuela Argentina Chile Uruguay -35.0 -30.0 -25.0 -20.0 -15.0 -10.0 -5.0 0.0
-0.05 0.00 0.05 0.10 0.15 0.20 0.25 0.30
C h an g e i n p o ve rt y r at e P er ce n ta g e p o in ts
Change in SP Index Score (2002-2012)
Honduras Colombia Peru Dominican Republic Ecuador Paraguay El Salvador Panama Argentina Uruguay -35.0 -30.0 -25.0 -20.0 -15.0 -10.0 -5.0 0.0
1.0% 2.0% 3.0% 4.0% 5.0% 6.0% 7.0%
C h an g e i n p o ve rt y r at e P er ce n ta g e p o in ts
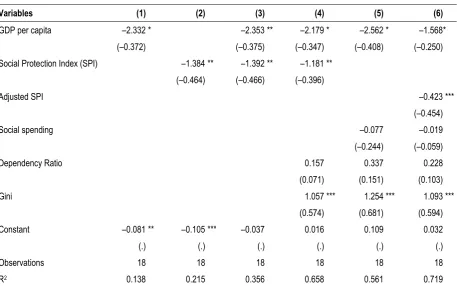
[image:31.595.131.535.382.641.2]A simple regression analysis for the absolute change in the poverty rate (in percentage points) between 2002 and 2012 as a function of the average annual growth change of per capita GDP and the absolute change in the SPI shows that the change in poverty is significantly and positively associated with both (Table 3), controlling for the level of inequality, and the demographic dependency ratio. Furthermore, when looking at the standardized beta coefficient, which represents the change in the poverty rate for every one standard deviation change in the explanatory variable, it can be seen that the effect of one standard deviation change in the SPI is stronger than that for GDP capita.
[image:32.595.64.522.331.617.2]One specification of the model regressed the poverty change as a function of GDP growth and social spending (not including the SPI). Interestingly, an increase in social spending per se is not significantly associated with the reduction in poverty in the period analyzed, as shown in regression in column (5) of Table 3. We then calculated an adjusted SPI that does not include the social spending dimension but only includes the coverage indicators (dimensions of universality and solidarity). As seen in regression in column (6) of Table 3 although social spending is not significantly associated with poverty reduction, an improvement in the adjusted SPI is significantly associated with it. As with regressions in columns (3), and (4) of Table 3, the effect of an increase in one standard deviation of the adjusted SPI is higher than one standard deviation increase in GDP.
Table 3. Regression analysis
Variables (1) (2) (3) (4) (5) (6)
GDP per capita –2.332 * –2.353 ** –2.179 * –2.562 * –1.568 *
(–0.372) (–0.375) (–0.347) (–0.408) (–0.250)
Social Protection Index (SPI) –1.384 ** –1.392 ** –1.181 **
(–0.464) (–0.466) (–0.396)
Adjusted SPI –0.423 ***
(–0.454)
Social spending –0.077 –0.019
(–0.244) (–0.059)
Dependency Ratio 0.157 0.337 0.228
(0.071) (0.151) (0.103)
Gini 1.057 *** 1.254 *** 1.093 ***
(0.574) (0.681) (0.594)
Constant –0.081 ** –0.105 *** –0.037 0.016 0.109 0.032
(.) (.) (.) (.) (.) (.)
Observations 18 18 18 18 18 18
R2 0.138 0.215 0.356 0.658 0.561 0.719
Source: Author’s own calculations based on data from ECLAC (2014a, 2014b) World Development Indicators and constructed index of SP.
Notes: Robust normalized beta coefficients in parentheses. * p<0.1; ** p<0.05; *** p<0.01.
these may not be automatic, meaning growth may not always be pro-poor. 4 According to a UNDP report, and using a Datt-Ravallion decomposition, 38 per cent of the change in poverty during the last decade in the region was due to a redistribution effect; the rest was due to a growth effect. Although the redistribution effect is lower than the growth effect, higher social spending and social protection policies are playing each time a more important role in poverty reduction (UNDP, 2016) thanks to the innovations in social policy and SPS.
These results have major policy implications. First, it is not true that at each level of GDP countries can only afford to spend a certain amount in social protection. In fact, given the time it takes to build well-functioning social protection systems, waiting until high levels of GDP have been achieved in order to introduce comprehensive social protection systems is not a realistic or efficient option (Cichon and Scholz, 2009). Second, there is also no trade-off between redistribution and growth. And, finally, better SPS are more likely to reduce poverty than growth, indicating important complementarities between both of them. Countries with comprehensive SPS have on average lower poverty rates, and countries that improve the most their SPI have also reduced the poverty rate at a much faster rate.
4 Cichon and Scholz (2009) arrive at the same conclusions on a similar analysis for other countries
5.
The redistributive effectiveness
of transfers and the effect of fiscal policy
[image:34.595.65.525.277.525.2]The effect of transfers as a public tool for redistribution varies with the characteristics of the Social Protection Systems. Countries that have comprehensive SPS have a higher incidence on both the reduction of inequality and poverty, followed by countries with intermediate systems and then, countries with limited systems, both through direct and in-kind transfers. This means social spending is more powerful as a tool for redistribution and poverty reduction in comprehensive systems, which have relatively higher universal coverage and higher social spending in these transfer programs, compared to intermediate and limited systems. This is indicated in Figures 11 and 12, based on the information on the redistributive effects of social spending provided by the Commitment to Equity Project of Tulane University and the Inter-American Dialogue.
Figure 11. Redistributive effect of social spending, direct and in-kind transfers (Absolute change of Gini coefficient) 1
Source: Commitment to Equity (CEQ) Project based on the working paper for each country.
Notes: The incidence analysis measures the changes in Gini coefficient and the poverty indicator between different income concepts (i.e. before taxes and transfers, after direct taxes, and after direct and in-kind transfers). The difference in the Gini coefficient of the net market income (which is market income less the personal income tax and employee contributions to social security) and disposable income (which is net market income plus direct public transfers) is the redistributive effect of direct transfers. The difference between net market income and final income * is the effect of all direct transfers and in-kind transfers. 2
* Pensions are considered as part of market income.
1 The Commitment to Equity (CEQ) assessment uses standard incidence analysis to address the
following three questions: How much redistribution and poverty reduction is being accomplished in each country through social spending, subsidies and taxes? How progressive are revenue collection and government spending? Within the limits of fiscal prudence, what could be done to increase redistribution and poverty reduction in each country through changes in taxation and spending? CEQ is among the first efforts to comprehensively assess the tax/benefit system in developing countries (including indirect subsidies and taxes and in-kind benefits in the form of free education and health care) and to make the assessment comparable across countries and over time. See all working papers of the CEQ Project. The data for each country comes from the working paper of each specific country.
2 For detailed explanation of the methodology see the handbook on the estimation methodologies
(Lustig and Higgins, 2013). Final Income * is defined as disposable income plus in-kind transfers minus co-payments and user fees.
-0.04
-0.02
-0.01 -0.02 -0.01 -0.02 0.00 -0.01 -0.01 0.00 -0.01 -0.08
-0.09
-0.10
-0.06
-0.05 -0.04
-0.03
-0.05
-0.02 -0.03 -0.02
-0.14
-0.12
-0.10
-0.08
-0.06
-0.04
-0.02
0.00
Argentina (2009)
Brazil (2009)
Costa Rica (2010)
Uruguay (2009)
Mexico (2010)
Ecuador (2011-12)
Peru (2009) Bolivia (2009)
El Salvador (2010)
Paraguay (2010)
Guatemala (2010)
Comprehensive SPS Intermediate Limited SPS
On average, countries with comprehensive systems reduce inequality of the Gini coefficient by 0.021 points through direct transfers and by 0.085 through in-kind transfers. Intermediate systems do so by 0.01 and by 0.037 points of the Gini coefficient, respectively, while countries with limited systems have almost no incidence on inequality through direc