AN IMPLICIT REGULARIZATION FOR 3D BUILDING ROOFTOP MODELING USING
AIRBORNE LIDAR DATA
Gunho Sohn*,Yoonseok Jwa, Jaewook Jung, Heungsik Brian Kim
GeoICT Lab, Geomatics Engineering Program, Earth and Space Science and Engineering Department, York University, Toronto, Canada - (gsohn, yjwa, jwjung, hskim)@yorku.ca
Commission III, WG III/4
KEY WORDS: 3D Rooftop Modeling, Binary Space Partitioning, Minimum Description Length, Regularization, LIDAR
ABSTRACT:
This paper proposes a new algorithm to generalize noisy polylines comprising a rooftop model by maximizing a shape regularity (orthogonality, symmetricity and directional simplications). The nature of remotely sensed data including airborne LiDAR often produce errors in localizing salient features (corners, lines and planes) due to weak contrast, occlusions, shadows and object complexity. A generalization or regularization process is well known algorithm for eliminating erroneous vertices while preserving significant information on rooftop shapes. Most of existing regularization methods achieves this goal base on a local process such as if-then rules due to lacking global objective functions or mainly focusing on minimising residuals between boundary observations and models. In this study, we implicitly derive rules to generate local hypothetical models. Those hypothesized models produce possible drawings of regular patterns that given rooftop vectors can possibly generate by combining global and local analysis of line directions and their connections. A final optimal model is globally selected through a gradient descent optimization. A BSP (Binary Tree Partitioning)-tree was used to produce initial rooftop vectors using ISPRS WGIII/4’s benchmarking test sites in Veihngen. The proposed regularization algorithm was applied to reduce modelling errors produced by BSP-tree. An evaluation demonstrates the proposed algorithm is promising for updating of building database.
1. INTRODUCTION
In recent years, there has been increasing demands to have 3D rooftop models as emerging technologies such as GeoWeb, LBS (Location Based System) and MAR (Mobile Augmented Reality) have been demonstrated potential applications. These include urban management, planning and development (Scherer and Schapke 2011, Yu et al. 2010), environmental management (Kurakula 2007), tourism (Glander and Dollner 2009), telecommunications (Wagen and Rizk 2003), transportation and navigation, public safety. Reconstructing 3D rooftop models using remotely sensed data should deal with the presence of the “missing data”. Assume that a rooftop is comprised of a set of polygons (planar features), which are inter-linked with lines (linear features). It is generally unknown as a priori knowledge: how the shape of a building of interest is (shape prior); how many features (polygons and lines) are required to model it; what topological rules (relations) are associated with the model. Moreover, the signal-to-noise ratio is always unknown, which causes difficulties to predict fragmentary level of modelling cues (features) extraction. Knowing a building shape prior would make ease all difficulties in rooftop modelling since it provides compensate the knowledge on “missing features” and “missing relations”. However, obtaining such rich priors is rare case in practice: even generalizing the shape prior into a semantic level (how to describe a shape) would be hard problem. To overcome this limitation, the parametric modelling approach (You et al. 2003, Verma and Kumar 2006, Teo 2008, Frederik et al. 2012) poses it as a model selection problem. That is, the method assumes that multiple shape priors (flat, gable, hip and etc) are given in advance. Thus, the rooftop problem is now translated into determining which prior (model template) would be the best fit to given observations (surface model and features) and estimating associated model parameters. The method would be promising if right modelling templates and sufficient observations are given for reconstructing rooftop models.
However, a most challenge in this approach might be faced when a building of interest is comprised of N numbers of sub-models; unfortunately this would be the case in complex urban setting. In contrast to the parametric modelling approach, a generic modelling (Rottensteiner 2003, Alharty and Bethel 2004, Sampath and Shan 2007, Sohn, et al. 2008) is based on a bottom-up vision process, which recovers the missing data mainly relying on extracted features from given data. This could limit to access to building shape priors, which causes more difficult problems in recovering missing features and their topological relations. However, it would be adaptive to delineate more complex shapes by avoiding the use of shape priors. However, the missing features is an inevitable. The generic modelling method should deal with recovering the features missed during its reconstruction process. Sohn et al. (2008) proposed a BSP (Binary Space Partitioning)-tree as for solving the missing data problem in a generic modelling approach. It demonstrated its success to produce building models, but also discussed its limitations of incorrectly producing topological links amongst modelling features. This paper proposes a new method to rectify the topological errors produced by Sohn et al. (2008)’s BSP algorithm. The proposed method is designed mainly based on part of cartographic regularization algorithms (Douglas and Peucker, 1973; Weidner and Forstner, 1995; Ameri, 2000; Sampath and Shan, 2007), which eliminates erroneous vertices, while preserving significant information of building shape. Our method was motivated by Weidner and Forstner (1995)’s work. We consider the resulting vectors from BSP as nosy model boundaries. The proposed algorithm progressively rectifies them based on Minimum Description Length (MDL).
2. METHODOLOGY
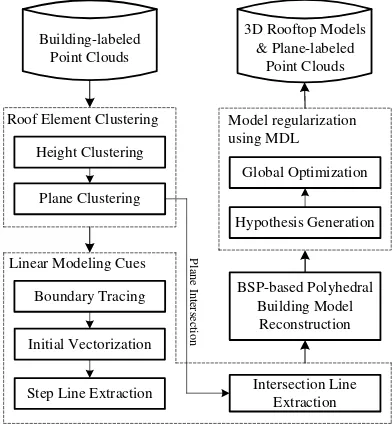
This paper proposes a new generative modelling approach to reconstruct 3D building model and rectify their geometric and
topological errors amongst modelling features. The important aspect of the proposed method is to determine a optimal shape regularity (orthogonality, symmetricity and simplication) during modelling process. This is achieved by testing hypothesized regularizing models. Fig. 1 depicts the whole work flow for combination of building parts including roof superstructures. This places some limitations on extracting meaningful modelling cues directly from building-labelled point clouds. To reduce the complexity in feature extraction, the first step is to partition building points into each homogeneous rooftop region based on two similarities: height and plane similarity. In the height clustering, let R = {Pi | i=1,2,…n} represent a rooftop region with n numbers of points and consists of m numbers of height segments R = {S1,S2, …, Sm}. Height difference at each point is computed from its neighbour points connected in Triangular Irregular Network (TIN). If is less than a certain threshold, Pi belongs to the same height cluster. As a result, the
segments satisfy with the property R= {}, maximum probable inlier points and all points that belong to Si are assigned into plane clusters.
2.2 Linear Modelling Cue Extraction
After plane segments are detected, two different types of line primitives (intersection and step lines) are extracted. The intersection line is simply generated by intersecting between adjacent planar segments. To extract step lines, plane boundary
points are traced. This process is accomplished by using a modified convex-hull method, in which the topology between member points is defined based on TIN structure. Then a local height discontinuity is investigated to detect step edge pixels among boundary points between adjacent planes. Then the process of initial vectorization is performed to generate linear modelling cues. Given a sequence D={P1, …, Pn}, Pi 2 of n boundary points in the plane, the polyline segments are formed as a successive chain C= { }. The initial simplification of polylines is performed by obtaining a chain C’ with m fewer segments. To achieve this goal, we adopt Douglas-Peucker (DP) algorithm which has been recognized as an effective line simplification method (Ramer, 1972). By using a line segment ={1 ≤ i, j ≤ n | i ≠ j}, if the norm from a vertex to is less than tolerance ζ > 0, the vertex is removed, while a vertex shows the maximum norm is determined as an inlier point to the line segment . This procedure continues until the norms of remaining vertices are less than ζ. Note that the degree of irregularity to be handled in DP algorithm depends on ζ. DP is effective to eliminate erroneous vertices in a simple manner. However, it does not provide a mechanism to make given polylines being regular shape patterns, that is maximizing Gestatic laws (orthogonality, parallelity and symmetricity) in addition to simplication. In later sections, we propose these multiple objectives can be achieved through MDL (Minimum Description Length).
2.3 BSP-based Polyhedral Building Model Reconstruction
Once all modelling features (lines and planes) are extracted as described in the previous sections, topological relations amongst modelling features for each height segment are constructed using Sohn et al. (2008)’s algorithm. Sohn et al. (2008) concentrated on a topological construction with fragmentary modelling features. They proposed BSP-tree as its solution to globally recover modelling topology from incomplete features. A partitioning optimum is achieved by maximizing planar homogeneity produced through a recursive intersection between lines and associate planes. The process generates a hierarchical binary tree, in which each node (terminal) represents planar polygons that provides the information of topological relations among its adjacent planar segments. A final model is produced to combine similar planar segments in BSP-tree.
2.4 Model regularization using MDL
A most bottleneck of BSP-tree for rooftop modelling is caused by an “accidental cause” that occurs in line-line intersection for constructing planar topological relations. That is, an error in line feature inherited from line extraction process might lead to errors in geometry and under-/over-generation of vertices in rooftop models. Thus, it is required to rectify those errors. It could be done by line simplication algorithm. However, our goal is to make given rooftop vectors being a regular shape pattern in addition to eliminating erroneous vertices; combining line simplication with regularization. A shape regularity is defined as being as shape pattern that shows orthogonal, parallel and symmetric relations between lines as similar to Gastaltic laws. This prior knowledge on shape regularity is often implemented using a set of deterministic rules such as “ IF-THEN” rules. However, in our approach, the shape regularity means more than pre-specified rules, but implicitly derive rules (possible shape regularity) with given initial rooftop vectors. The proposed method does not require pre-determined threshold constraining the regular shapes, rather determining optimal shape through MDL-based model selection process.
In MDL theory, we can estimate the lengths (model description length) that encode the messages delivered with observations associated with corresponding model. It is convenient to decompose the model description length (DL) into two parts: the length of the data with given model (the first term in Eq. (1)) and the length of the model (the second term in Eq. (1)). The first term in Eq. (1) measures how the data D is well approximated with hypothesized model H (favouring low residuals), while the second term in Eq. (1) encoding the model complexity used (favouring simpler models). In Eq. (1), the model complexity is defined by three factors: 1) the number of vertices used , (2) the repeatability of identical line direction , and (3) the inner angle transition . An optimal model is
Where the subscript v, d, and indicate vertex, direction, and inner angle; Ω is the sum of the squared residuals between a model (H) and a set of observations (D), [D-H]T[D-H]; LS means the line significance of polylines, (L/APD)/NP, which is comprised of line length (L), average point distance (APD) and the number of its member points (NP); , , and indicate the number of vertices, the number of identical line directions, and quantity of penalty value related to inner angle. These factors are used for an initial model; , , and are related to newly generated hypothetical models; , , and are weight values for each sub-factor in the model complexity; , and are weight values for the model closeness and model analyzing given rooftop vectors for estimating line directions and 2) local configuration of lines connected at i-th vertex. w
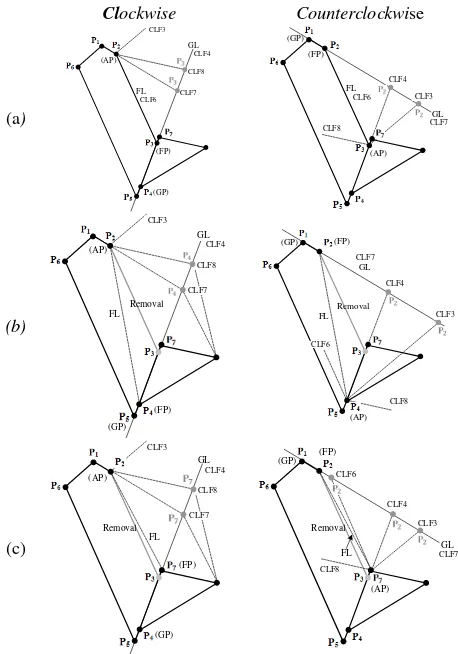
For instance, Fig. 2 shows a situation where a number of model hypotheses is produced at P2 in a polygon A={P1, P2, P3, P4, P5, P6, P7}, to which another polygon B ({P4, P7} ∈ B) is connected. We label three vertices (P2, P3, P4) as Anchor Point (AP), Floating Point (FP), and Guiding Point (GP). Using these vertices, we drive three basis lines, Floating Line (FL = [AP, FP]) and Guiding Line (GL = {[GP, FP] (x, y) |
}) in two different orientations, clockwise and counter-clockwise. Where, indicates the angle between a line segment and x-axis, and is the line distance from the origin. For each vertex, a number of model hypotheses are generated by moving FP along GL following a set of line directions. These line directions are analyzed globally using given entire rooftop vectors. For this purpose, we adopt Compass Line Filter (CLF) proposed by Sohn et al. (2008). This filter quantizes line slopes into pre-specified numbers of discrete line directions, which will be refined by least-square adjustment. Fig. 2(b) and 2(c) illustrates how another sets of model hypotheses are produced when FP is merged with adjacent vertices (P4, P7)
belonging to B. This process can be considered as part of line simplication which eliminates erroneous vertices produced by “accidental causes” occurred in BSP.
Figure 2. Possible alternative hypotheses by assigning three vertices as AP, FP, and GP: (a) moving FL = {P2, P3}, (b) BSP-tree). Note that Hi has a set of locally produced hypotheses
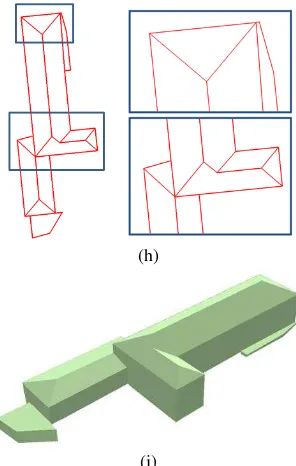
at i-th vertex. The optimal model H* is finally selected which shows the minimum description length following Eq. (1). Similar to gradient descent optimization, this process will be terminated if the current iteration of model selection does not gain in reducing the description length compared to the previous iteration. Fig. 3 depicts an example of the proposed building rooftop modelling procedure. The process starts with classified building map from airborne LiDAR data (Fig. 3(b)). Using this classified points, building point clouds are then segmented into height clusters (Fig. 3(c)) based on a height discontinuity, which is subsequently segmented into planar patches using RANSAC (Fig. 3(d)). Then, intersection (Fig. 3(e)) and step (Fig. 3(f)) lines are extracted. The extracted linear modelling cues are introduced to the BSP-based modelling to produce initial rooftop vectors (Fig. 3(g)). Finally, MDL-based regularization is performed by rectifying geometrical distortions between adjacen plane/line segments (Fig. 3(h)), and the fine rooftop model is produced as shown in Fig. 3(i).
(a)
(b)
(c)
(d)
(e)
(f)
(g)
(h)
(i)
Figure 3. Results in reconstructing an optimal rooftop model: (a) aerial image, (b) LiDAR data, (c) height clustering, (d) plane clustering, (e) intersection line extraction, (f) step line extraction, (g) BSP-based building reconstruction with distortion errors indicated as arrows, (h) MDL-based shape regularization, and (i) 3D polyhedral building model.
3. EXPERIMENTAL RESULTS
The performance of the proposed approach was evaluated with the real data set which is provided from ISPRS Commission III, WG3/4 and used for the ISPRS test project on the urban classification and 3D building reconstruction. As shown in Fig. 4, the test data (120m 180m) contains historic buildings showing various degrees of shape complexity including rectangle, L, I, T-shape, gable and hip roof, which are located in Vaihingen, German. The Vaihingen LiDAR data set was acquired by Leica ALS50 system at an altitude of 500m above ground level in August 2008. 10 strips are overlapped with 30% rate and an average point density is approximately 6.7/m2 (~0.39 m point spacing). The 3D positional accuracy of the point clouds is approximately less than 15 cm.
Figure 4. Test data set (yellow colour contour line area) The evaluation results on building rooftop modeling are reported from the ISPRS Commission III, WG3/4 and are summarized in Table 1. To evaluate overall building
reconstruction performance, a confusion matrix which consists of three classes (i.e., completeness, correctness, and quality) is used, which are derived from the following three factors: (a) TP (True Positive) which is the number of building objects that are found in both the reference and the result, (b) FN (False Negative) which is the number of building objects that are found only in the reference, but not in the result, (c) FP (False Positive) which is the number of building objects that are found only in the result but not in the reference. Based on the ratio among the three factors, the completeness denotes the detection rate of objects and the correctness means how well the objects correctly match to buildings in the reference. The quality indicates the overall performance of results in the comparison with the reference. These evaluation criteria are described as:
Completeness (%)
(2)
Correctness (%)
(3)
Quality (%) (4)
The three classes are computed with respect to three geometric levels: area, object, and object balanced by area. A more detail description of the evaluation factors can be found in Rutzinger et al. (2009) and the website, http://www. commission3.isprs. org/wg4/.
Table 1. Overall performance of building rooftop modelling Category[%] Completeness Correctness Quality
Area 88.8 99.5 88.4
Object 88.2 98.5 87.0
Object Balanced
by Area 93.4 99.3 92.7
Average 90.1 99.1 89.4
The overall performance of the proposed approach shows 90.1% for completeness, 99.1% for correctness, and 89.4% for quality. In the building reconstruction based on LiDAR data, theist model quality normally relies on the irregularity in the data distribution. Moreover, due to the use of laser last return information, the extracted models tend to shrink compared to reference vectors digitized from high-resolution images with centimetre-level ground sampling distance. This results in the low completeness compared to high correctness.
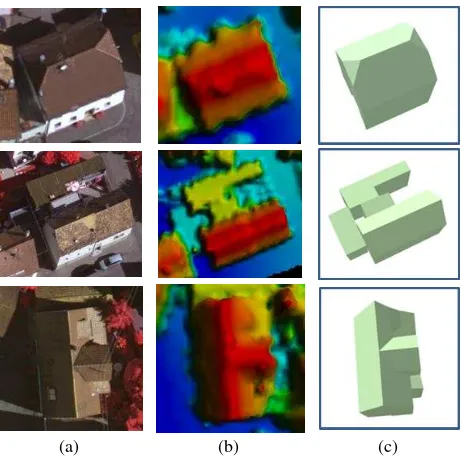
Fig. 5 shows several examples and the whole 3D building models reconstructed by the proposed method depict in Fig. 6.
(a) (b) (c)
Figure 5. Reconstructed complex roof structure building: (a) airborne images, (b) Lidar point clouds, and (c) perspective view of the reconstructed 3D building model.
The proposed method has main limitations: (a) during the clustering process of neighboring points, polygons can be over-segmented due to the use of a certain error tolerance. For example, 1m tolerance is used for evaluating height discontinuity. (b) Curved polylines are extracted as linear segments. These limitations cause the occurrence of deformation rooftop models.
(a)
(b)
Figure 6. 3D building reconstruction results in the whole test area: (a) LiDAR data and (b) 3D fine building models
4. CONCLUSIONS
This study presented the new automatic regularization method to correct geometric and topological errors between adjacent plans or line vector segments based on the MDL theory. A new objective function is introduced to enhance the efficiency of geometric regularity in terms of the repetition of identical line directionality, regular inner angle transition and the number of vertices used. The experiments demonstrate that the proposed automatic method for 3D fine building modeling is able to achieve high overall modeling quality with more than 89% based on the used evaluation factors. As future researches, we will integrate multiple data sources such as image and LiDAR data to reconstruct more detail rooftop models including small superstructures.
ACKNOWLEDGEMENTS
This research was supported by a grant (06KLSGB01) from Cutting-edge Urban Development - Korean Land Spatialization Research Project funded by Ministry of Land, transport and Maritime Affairs of Korean government. The author also like to appreciate the support of the project “Spatiotemporal Risk Management of Power-line Networks” funded by OCE and NSERC.
REFERENCE
Ameri, B., Fritsch, D., 2000. Automatic 3D building reconstruction using plane-roof structures. American Society of Photogrammetry and Remote Sensing (ASPRS) Congress, Washington, DC. 2000.
Ameri, B., (2000), Feature-Based Model Verification (FBMV): a new concept for hypothesis validation in building Reconstruction, In: IAPRS, Vol. XIX, Part 3, in press, Amsterdam, the Netherlands.
Alharty, A., Bethel, J. 2004. Detailed building reconstruction from airborne laser data using a moving surface method. International Archives of Photogrammetry and Remote Sensing. Vol. XXXV, Part B3, pp. 213-218.
Douglas, D.H. and Peucker, T.K., (1973). Algorithms for the reduction of the number of points required to represent a digitized line or its caricature. Canadian Cartographer, 10(2), pp. 112-122.
Glander, T., Dollner, J., 2009. Abstract representations for interactive visualization of virtual 3D city models. Computers, Environment and Urban Systems, 33(5), pp. 375-387.
Kurakula, V., 2007. A GIS-based approach for 3D noise modeling using 3D city models. Master Thesis, International Institute for Geo-Information Science and Earth Observation, Enschede, The Netherlands.
Ramer, U., 1972. An iterative procedure for the polygonal approximation of plane curves. Computer graphics and Image Processing, 1, pp. 224-256.
Rottensteiner, F., 2003. Automatic generation of high-quality building models from LiDAR data. IEEE Computer Graphics and Applications, 23(6), pp. 42-51.
Rutzinger, M., Rottensteiner, F., Pfeifer, N., 2009. A comparison of evaluation techniques for building extraction
from airborne laser scanning. IEEE Journal of Selected Topics in Applied Earth Observations and Remote Sensing, 2(1), pp. 11-20.
Sampath, A., Shan, J., 2007. Building Boundary Tracing and Regularization from Airborne Lidar Point Clouds. Photogrammetric Engineering & Remote Sensing, 73(7), pp. 805-812.
Scherer, R.J., Schapke, S.E., 2011. A distributed multi-model-based management information system for simulation and decision-making on construction projects. Advanced Engineering Information, 25(4), pp. 582-599.
Sohn, G., Huang, X., Tao., V, 2008. Using binary space partitioning tree for reconstructing 3d building models from airborne lidar data. Photogrammetric Engineering & Remote Sensing, 74(11), pp. 1425-1440.
Tack, F., Buyuksalih, G., Goossens, R., 2012. 3D building reconstruction based on given ground plan information and surface models extracted from spaceborne imagery. ISPRS Journal of Photogrammetry and Remote Sensing, 67(1), pp. 52-64.
Tarsha-Kurdi, F., Landes, T., Grussenmeyer, P., 2008. Extended RANSAC algorithm for automatic detection of building roof planes from LiDAR data. Photogrammetric Journal of Finland, 21(1), 97–109.
Teo, T.A., 2008. Parametric reconstruction for complex building from LiDAR and vector maps using a divide-and-conquer strategy. International Archives of Photogrammetry and Remote Sensing, Vol. XXXVII, Part B3a, pp. 133-138.
You, S., Hu, J., Neumann, U., Fox, P., 2003. Urban site modeling from Lidar. International Conference on Computational Science and Applications, Vol. 3, pp. 579-588. Yu, B., Liu, H., Wu, J., Hu, Y., Zhang, L., 2010. Automated derivation of urban building density information using airborne LiDAR data and object-based method. Landscape and Urban Planning, 98(3-4), pp. 210-219.
Verma, V., Kumar, R., 2006. 3D building detection and modeling from aerial lidar data. Computer Vision and Pattern Recognition, Vol. 2, pp. 2213-2220.
Wagen, J., Rizk, K., 2003. Radiowave propagation, building databases, and GIS: anything in common? A radio engineer’s viewpoint. Environment and Planning B: Planning and Design, 30(5), pp. 767-787.
Weidner, U., Förstner, W., (1995). Towards Automatic Building Extraction from High Resolution Digital Elevation Models, ISPRS Journal, 50(4), pp. 38-49.