OPTIMAL CAMERA NETWORK DESIGN FOR 3D MODELING
OF CULTURAL HERITAGE
B. S. Alsadika,b, M. Gerkea, G. Vosselmana
a
University of Twente, ITC Faculty, EOS department, Enschede, The Netherlands – (alsadik, gerke, vosselman)@itc.nl b University of Baghdad, College of Engineering, Surveying department, Baghdad, Iraq – [email protected]
Commission III, WG III/1
KEY WORDS: Three-dimensional – Image based modeling – Network design – Visibility – SfM– Optimization
ABSTRACT:
Digital cultural heritage documentation in 3D is subject to research and practical applications nowadays. Image-based modeling is a technique to create 3D models, which starts with the basic task of designing the camera network. This task is – however – quite crucial in practical applications because it needs a thorough planning and a certain level of expertise and experience. Bearing in mind todays computational (mobile) power we think that the optimal camera network should be designed in the field, and, therefore, making the preprocessing and planning dispensable. The optimal camera network is designed when certain accuracy demands are fulfilled with a reasonable effort, namely keeping the number of camera shots at a minimum.
In this study, we report on the development of an automatic method to design the optimum camera network for a given object of interest, focusing currently on buildings and statues. Starting from a rough point cloud derived from a video stream of object images, the initial configuration of the camera network assuming a high-resolution state-of-the-art non-metric camera is designed. To improve the image coverage and accuracy, we use a mathematical penalty method of optimization with constraints. From the experimental test, we found that, after optimization, the maximum coverage is attained beside a significant improvement of positional accuracy. Currently, we are working on a guiding system, to ensure, that the operator actually takes the desired images. Further next steps will include a reliable and detailed modeling of the object applying sophisticated dense matching techniques.
1. INTRODUCTION
The creation of realistic 3D models and their visualization is becoming more common nowadays and became part of the modern digital age (Quan, 2010) especially in cultural heritage documentation, restoration, conservation and the development of research in this field.
According to the demands of portability, low cost, fast acquisition, and accuracy, images represent a successful source to create these reality 3D models by the techniques of Image – Based Modeling (IBM). Automatic techniques can be used to track the image features and solve it mathematically by using Structure from Motion SfM techniques, which refer to the computation of the camera stations and viewing directions (imaging configuration) and the 3D object points from at least two images.
Although automatic techniques for measuring image coordinate and camera orientation are achievable nowadays, automatic devising of accurate and highly detailed 3D models still need a well-designed camera network. Camera network design needs many efforts in planning and a high degree of proficiency, which is a costly operation, and it is mainly concerned with finding the suitable placements for the minimum number of imaging cameras.
The optimal imaging configuration provides a high imaging accuracy and coverage. Kiamehr (2003) defined that the main purpose of network optimization is the design of an optimal network configuration and optimal observing plan in the sense that these optimal locations will meet the network quality requirement at a minimum cost. During the last three decades, Different mathematical techniques were used to solve the problem of camera network optimization (Fraser, 1984; Mason, 1995; Olague, 2002; Saadatseresht et al., 2005).
The papers of Mason (1995,1997) focused on classifying the object of a pre-designed CAD model into geometrical primitives
(planes, cylinders, etc.) and then designing a generic camera network, consisting of four cameras, to image each plane and then connecting the planes with additional cameras. Olague (2002) and Olague and Dunn (2007) were focusing on optimizing the accuracy of the total camera design according to the categorization of Grafarend and Sanso (1985) and the setting of target control points to solve the problem for industrial environment with robotic arms. Moreover, Saadatseresht et al. (2005) used the fuzzy logic to solve for the camera network configuration problem. The experience of taking enough preliminary shots, fixing control points and the proper setting and adjusting of the fuzzy inference system were the crucial factors. For 3D reconstruction of cultural heritage and in contrast to the previous literature that focused on industrial application, wide-base imaging is not preferred despite the highly accurate geometric ray intersection (Remondino et al., 2008). However, to design a short-base (dense) imaging network, the computational cost to orient these images, increases with the square of the number of images (Barazzetti et al., 2010), which leads to a time-consuming process.
In this paper, the first steps, namely the computation of the initial, rough point cloud and the computation of optimal camera locations for a subsequent high-resolution image acquisition are described. The actual usage of the high-resolution images is subject to future work.
2. METHOD
The research will solve the optimal camera network problem in three successive steps:
- Computation of a rough point cloud and setting up an initial dense imaging block.
- Finding the minimum number of cameras, by filtering the initial dense imaging block.
- Optimizing the filtered block of images.
2.1 The creation of rough point cloud
The developed algorithm of optimal camera network in the research starts with the creation of an initial point cloud for the study object because of the need to identify the rough shape, size, and geometry. Since we want to be independent of existing geometric information on the object, like CAD models, this point cloud is derived from SfM methods, using a video image stream taken around the object, and including all parts of interest. See e.g. (Dellaert et al., 2000).
For objects like buildings, the point cloud should be segmented into adjacent planes (sub-clouds), which are the building facades. We will design an imaging block for each facade point cloud and then connect them by additional cameras in a similar way to (Mason, 1995).
2.2 Initial designs of the camera network
The network design is usually formed in a block shape where overlapped images are designed in multiple overlapped strips. In close range photogrammetry, a block can be designed in either an ordered image sequence or unordered sets of images. The first method has a linear computational cost with respect to the number of images. For unordered (sparse) sets of images, it is necessary to check all possible image pair combinations to determine the ones sharing sufficient correspondences (Barazzetti et al., 2010). Therefore, each image must be compared with all the others, leading to a high computational cost. For this reason, we used in this research the ordering imaging block type.
The same overlap percentage in aerial blocks of 60% endlap and 20% sidelap can be used in terrestrial blocks (Matthews, 2008). However, in this research, the accessible heights, that the camera operator can occupy, is chosen to be in the range of (.5 – 2 meters). Therefore, we will have a block design of images in most of the cases to capture, perfectly, the object in stereo as will be shown in the tests.
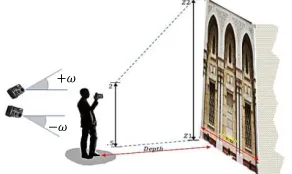
The viewing angle of the cameras toward the object will be computed for each strip according to the difference in height between the object and the camera as shown in Figure 1.
Figure 1. The relation between the camera accessible heights and object height
The distance between the camera and the study object ( ) is an important parameter in the camera placement
objective, and this is influenced by many factors like the camera field of view, user defined resolution, the free space available between the camera and the object, positional accuracy, and depth of field (Saadatseresht et al., 2005).
The required object minimum resolution or ground sample distance (GSD) is a key factor in determining the maximum depth distance between the camera and the object.
Another essential factor relates to the accuracy requirements. However, in the camera network design, the minimum depth distance will be selected, as the designing distance to maintain both demands of resolution and accuracy.
After setting all the requirements of the imaging block design, the camera exterior orientation parameters are defined initially by setting the camera locations , , , while setting
, and as the initial rotation angles. Figure 2 illustrates the relationship between this simulated camera system , , and object coordinate system , , .
Figure 2. Camera and object coordinate systems
As mentioned earlier, study objects are represented initially by a rough point cloud created automatically from video imaging. We assume in the research that these rough point clouds are accurate and without blunders. However, this assumption relies on the high redundancy offered by the video imaging and the efficiency of the blunders detection and removal.
2.3 Visibility requirement
The point cloud, which is generated automatically by the SfM technique, is to be tested for visibility from the designed camera locations. Therefore, we create a triangulation surface and compute the normal vector for each point. These normal vectors are used to test the visibility of points in each camera as shown in Figure 3 for a simulated building facade example.
Figure 3. Visibility by using the triangular surface normal vectors
Accordingly, the decision of considering points as visible or invisible, is depending on the absolute difference between the orientation of the camera optical axis and the normal vector direction . This difference is compared to a threshold to decide the visibility status. However, it must be noted that by using only this technique, we are not able to detect occluded areas. Such a method will be developed in the future.
F
iltration
proce
d
ure
2.4 Accuracy assessment
To validate the positional accuracy , , of the point cloud before and after the camera optimization, a simulation computation is used by evaluating the covariance matrix of unknown points .
The exterior orientation parameters , , , , , and the image coordinates , are considered as observations while the object coordinates are considered as unknowns , , . This assumption will allow the propagation of the expected errors from the exterior orientations and image coordinates back to the object points.
The errors assigned to the exterior parameters, and the image coordinates are assumed to be the same in all cases. To compute the covariance matrix for each point in the cloud, we can use the following equation (1):
(1)
Where is the design matrix, is the weight coefficient matrix, and is the variance of unit weight.
2.5 Minimum numbers of cameras
The aim of this research as mentioned earlier is to find the minimum number of cameras in an optimal configuration, which guarantees the sufficient coverage and accuracy. Fraser (1989) states that the high accuracy can be achieved with a large base imaging (Base/Depth ratio); however, it is not useful if the aim is a highly detailed 3D model, this would require a short base-imaging network according to (Haala, 2011). Consequently, the strategy of finding the minimum number of cameras is based on designing a dense imaging block, and then tries to filter out the cameras that are redundant in the sense of coverage. Finally, optimization is applied to modify and adjust the camera orientation and placement to minimize the expected errors in the point cloud.
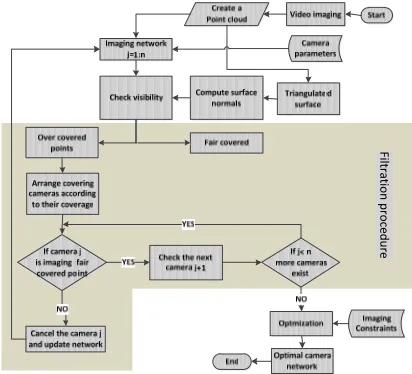
The diagram in Figure 4 summarizes the research procedure emphasizing on finding the minimum number of cameras.
Figure 4. Flowchart of the research methodology
The steps in details are:
1- Divide the derived point cloud from video imaging into over covered and fair covered. Over covered points are
the points that appear in more than three cameras while fair covered points refer to the points that appear in three cameras.
2- The algorithm starts by arranging the cameras involved in imaging over-covered points according to their coverage in an ascending order. The reason for this arrangement is to cancel the redundant cameras that are imaging a less numbers of points.
3- Canceling the camera that is involved in imaging the over covered point group, but never contribute in imaging fair covered points.
4- The network configuration is tested again according to the coverage after the camera cancelation and the point cloud is re-classified into over covered and fair covered. 5- The same procedure of step 3 is followed, and a new
camera is cancelled. The filtration is continued until no more redundant cameras involved in imaging only over-covered points. In future work, camera removal will also consider the reconstruction accuracy.
6- The filtered camera configuration is optimized for accuracy by using nonlinear constrained minimization. Optimization will be discussed in the following section. 7- The final camera configuration is statistically tested by
assessing the positional accuracy for each point in the cloud as mentioned in section 2.4 previously. The coverage assessment is also tested by back projecting the points into the optimized images by collinearity equations.
2.6 Optimum camera network
To compute the optimum camera network for 3D modeling, it is important to discuss the mathematical optimization overview before setting up the objective function and necessary constraints for the camera placement.
Optimization techniques are used to find a set of design parameters, , , … . , that can in some way be defined as optimal. In a simple case this might be minimization or maximization of some system characteristic that is dependent on . In a more advanced formulation the objective function to be minimized or maximized ,might be subject to constraints in the form of equality constraints,
, … . , , inequality constraints,
, … , ; and/or parameter bounds, , (Matlab, 2010).
The objective function and constraints can be nonlinear functions of the design variables and is called Nonlinear Programming (NP) problem. This problem is mathematically challenging as in this case of the camera placement problem. The condition that the gradient must be zero at the minimum is well known in algebra. However, for a nonlinear large scale minimization problem, an analogous condition called the Karush-Kuhn-Tucker (KKT) conditions must be fulfilled to find the optimum solution for this problem and guarantee a global optimum (Rao, 2009).
The mathematical challenge to solve such kind of problems is mainly in the existence of inequality nonlinear constraints as in our case for camera optimization. In this research the technique of interior point (Byrd et al., 1999) is used which gives reliable results as will be shown in the applications.
and essentially implemented by using a barrier method (Byrd et al., 1999):
,
, , ∑ ln
:
, , … . ,
, , … . , (2)
Where is the barrier parameter and where the slack variable (variables that is added to an inequality constraint to transform it into equality) is assumed to be positive to keep
ln bounded. As decreases to zero, the minimum of should approach the minimum of . To update the unknown parameters (camera exterior orientation ) and the slack variables , a step length must be determined and added to the initial values of these parameters , in an iterative way. These steps can be solved either by a direct (linear) search or by a conjugate gradient CG technique (Matlab, 2010). At each iteration, the algorithm decreases a merit function to determine whether the total step is acceptable. This is done by checking if the attempted step does not decrease the merit function, and in that case, the algorithm rejects the step and attempt a new step until the stopping tolerance satisfied. In this research the optimization toolbox of Matlab 2010 (Matlab, 2010) is used to implement this technique through the use of the function (fmincon).
The following subsections will discuss the formulation of the objective function and the necessary constraints to model the camera network optimization in this research.
2.6.1 The formulation of the camera optimization problem: we need to define precisely the input and output parameters to solve the optimization problem with camera placement. This is necessary to formulate the objective function that can guarantee the final goal of optimum camera placement. The input and output parameters can be listed as follows:
The input parameters:
- Point cloud ( , , ) coordinates acquired from video tracking.
-
The initial exterior orientation parameters for each possible (suggested) camera, which is acquired from the initial filtered imaging block., , , , , , , … .
.
These exterior orientation parameters will be collected in one vector ( ) which represents the initial guess of unknowns for the next optimization iteration step. The output parameters:
- The optimal exterior orientation parameters
, , , , , for each camera i.
In this research, the objective function is formulated as shown in equation (3). This will guarantee the maximum accuracy (Fraser, 1989) by the optimal minimum number of cameras.
(3)
This function is expressed by minimizing the computed average error in ( , , ) for each point in the cloud of unknown object point, which is computed according to the collinearity equations model. This is meant to improve the precision of the global project and thus, a larger number of images in which the same point is visible improves (Barazzetti et al., 2010).
At this stage, the input parameters are defined and set for the next step of optimization. Moreover, the camera optimization problem is a non-linear problem and needs to be constrained to get real results that satisfy the final goal for the 3D modeling of the object. The next section will explain the necessary constraints involved in the camera network optimization for 3D modeling.
2.6.2 The constraints on optimum camera placement: The camera placement problem is influenced by many design and geometric constraints, which can be listed as follows:
- The lower and upper bounds of the estimated parameters for each designed camera.
- The distance between the camera and the object: This constraint is formulated by determining the maximum allowable distance between the cameras and the study object, which is subject to the user-defined resolution, accuracy, and the camera angular field of view.
- The distance between the designed cameras:
The distance between any two cameras in the designed network must be constrained according to the allowed Base/Depth ratio, which may guarantee the possibility for the effective dense reconstruction and accurate ray intersection.
- The inequality constraint of the image coordinates: This constraint is formulated in order to force the points, which are imaged by a certain initial camera in the block, to remain observed in that image after optimization.
- The equality constraints of the image coordinates: This means to force the average of the image coordinates (in p.p. system) to equal zero. This constraint is useful to distribute the image points uniformly around the image center as possible. Consequently, this is supposed to improve the final accuracy since more points will appear in the optimal images besides supporting the previously mentioned inequality constraint.
3. EXPERIMENTS
To test the developed technique, we implement two experiments on automatically derived point clouds by the SfM technique of a building facade, and a statue. These point clouds are scaled into ground truth dimensions during the derivation process; however, a local coordinate system is adopted in the two cases. The imaging is simulated with an 18mm HD camera with a (22.3*14.9) mm2 frame size. The designed B/D ratio was .12 and .36 respectively.
Facade case
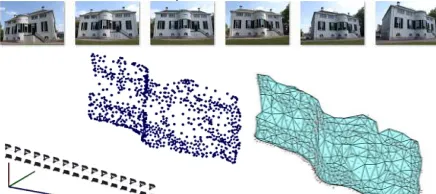
The first test as shown in Figure 5 is applied on a building facade point cloud consisting of 847 points and the surface triangulated mesh is prepared by using Meshlab open source software (Meshlab, 2010) and provide the face normals for visibility purpose. A simulation of 32 cameras block is designed automatically with a depth distance of 11.48 meters to satisfy the resolution and accuracy demands of 10mm.
Statue case
The second test was implemented on a statue point cloud (396 point) as illustrated in Figure 6, which is generated automatically by SfM technique from the video imaging stream of the statue by using Boujou software (Vicon, 2010). We transformed the triangular mesh into grid mesh and then conclude the statue points, and face normals. This will assure that the cameras will not miss any part of the statue because of the possible gaps in the rough point cloud. A simulation of 50 cameras block of two strips is designed around this statue in a circular domain with a depth distance of 2.5 meters to satisfy the required accuracy of 1mm.
Figure 6. The statue case and its initial block
4. RESULTS
The developed methodology is applied in both experiments of the building facade and the statue, and the results are reported in the following sections.
For the facade, the dense camera network is filtered according to coverage requirements of minimum three cameras and results with the imaging configuration of Figure 7a, which consists of 12 cameras after cancelling 20 redundant cameras. The optimization algorithm is followed to find the final optimal imaging configuration, which satisfies all the aforementioned constraints as shown in Figure 7b.
a) b) Figure 7. Imaging configuration of the facade
To validate the network reliability, error estimation is computed for each point in the cloud and plotted as an exaggerated ellipsoid of errors as illustrated in Figure 8. We can notice that the errors resulted from the dense and filtered networks near the edges and corners of the facade are larger than the required threshold (plotted in orange). This is because of the poor viewing geometry in the upper areas despite sufficient coverage.
Figure 8. The error ellipsoid plot a) dense network b) minimum coverage network c) optimal network
For the statue, as in the previous test, the algorithm runs by considering the minimum coverage to cancel one redundant camera iteratively, which for this test, stopped after the filtration of 31 cameras, and leaves only 19 necessary cameras. The continuing cameras guarantee the minimum of three intersecting rays for each point. The optimization algorithm is followed to find the final optimal imaging configuration, which satisfies all the aforementioned constraints as shown in Figure 9.
a) b)
Figure 9. Statue imaging network a) before optimization b) after optimization
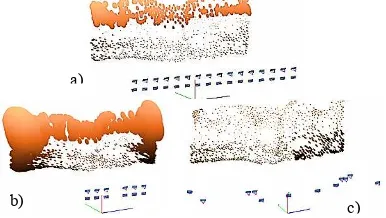
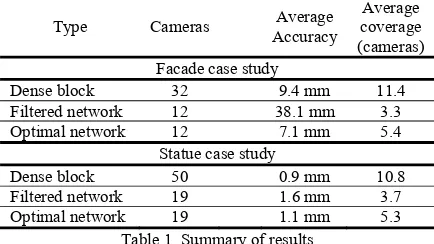
To validate the network strength, error assessment is computed for each point in the cloud of the filtered network and the optimal network. The plot of an exaggerated ellipsoid of errors is illustrated in Figure 10, and reported in Table 1.
a)
b) c)
Figure 10. The error ellipsoids for the statue points in three cases a) dense network b) filtered network c) optimal network
It’s worth to mention that for the statue case, if the optimization runs for a 10000 function count as shown in Figure 11, then it spent 82 minutes for processing on Hp Elitebook 8530 model with Intel processor Core2Duo 2.8GHz CPU. However, the optimization-computing engine in both cases was efficient in minimizing the objective function and looks to be stable after reaching (1500) function count, which consumes 12 minutes for processing.
Figure 11. The log plots of optimization run of the statue a)
The summarized results of both cases in accuracy, mean coverage and the number of cameras are illustrated in Table 1.
Type Cameras Average
Accuracy
Filtered network 12 38.1 mm 3.3
Optimal network 12 7.1 mm 5.4
Statue case study
Dense block 50 0.9 mm 10.8
Filtered network 19 1.6 mm 3.7
Optimal network 19 1.1 mm 5.3
Table 1. Summary of results
5. DISCUSSION AND CONCLUSIONS
In this research, we developed a method to find the optimal camera network configuration for the 3D modeling of cultural heritage objects for the purpose of documentation, restoration, conservation, and virtual museums.
We started with a straightforward iterative camera filtering procedure where dense, short base camera network is initially designed according to the imaging standards, which is then filtered, to reach the minimum number of at least three cameras (Fraser, 1989; Luhmann T. et al., 2006) for each point. Then we used the nonlinear constrained optimization techniques, to improve, the positional accuracy of the point cloud by adjusting the camera initial locations and orientation until reaching the desired accuracy.
We tested two cases of a facade and a statue, and the tests indicated a significant reduction in the number of the simulated initial dense camera networks. In the first case of the facade, the cameras reduced from 32 to 12 and in the statue case, the 50 cameras reduced to 19 as shown in Figure 7 and Figure 9. This strategy is beneficial to have a higher covered imaging configuration with a minimum number of short base cameras. Consequently, it is shown in Table 1 that the accuracy is degraded from (9mm) to (38mm) and from (.9mm) to (1.6mm) in the two case studies respectively.
It can be seen that the proposed model indeed improved this deteriorated accuracy after filtration by using optimization techniques, which gives, an improved point cloud accuracy and average coverage as shown in Table 1. The error in the first experiment was 8 mm and in the second experiment was 1mm, which is complying with the required accuracy of 10mm, and 1 mm respectively.
Conversely, there are few limitations in this proposed technique, which is first; the created point cloud derived from video stream images, which might be a costly operation. Secondly, the technique is also depending on the efficiency of the optimization algorithm, which is also a time consuming processing technique. Occlusions between the camera and the object like trees beside the buildings are also not considered in this research.
Future work will focus on designing a guiding system for the actual, high-resolution image acquisition at estimated camera locations and attitudes. Ultimately, the development of the optimal camera network will contribute to an improvement of the image processing steps necessary for the high-resolution images. Not only, the search space for corresponding image points will be reduced because of the knowledge on initial camera location; also better approximations for bundle adjustment are offered, making that step faster and more reliable compared to the case when no prior information is available.
REFERENCES
Barazzetti, L., Scaioni, M., Remondino, F., 2010. Orientation and 3D modelling from markerless terrestrial images: combining accuracy with automation. The Photogrammetric Record 25, pp.356-381
.
Byrd, R.H., Hribar, M.E., Nocedal, J., 1999. An Interior Point Algorithm for Large-Scale Nonlinear Programming. SIAM J. on Optimization 9, pp.877-900
.
Curtis, F.E., 2011. A Penalty-Interior-Point Algorithm for Nonlinear Constrained Optimization. Mathematical Programming Computation
.
Dellaert, F., Seitz, S., Thorpe, C.E., Thrun, S., 2000. Structure fromMotion without Correspondence, IEEE Computer Society Conference on Computer Vision and Pattern Recognition ( CVPR'00 ).
Fraser, C.S., 1984. Network Design Considerations for Non-Topographic Photogrammetry. Photogrammetric Engineering & Remote Sensing 50, pp.1115-1126
.
Fraser, C.S., 1989. Non Topographic Photogrammetry, 2nd edition ed. Edwards Brothers Inc.
Grafarend, E.W., Sanso, F., 1985. Optimization and Design of Geodetic Networks. Springer-Verlag.
Haala, N., 2011. Multiray Photogrammetry and Dense Image Matching, Photogrammetric Week 2011, Wichmann Verlag, Berlin/Offenbach, pp. 185-195.
Kiamehr, R., 2003. Multi Object Optimization of Geodetic Network, Proc. NCC Geomatics 82 conferences, Tehran, Iran. Mason, S., 1995. Expert system- Based Design of Close-Range Photogrammetric Networks. ISPRS Journal of Photogrammetry & Remote Sensing 50, pp.13-24
.
Mason, S., 1997. Heuristic Reasoning Strategy for Automated Sensor Placement. Photogrammetric Engineering & Remote Sensing 63, pp.1093-1102
.
Matlab, 2010. Optimiztion Toolbox User’s Guide Mathworks Inc.
Matthews, N.A., 2008. Aerial and Close-Range Photogrammetric Technology: Providing Resource Documentation, Interpretation, and Preservation, Technical notes 428 U.S. Department of the Interior,Bureau of Land Management, Denver, Colorado p. 42.
Meshlab, 2010. Visual Computing Lab - ISTI - CNR.
http://meshlab.sourceforge.net/.
Olague, G., 2002. Automated Photogrammetric Network Design Using Genetic Algorithms. Photogrammetric Engineering & Remote Sensing 68, pp.423-431
.
Olague, G., Dunn, E., 2007. Development of a Practical Photogrammetric Network Design Using Evolutionary Computing. The Photogrammetric Record 22, pp.22-38
.
Quan, L., 2010. Image-Based Modeling. Springer Science Business Media.
Rao, S.S., 2009. Engineering Optimization: Theory and Practice, fourth ed. John Wiley & Sons, Inc., Canada.
Remondino, F., El-Hakim, S.F., Greun, A., Zhang, L., 2008. Turning Images into 3-D Models IEEE Signal Processing Magazine 25, pp.55-64
.
Saadatseresht, M., Samadzadegan, F., Azizi, A., 2005. Automatic Camera Placement in Vision Metrology Based on a Fuzzy Inference System. Photogrammetric Engineering & Remote Sensing 71, pp.1375-1385
.
Vicon, 2010. Boujou, in: Systems, V.M. (Ed.).