HIGH RESOLUTION DEFORMATION TIME SERIES ESTIMATION FOR
DISTRIBUTED SCATTERERS USING TERRASAR-X DATA
Kanika Goel, Nico Adam
Remote Sensing Technology Institute (IMF), Germany German Aerospace Center (DLR), Oberpfaffenhofen, 82234- Wessling, Germany. Email: [email protected], Phone: +49-8153-28-1233, Fax: +49-8153-28-1420.
Commission VII, WG VII/2
KEY WORDS: Deformation Time Series, Differential SAR Interferometry, Distributed Scatterer (DS), High Resolution SAR, TerraSAR-X.
ABSTRACT:
In recent years, several SAR satellites such as TerraSAR-X, COSMO-SkyMed and Radarsat-2 have been launched. These satellites provide high resolution data suitable for sophisticated interferometric applications. With shorter repeat cycles, smaller orbital tubes and higher bandwidth of the satellites; deformation time series analysis of distributed scatterers (DSs) is now supported by a practical data basis. Techniques for exploiting DSs in non-urban (rural) areas include the Small Baseline Subset Algorithm (SBAS). However, it involves spatial phase unwrapping, and phase unwrapping errors are typically encountered in rural areas and are difficult to detect. In addition, the SBAS technique involves a rectangular multilooking of the differential interferograms to reduce phase noise, resulting in a loss of resolution and superposition of different objects on ground. In this paper, we introduce a new approach for deformation monitoring with a focus on DSs, wherein, there is no need to unwrap the differential interferograms and the deformation is mapped at object resolution. It is based on a robust object adaptive parameter estimation using single look differential interferograms, where, the local tilts of deformation velocity and local slopes of residual DEM in range and azimuth directions are estimated. We present here the technical details and a processing example of this newly developed algorithm.
1. INTRODUCTION
Various differential SAR interferometric stacking techniques have been developed that exploit phase stable i.e. persistent scatterers (PSs). PS interferometry provides a parametric estimation of the displacement and 3D location based on the assumption of one or two dominant scatterers in the resolution cell (Ferretti et al., 2000, Ferretti et al., 2001, Kampes, 2006, Adam et al., 2008). However, it has some limitations in non-urban (rural) areas due to low density of PSs, their inhomogenous spatial distribution, phase ambiguities and atmospheric effects. There is an increasing focus on utilizing distributed scatterers (DSs) to extract geophysical parameters of interest (i.e. LOS deformation and DEM error) for surfaces characterized by fields, forests, soil and rock surfaces. Application examples include mines, volcanoes, oil/gas/water reservoirs and seismic zones. Distributing scattering mechanism involves a coherent sum of many independent small scatterers (no dominant scatterer) within a resolution cell (Goodman, 1976). Techniques such as the Small Baseline Subset Algorithm (SBAS) and SqueeSAR have been proposed to process DSs.
SBAS makes use of spatially unwrapped small baseline differential interferograms (Berardino et al., 2002, Mora et al., 2003). These are linked using the Singular Value Decomposition (SVD) method and a minimum-norm least squares (LS) solution is obtained (Golub and Loan, 1996). Essentially, the phase is averaged in an estimation window to reduce the phase noise (Zebker and Villasenor, 1992). However, the drawback of the straightforward rectangular estimation window is a loss of resolution and a superposition of different objects on ground. In addition, phase unwrapping (Constantini, 1998, Eineder et al., 1998) is an important step in SBAS and phase unwrapping errors are often encountered in
natural terrains. There might be several decorrelated areas (e.g. trees, soil, water etc.) separating the coherent patches and the relative values in the different coherent patches can have unknown integer multiples of 2
π
phase offsets.SqueeSAR, on the other hand, makes use of all possible interferograms and employs an adaptive spatial multilooking to reduce the phase noise and estimate the covariance matrix for each DS (Ferretti et al., 2011, Zan et al., 2008). Afterwards, a phase triangulation algorithm is applied to each DS to retrieve the optimized phase values for the SAR images. The DSs are then processed jointly with the PSs using the traditional PS interferometric chain. However, this technique can be computationally expensive.
With respect to the above-mentioned techniques, we have developed and implemented an alternative method for high resolution deformation monitoring of DSs. The proposed method performs an object adaptive parameter estimation which is based on two principles. First, the high resolution of satellites such as TerraSAR-X leads to many resolution cells covering a homogenous object in non-urban areas. This object can be described by a single deformation parameter. The object’s area (pixels) thus needs to be identified for an optimal estimation of the model parameter, namely, the LOS deformation velocity. Second, we just concentrate on small baseline differential interferograms to reduce the effects of topography on the DSs, and mainly to reduce the computational complexity.
Practically, the algorithm involves the identification of the object’s area (pixels) by a similarity test algorithm using a stack of SAR amplitude images (Parizzi and Brcic, 2011). The differential interferometric phase values of the object’s pixels (calibrated with respect to a reference pixel which lies within the object boundary, so that, the atmospheric effects and orbital
errors are cancelled out) are then exploited for parameter estimation using a search algorithm in the solution space. For each object patch, a periodogram approach is applied in the spatial domain (object area) and time domain (small baseline differential interferometric stack) for a robust estimation of the local tilts of displacement velocity and local slopes of residual DEM in range and azimuth directions with respect to the reference pixel. Finally, since the independent estimated neighboring patches are close and deformation is assumed to be smooth, a 2D-model-deformation integration can be performed to get the absolute deformation. The new concept with respect to the existing algorithms is that there is no need for spatial phase unwrapping and the deformation time series is estimated at full resolution. Even in the presence of high phase noise, the algorithm compensates DEM errors and additionally, atmospheric artifacts are removed automatically for each patch as the phase values are referred to one pixel within the patch. Objective of this paper is to present the developed algorithm and demonstrate it using TerraSAR-X high resolution spotlight data of Lueneburg in Germany.
2. METHODOLOGY
Assuming that we have N SAR images and M single look small baseline differential interferograms available, the implemented methodology for deformation estimation of DSs involves the following steps:
2.1 Identification of Homogenous Patches
We start with the identification of independent homogenous patches using a stack of coregistered and calibrated SAR amplitude images. These statistically homogenous patches are dependent on the reflectivity, have typically a constant local slope and clear boundaries (e.g. fields, roads etc.).
Various statistical tests have been proposed in recent years to identify homogenous pixels based on the amplitude of coregistered and calibrated stack of SAR images. These include the Kullback-Leibler Divergence test (Bishop, 2006), the Kolmogorov-Smirnov (KS) test (Papoulis and Pillai, 1984) (used in the SqueeSAR approach (Ferretti et al., 2011)) and the Anderson-Darling (AD) test (Pettitt, 1976). The AD test has been proven to be the most effective statistical test to identify if two pixels arise from the same distribution (Parizzi and Brcic, 2011). It is a non-parametric test i.e. we do not assume that the
samples belong to a defined probability distribution. Instead, using the amplitude of the stack of SAR images, we obtain the empirical cumulative distribution functions of amplitudes for the two pixels (points) under consideration. The distance between the distributions, with weighting given to tails (higher order moments of the distribution are taken into consideration), tells us if the two points statistically arise from the same distribution. For a set of points a and b, the AD statistic A2 is:
[
]
(
)
[
]
∑
⋅
−
−
=
)
( , ,
2 2
,
(
)
1
(
)
)
(
)
(
2
F x ab abb a
b
a
F
x
F
x
x
F
x
F
N
A
(1)where, N is the number of SAR amplitude images, Fa(x) and
) (x
Fb are empirical cumulative distribution functions of
amplitudes x for points a and b, Fa,b(x) is empirical
distribution function of the pooled distribution
[ ]
a,b . If the AD statistic is less than a threshold value, the two pixels are assumed to belong to the same homogenous area.In this step, we divide the area into rectangular blocks. The block size is chosen in such a way that the atmosphere is mitigated if we subtract the phase of the reference pixel from the phases of the other pixels in the block, and also considering that the patch size should be large enough to provide us with a reliable estimation. Then, within each rectangular block, homogenous patch pixels are identified based on a certain criterion which gives us the best possible estimate of the DS inside the block. In practice, the estimation takes advantage of large homogenous areas. It is based on the fact that the large number of samples improves the precision and the large spatial extension increases the sensitivity of the estimation. This is the reason that we consider a minimum patch size. Also, the average coherence of the patch should be larger than a certain threshold. The coherence of the pixels can be calculated using an adaptive multilooking algorithm (Parizzi and Brcic, 2011, Goel and Adam, 2011a). For each detected patch, a reference pixel is selected. Fig. 1 shows an example of the identification of homogenous patches for a small region in the town of Lueneburg in Germany. 17 TerraSAR-X images (high resolution spotlight mode) of the test site from 2010-2011 were used. In this demonstration, the region was divided into blocks of 40 × 40 pixels. A minimum patch size of 20 pixels and a coherence threshold of 0.3 was applied.
(a) (b) (c)
Figure 1: Identification of homogenous patches. (a) is a Google Earth image of a small part of Lueneburg in Germany, the region of interest is enclosed in red. (b) is the mean amplitude image of the region of interest. (c) shows the division of the region into blocks by the blue lines, wherein, the points in green represent the homogenous pixels and the points in red represent the reference pixels.
2.2 Tilt and Slope Estimation
The single look small baseline differential interferograms can now be exploited for estimation of tilts of deformation velocity and slopes of residual DEM for each patch with respect to the reference pixel of that patch. First, the phase values of each patch are corrected with respect to the reference pixel so that the atmospheric effects and orbital errors are negligible. Second, these are then used for parameter estimation using a 4D periodogram.
For each object patch, to estimate the local tilts of deformation velocity
m in range and azimuth directions resp. (in
mm/year/pixel) and the local slopes of residual DEM
x
h
m and
y
h
m in range and azimuth directions resp. (in m/pixel), M
periodograms are generated in spatial domain from the
(
M*L)
interferometric phase values of the patch, where L is the number of homogenous pixels. A periodogramξ
k,k=1,...,M, is a function of the local tilts of deformation velocity and local slopes of residual DEM for the object patch:∑
where, L is the number of homogenous pixels for the patch,
k i,
φ
is the single look interferometric phase for homogenous pixel i and interferogram k, Tk is the velocity conversionfactor for interferogram k, Bk is the height conversion factor for interferogram k,
m are local tilts of deformation
velocity in range and azimuth directions resp. (in mm/year/pixel),
m are local slopes of residual DEM
in range and azimuth directions resp. (in m/pixel), i x
p and i y
p
are pixel indices in range and azimuth directions resp. for homogenous pixel i. The velocity conversion factor for an interferogram k is given by: baseline for interferogram k. The height conversion factor for an interferogram k is given by:
⊥ is the perpendicular baseline for interferogram k,
R is the sensor-target distance,
θ
is the local incidence angle (for flat terrain).Further on, we make the parameter estimation robust by averaging all the periodograms for a patch to reduce side lobes. We finally get an averaged periodogram ξ as follows:
∑
The local tilts of the deformation velocity
x
are estimated from the peak of the averaged periodogram i.e.:
( )
ξ
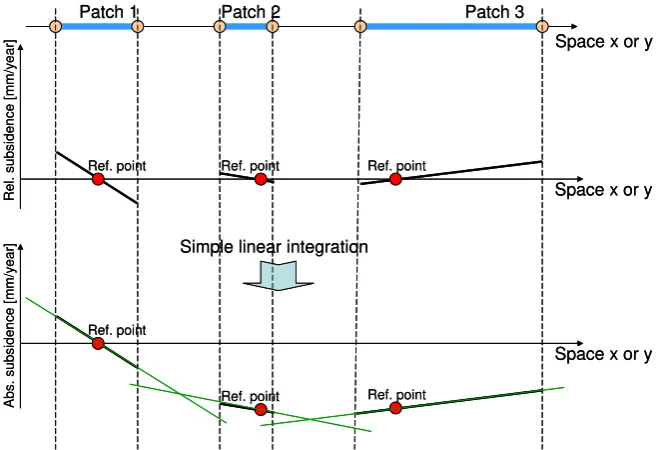
Since the independent estimated neighboring patches are close and deformation is assumed to be smooth, a 2D-model-deformation integration can finally be performed to get the absolute deformation. A simple 1D case is shown in Fig. 2.
Space x or y
Patch 1 Patch 2 Patch 3
Re Ref. point Ref. point Ref. point
A
Ref. point Ref. point Simple linear integration
Space x or y
Patch 1 Patch 2 Patch 3
Re Ref. point Ref. point Ref. point
A
Ref. point Ref. point Simple linear integration
Figure 2: A simple 1D example of integrating the relative deformation of the various patches to get the absolute values.
(a) (b) (c)
Figure 3: Identification of homogenous patches for a part of Lueneburg which has deformed highly in the considered time period. (a) is a Google Earth image of a small part of Lueneburg in Germany, the region of interest is enclosed in red. (b) is the mean amplitude
image of the region of interest. (c) shows the homogenous pixels in green and the reference pixels in red.
3. APPLICATION TEST CASE AND RESULTS
The town of Lueneburg in Germany has been used to demonstrate our technique. It is situated in the German state of Lower Saxony. The old part of this town lies on a salt dome. As a result of constant salt mining dating back to the 19th century, various areas of the town have experienced a gradual or high subsidence, became unstable and had to be demolished. The sinking still continues even today. Many ground stations have been established since 1946 to monitor the deformation, but due to the changing subsidence patterns and locations, space-borne differential SAR interferometric technique is better suited for deformation mapping of Lueneburg (Goel et al., 2011).
We used 17 high resolution spotlight TerraSAR-X images of Lueneburg from October, 2010 to September, 2011 with a look angle of 29.6 degrees and ‘HH’ polarization. We generated 89 small baseline differential interferograms. Fig. 3 shows the
identification of homogenous patches for a part of Lueneburg which has deformed highly in the considered time period. In Fig. 4, we present deformation estimation results for this region using a different approach so that we can compare the new technique with them. The approach which we used for comparison is object adaptive phase filtering, followed by an L1 norm based SBAS technique (Goel and Adam, 2011b).
Fig. 5 shows the preliminary tilt estimation results for the deformation velocity in range and azimuth directions in mm/year/pixel using the newly developed technique. We can see that the results compare well with the SBAS results. Fig. 6 shows the preliminary slope estimation results for the residual DEM in range and azimuth directions in m/pixel. The comparison of the results with ground truth data is foreseen in the future. We are in contact with the local government of Lueneburg for the levelling data.
42 mm
-42 mm -0.5 -0.5
0.5 0.5
42 mm
-42 mm 42 mm
-42 mm -0.5 -0.5
0.5 0.5
(a) (b) (c)
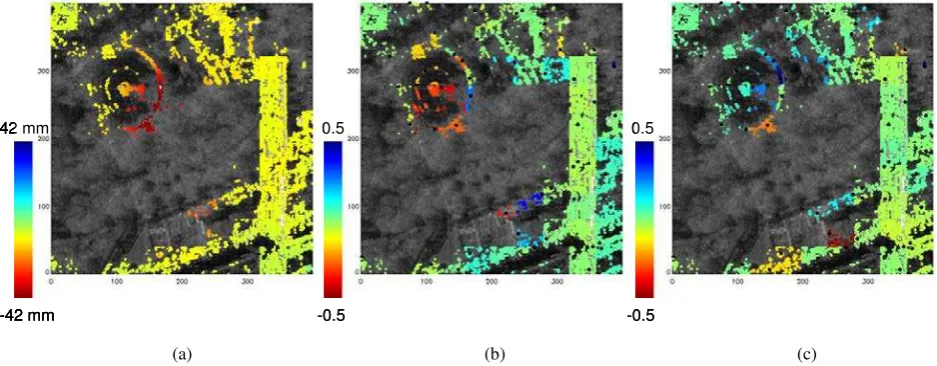
Figure 4: Deformation estimation results using a different approach (adaptive spatial phase filtering and L1 based SBAS technique). (a) The total deformation in mm. (b) Local tilts of deformation velocity in range (x) direction in mm/year/pixel calculated from (a).
(c) Local tilts of deformation velocity in azimuth (y) direction in mm/year/pixel calculated from (a).
-0.5 -0.5
0.5 0.5
-0.5 -0.5
0.5 0.5
(a) (b)
Figure 5: Deformation estimation results using the newly developed technique. (a) Estimates of local tilts of deformation velocity in range (x) direction in mm/year/pixel. (b) Estimates of local tilts of deformation velocity in azimuth (y) direction in mm/year/pixel.
1 1
1 1
1 1
1 1
(a) (b)
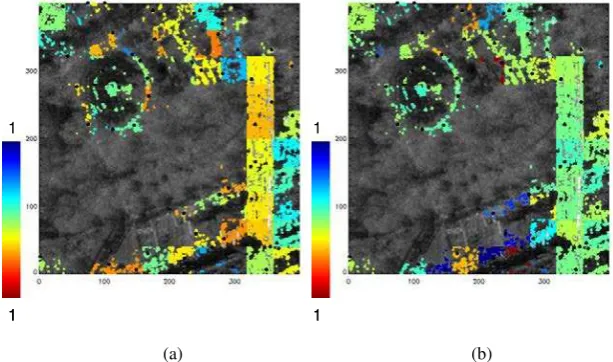
Figure 6: Residual DEM estimation results using the newly developed technique. (a) Estimates of local slopes of residual DEM in range (x) direction in m/pixel. (b) Estimates of local slopes of residual DEM in azimuth (y) direction in m/pixel.
4. CONCLUSION
A new concept has been developed to estimate deformation of DSs at full resolution without any phase unwrapping. Even in the presence of high phase noise, the algorithm compensates DEM errors and additionally, atmospheric artifacts are removed automatically for each patch as the phase values are referred to one pixel within the patch. A demonstration has been provided using TerraSAR-X data of Lueneburg in Germany. Future work will concentrate on network inversion algorithms to retrieve the absolute LOS deformation velocities and residual DEM.
REFERENCES
Adam, N., Eineder, M., Yague-Martinez, N. & Bamler, R., 2008. High resolution interferometric stacking with TerraSAR-X. In: Proc. Intl. Geosci. Rem. Sens. Symp. (IGARSS), Boston.
Berardino, P., Fornaro, G., Lanari, R. & Sansosti, E., 2002. A new algorithm for surface deformation monitoring based on
small baseline differential SAR interferograms. IEEE TGRS, vol. 40, no. 11, p. 2375.
Bishop, C. M., 2006. Pattern recognition and machine learning. Springer, New York.
Constantini, M., 1998. A novel phase unwrapping method based on network programming. IEEE TGRS, vol. 36, no. 3, pp. 813-821.
Eineder, M., Hubig, M. & Milcke, B., 1998. Unwrapping large interferograms using the minimum cost flow algorithm. In: Proc. IGARSS, Seattle.
Ferretti, A., Prati, C. & Rocca, F., 2000. Nonlinear subsidence rate estimation using permanent scatterers in differential SAR interferometry. IEEE TGRS, vol. 38, no. 5, pp. 2202–2212.
Ferretti, A., Prati, C. & Rocca, F., 2001. Permanent scatterers in SAR interferometry. IEEE TGARS, vol. 39, No. 1, pp. 8-20.
Ferretti, A., Fumagalli, A., Novali, F., Prati, C., Rocca, F. & Rucci, A., 2011. A New Algorithm for Processing Interferometric Data-Stacks: SqueeSAR. IEEE TGRS, vol. 49, no. 9, p. 3460.
Goel, K. & Adam, N., 2011a. High resolution differential interferometric stacking via adaptive spatial phase filtering. In: Proc. IGARSS, Vancouver, Canada.
Goel, K. & Adam, N., 2011b. Deformation estimation in non-urban areas exploiting high resolution SAR data. In: Proc. FRINGE, Frascati, Italy.
Goel, K., Parizzi, A. & Adam, N., 2011. Salt mining induced subsidence mapping of Lueneburg (Germany) using PSI and SBAS techniques exploiting ERS and TerraSAR-X data. In: Proc. FRINGE, Frascati, Italy.
Goodman, J. W., 1976. Some fundamental properties of speckle. J. Opt. Soc. Am. A, vol. 66, no. 11, pp. 1145–1150.
Golub, G. & Loan, C., 1996. Matrix Computations, 3rd ed. Baltimore: John Hopkins University Press.
Kampes, B. M., 2006. Radar Interferometry - Persistent Scatterer Technique. Springer.
Mora, O., Mallorqui, J.J., Broquetas, A., 2003. Linear and nonlinear terrain deformation maps from a reduced set of interferometric SAR images. IEEE TGRS, vol. 41, no. 10, p. 2243.
Papoulis, A. & Pillai, S. U., 1984. Probability, random variables, and stochastic processes. Second Edition, McGraw-Hill, New York.
Parizzi A. & Brcic, R., 2011. Adaptive InSAR stacks multilooking exploiting amplitude statistics: A comparison between different techniques and practical results. IEEEGRSL, vol. 8, no. 3.
Pettitt, A. N., 1976. A two-sample Anderson–Darling rank statistic. Biometrika, vol. 63, no. 1, pp. 161–168.
Zan, F. D., 2008. Optimizing SAR interferometry for decorrelating scatterers. Doctoral dissertation, Politecnico di Milano, Italy.
Zebker, H. A. & Villasenor, J., 1992. Decorrelation in interferometric radar echoes. IEEE TGRS, vol. 30, no. 5, pp. 950–959.