IJG Vol. 48 No.1, June 2016 (47 - 53) © 2016 Faculty of Geography UGM and he Indonesian Geographers Association
Groundwater Salinity Distribution in Sub-District Kedung,
District Jepara
Ilham Erie Maulana and Sudarmadji
Received: 24 10 2015 / Accepted: 15 01 2016 / Published online: 30 06 2016 © 2016 Faculty of Geography UGM and he Indonesian Geographers Association
Abstract he groundwater salinity in Kedung Sub-district, near the coastal area, is the result of the salt water that comes into the aquifers and the salt water seepage from the surface. he broad groundwater salinity is because of the recent land condition that is resulted from the deposition in the ocean. he nature of the groundwater in-Sub-distric from all aquifers consists of 14% saline groundwater, 48% brackish groundwater and 38% fresh water. he number of community that has brackish until saline ground water property is 19.202 people, so that the domestic water need for the community is 1.344.378 liters/day. Such environmental condition makes the residents make some adaptation. he adaptation of the land use aspect is by making the western region as a ishponds region and the eastern one as a rice ields region. Adapta-tion in community activities is to fulill the needs by working as farmers (on the rice ields, ish ponds or salt ponds) or as the ishermen. Adaptation is also made to minimize the threat of disasters, such as the manufacture of levees, weirs or dams and diversions to prevent the spread of tidal looding.
Abstrak Salinitas airtanah di Kecamatan Kedung disebabkan dua aspek yaitu air laut yang menerobos masuk ke akuifer
dan rembesan air asin dari permukaan. material tanah yang berupa lempung menjadikan tingginya akumulasi garam dalam tanah sehingga salinitas airtanah semakin tinggi. Sifat airtanah di Kedung dari seluruh akuifer adalah 14 % berupa airtanah asain, airtanah payau 48 % dan air tawar 38%. Airtanah tawar mayoritas berada pada akuifer dengan formasi batuan tufa Muria. Kondisi ini menjadikan manusia akan beradaptasi kondisi alam tempat tinggalnya. Wujud adaptasi dari aspek pemanfaatan lahan adalah dengan menjadikan Kecamatan Kedung bagian barat sebagai tambak dan bagian timur sebagai sawah. Adaptasi dalam kegiatan masyarakat untuk memenuhi kebutuhan yaitu dengan bekerja sebagai petani (sawah, tambak ikan atau tambak garam) ataupun nelayan. Adaptasi juga dilakukan untuk meminimalisir an-caman bencana di daerah tersebut, seperti pembuatan tanggul, bendung ataupun bendungan dan sudetan untuk mencegah meluasnya banjir rob.
Keywords: Groundwater, Aquifer, Salinity, Adaptation
Kata kunci: Air tanah, Akuifer, Salinitas, Adaptasi
1.Introduction
Water is a natural resource that has a very important role for life on Earth [Todd & Mays, 2005]. Of total amount of water on earth, the percentage of 0.001% for atmospheric ; 99,374% for the surface water while the ground water is 0.625% [Nace, 1960 and Feth 1973 in [Bower, 1978]. Although the groundwater has only a very small percentage but the experts believe that 96% of fresh water (except for the face in the geographical poles) is in the form of groundwater [Purnama, 2010]. Indonesia, as a tropical country with high rainfall, makes the groundwater gets a do you mean use:a large supplay supply. Even the water surface, according to the experts, has 30% of its supply comes from the groundwater [Indarto, 2010]. his makes most of the Indonesian population use the groundwater as the clean water source, especially for domestic needs [Notodarmojo, 2005].
Ilham Erie Maulana and Sudarmadji
Faculty of Geography, Universitas Gadjah Mada, Indonesia Email: [email protected]
Indonesia has some cities in coastal areas growing rapidly such as Surabaya, Semarang and Jakarta. regarded from the development of the region, it is certainly positive in terms of the economy. But when it is not accompanied by a good environmental management, it would be detrimental, because there would be a lot of excessive exploitations on the nature. As example Semarang in Semarang that has mostly groundwater is already salty or brackish with the increase of salt water level due to climate change [Rahmawati dan Marfai, 2013].
on how the eforts of communities to adapt to the natural conditions in their residence.
he objectives of the research are as follows:
1. To ind the extent of groundwater salinity in Kedung Sub-district
2. To calculate the domestic water needs of community who gets the impact of groundwater salinity in Kedung Sub-district
3. To observe the adaptation of the community to the natural conditions in Kedung Sub-district .
2. he Methods
Instruments and Materials
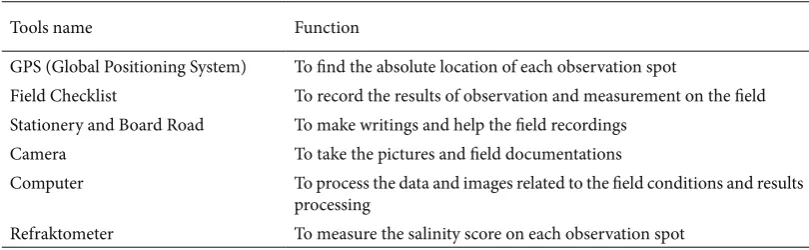
his research is related to the intrusion in the aquifer which was conducted in Kedung Sub-district, Jepara regency, by using several instruments, as shown in Table 3.1. he instruments used in this study are used in the majority of ield activities. An instrument used during the pre- and post- ield stages is only a laptop that is used for analyzing and processing of the results of ield activities.
This study also uses some of the materials in the preparation, , and also data analysis. he materials used in this phase were RBI, geological, and also hydrogeological maps as the basis in the description of research area in general as well as consideration in results analysis. he materials used to develop results were the population data, satellite images and the ield measurements data. From the results of data processing, this research would be the material in the analysis of the problems.
Time and Location of the Research
he research related to the salinity on the aquifer was conducted in the Kedung Sub-district, Jepara Regency. he restriction of the research area was using the administrative restriction as it will simplify the local governments’s spatial planning and management as well as policy making. he research was conducted in May-June 2015
In terms of the physical condition of the research area that is similar to the coastal area of Semarang and Demak that has been published to have a high salinity score in the aquifer also becomes the basis for the choice
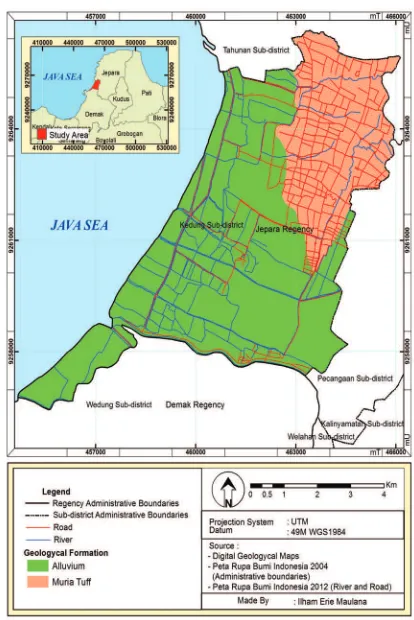
of location. In addition, globally, in the hydrogeological map most of the area of Kedung Sub-district is the area of saline/brackish groundwater with various productivities, as shown in Figure 1. It is expected that this research can be seen with the physical condition of the aquifer on the chemical pollution related to the ground water salinity. he picture of the research area condition can be seen in Figure 2. Figure 2 is a geologic map which is also the basis for the division of the study area
Research Procedure
he data collection technique used in this research is the ield survey with purposive random sampling method. he sampling method is conducted by dividing the research area into two rock formations, alluvium and tufa muria as shown in Figure 2. he sampling method is more focused on the alluvium formation since it is a free aquifer and directly adjacent to the sea. he population of this research is the existing wells in rock formations in Kedung Sub-district. he primary data obtained from this sampling are the data of salinity and observation location coordinates. his research does not only conduct the ield survey, but also collect the secondary data collection as the data collection technique.
Both primary and secondary data collected will be processed. he secondary data such as RBI map, images and population data are used as one of the interpretation aspects of the community adaptation. he data processing of the results of ield surveys is visualized in ArcGIS application. he method used is the kriging interpolation method which produces a contour map of groundwater salinity score (isohaline). he next stage is To classify the salinity score based on Table 2, the salinity level of the groundwater, which is also classiied as properties of groundwater salinity. Based on these classiications, . the amount of domestic water needs of the community,except the fresh groundwater, can be calculated.
he next result is determining the domestic water needs of the community, based on the number of people who get the impact from the groundwater salinity. he method used for determination of the total population of each residential area is the weighted balance method.
Table 1. List of he Tools Used in he Study
Tools name Function
GPS (Global Positioning System) To ind the absolute location of each observation spot
Field Checklist To record the results of observation and measurement on the ield
Stationery and Board Road To make writings and help the ield recordings
Camera To take the pictures and ield documentations
Computer To process the data and images related to the ield conditions and results processing
he consideration of using this method is that it can be used to calculate the number of residents in a particular area, by assuming that the distribution of the population is uniform. he residents in the administrative unit are afected by salinity diferently, so this equation is used. he equation of weighted balance is formulated as Equation 1. his equation is only used when there is a village has a residential with various groundwater conditions (saline and non-saline).
Information :
X : Total residents in each residential area ∑x: Total population
A : he calculated residential area ∑A: Total residential area
he data analysis performed in this study is related to the physical properties of groundwater and adaptations of the community. he physical properties of the analyzed groundwater is salinity. he data analysis were conducted descriptively and graphically. he graphical analysis of the data was presented in the form of photos, maps, diagrams and tables. he presentation in the form of pictures (photos) was to indicate the condition of the ield, while the maps were used to show the distribution of groundwater salinity. he presentation in the form of tables was for the afected area data which were also visualized in the form of diagrams. At the analysis stage, data will be described related to the general research
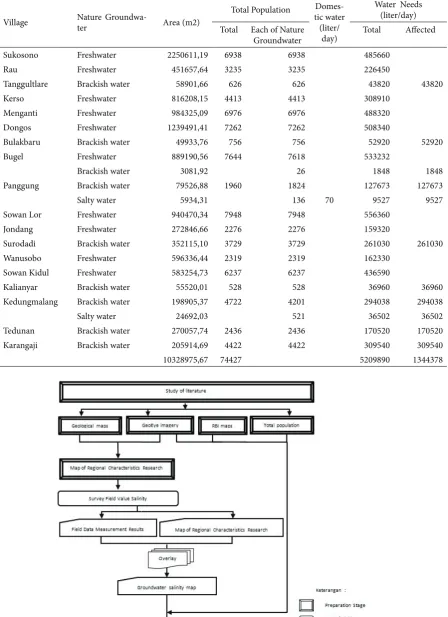
environment conditions and the analysis related to the presentation of data in a graphical form. Graphically, the stages of research are shown in Figure 3.
3. Result and Discussion
he increase of the salinity score in the groundwater is caused by the presence of pollutants that enter and mix with the fresh groundwater [Todd & Mays, 2005]. In its natural state, the groundwater in coastal areas will not mix with the saltwater as in the Geyben-Herzberg Law. his law states that in a meeting between the fresh groundwater with saltwater in coastal aquifers will form the intrerface (boundary) [Musnawir, 2001 dalam Indahwati, Muryani, & Wijayanti, 2012]. he formation of interface is due to the diference in density between the saltwater (1.025 g / cm3) with fresh water (1.000 g / cm3) [Purnama, 2010; Todd & Mays, 2005].
Reviewing from the hydrogeological condition, Kedung Sub-district has fresh, brackish, until saline groundwater. Kedung Sub-district has two geological namely , alluvium and tufa muria as shown in Figure 2. he salinity of groundwater is assessed through measuring of salinity in wells and drilling in the coastal area. he ield measurementswere conducted in an area with clay soil material in alluvium rock formations which is a free aquifer directly adjacent to the sea. he morphology of Sub-district which is sloping and has a clay material becomes one of the factors causing the
Figure 1. Hydrogeological map of Kedung Sub-District. Source : Hydrogeological map of Indonesia sheed VII
Semarang (Java)
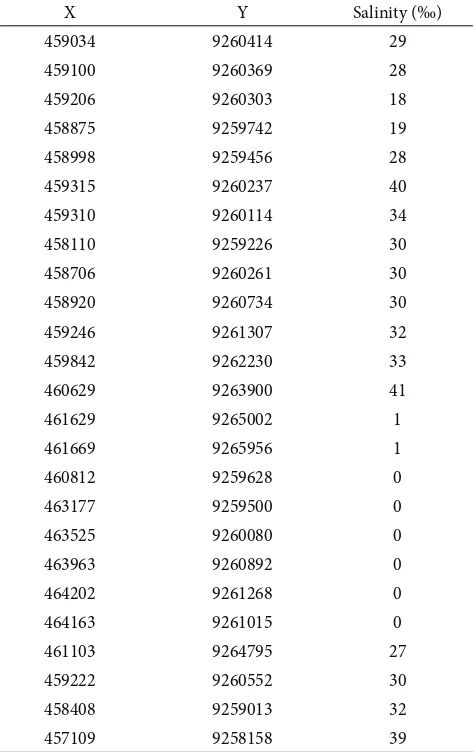
high salinity in the groundwater. he salinity tests were performed in 25 observation points in Kedung Sub-district, as shown in Table 3.
he results of measurements of salinity then were to be processed to produce a map of groundwater salinity as shown in Figure 4. he salinity of groundwater in Sub-district is not only from the result of intrusion, but also from the seepage of the rest tidal lood and by the land formation due to the sedimentation in the sea. he high salinity score in the groundwater in coastal area of Sub-district can be caused by two aspects, such as the salinity of the salt water and the accumulation ofsalt sediment. he salinity of salt water in Jepara conducted in Panjang Island (± 1.6 km from the coast) is relatively high at between 30‰ to 46‰ [Rudiyanti, 2011]. he clay soil material in the coastal area of Sub-districtwill strongly bind the salt water. his results in the high accumulation of salt in the soil. he topography of lat alluvium formation widen the tidal looding which impacts on the wider saline or brackish groundwater. he determination of the groundwater property is
described in Figure 4, derived from the classiication of isohaline based on Table 2. Almost the half of groundwater in the Kedung Sub-district is the brackish water, as shown in Table 4, whereas most of the fresh water is in Tufa Muria Formation.
he domestic water need is the volume of water needed to meet the daily needs. he daily water needs which are included to the domestic needs include: water needs for bathing, washing (clothes and dishes), cooking and drinking. he determination of the domestic water needs in this research is based on the results of interviews with the local residents. he results of calculation of the domestic water needs are obtained from interviews which are later compared to the volume of domestic water needs according to SNI 19-6728.1-2002. he domestic water needs according to SNI is used as a comparison to calculate the water needs in more detail with more samples so he description is more general. It is in order to avoid a signiicant deviation from the volume of domestic water needs.
he determination of the afected population Table 3. Results of Groundwater Salinity Measurements
X Y Salinity (‰)
459034 9260414 29
459100 9260369 28
459206 9260303 18
458875 9259742 19
458998 9259456 28
459315 9260237 40
459310 9260114 34
458110 9259226 30
458706 9260261 30
458920 9260734 30
459246 9261307 32
459842 9262230 33
460629 9263900 41
461629 9265002 1
461669 9265956 1
460812 9259628 0
463177 9259500 0
463525 9260080 0
463963 9260892 0
464202 9261268 0
464163 9261015 0
461103 9264795 27
459222 9260552 30
458408 9259013 32
457109 9258158 39
Table 5. Domestic Water Needs Calculation of Population Afected High Salinity Groundwater Values
Village Nature
Groundwa-ter Area (m2)
Total Population Domes-tic water
(liter/ day)
Water Needs (liter/day)
Total Each of Nature Groundwater
Total Afected
Sukosono Freshwater 2250611,19 6938 6938
70
485660
Rau Freshwater 451657,64 3235 3235 226450
Tanggultlare Brackish water 58901,66 626 626 43820 43820
Kerso Freshwater 816208,15 4413 4413 308910
Menganti Freshwater 984325,09 6976 6976 488320
Dongos Freshwater 1239491,41 7262 7262 508340
Bulakbaru Brackish water 49933,76 756 756 52920 52920
Bugel Freshwater 889190,56 7644 7618 533232
Brackish water 3081,92 26 1848 1848
Panggung Brackish water 79526,88 1960 1824 127673 127673
Salty water 5934,31 136 9527 9527
Sowan Lor Freshwater 940470,34 7948 7948 556360
Jondang Freshwater 272846,66 2276 2276 159320
Surodadi Brackish water 352115,10 3729 3729 261030 261030
Wanusobo Freshwater 596336,44 2319 2319 162330
Sowan Kidul Freshwater 583254,73 6237 6237 436590
Kalianyar Brackish water 55520,01 528 528 36960 36960
Kedungmalang Brackish water 198905,37 4722 4201 294038 294038
Salty water 24692,03 521 36502 36502
Tedunan Brackish water 270057,74 2436 2436 170520 170520
Karangaji Brackish water 205914,69 4422 4422 309540 309540
10328975,67 74427 5209890 1344378
Figure 4. Map isohalin and nature of groundwater in Kedung Sub-District, Jepara.
Source: Data processing
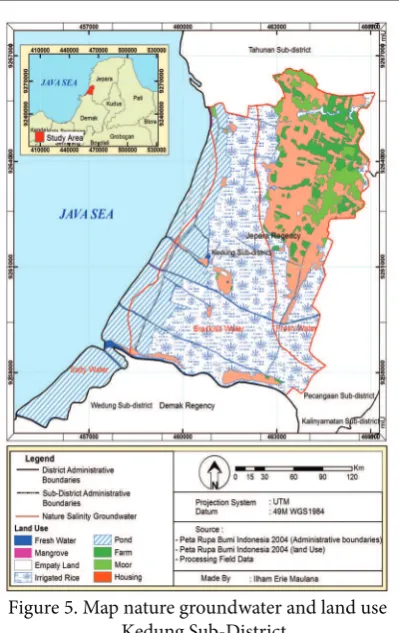
Figure 5. Map nature grounEwater and land use
,Fdung Sub-District.
of ground water with high salinity score is based on the existing residential area. Based on the property of the groundwater and the extent of the residential area will result in the extent of the residential area afected by the salinity of the groundwater. Based on the extent of the afected residential area will result in the number of people afected by the method of weighted balance sheet. he results of the processing of salinity and demographic data can determine volume of domestic water needs of the population afected by the groundwater salinity (Table 5). According to Table 5, the volume of water needed to meet the domestic water needs of the population afected by the intrusion is 1.978.156 liters/day. he water volume is 25.8% of the total volume of domestic water needs of the entire population in Kedung Sub-district.
he natural conditions that have been described previously will certainly afect the adaptation of the community in Kedung Sub-district. he adaptations which are described in this researche are the land use and the community eforts in fulilling their needs. he Manifestation of community spatial adaptation can be seen in Figure 5.
In terms of land utilization, land use (Figure 5) also considers the natural conditions. he irst is the majority of residents which are in Tufa Muria Formation. he selection of the house location in tufa muria formation is very rational because this area has a more stable bedrock (soil material). It is located in a quite high position (>12 mdpal) which makes it safe from the
threat of tidal lood, besides also has an adequate source of fresh water. Residents in alluvium formation require special adaptations. he adaptation are by making a stronger foundation and the soil should be piled higher in order to make the land more stable and to protect from tidal looding. he residential location is also analogous to professions of the community such as in the Southern of Kedung Sub-district in which there are settlements that extend from the west to east. his is because there is a great river in the Southern of Kedung Sub-district,namely. Serang River which bank is used as a port for the ships.
he land utilization in alluvium formation are a ponds area (ish and salt), agriculture (rice ields and farms) in the western and eastern sides as in Figure 8. In the western side, there are many diversions used to drain water into the ponds. he watering of salt ponds also use the ground water pumped by a windmill in the areas with saline ground water. here is also a barrier created in the form of embankment between the ponds and paddy ields to prevent the salt water lows into the ields. here are also barriers and embankments built on both sides, so that when there is a tide looding, the salt water does not low away.
coastal people work as ishermen,as well as ish and salt farmers, people who worked on the rice ields have a house and the rice plants quite far from the coast.
he adaptation is also done in the form of physical development. One of the physical adaptations is manufacturing the embankmet bonth in the banks of the river and along the coast to resist the tidal lood. he efort to minimize the tidal looding is also done by making a lot of diversions. Diversions are also utilized by the community to irrigate the pond with the help of windmills. here is also a weir or dam so that the salt water does not enter too far into the river.
4. Conclusions
1. 48% of the groundwater is brackish and 14% is saline in Kedung Community, which both are on the sloping coastal area.
2. he required water volume needed to fulill the domestic water of the community which has a high salinity on the groundwater (brackish and saline) is 1.244.378 liters/day, equals to ¼ of the total volume of domestic water needs in Kedung Sub-district 3. he majority of adaptation made by the community
is by changing the environmental conditions based on their desires, such as the selecting hose, diversion making, embankment making, and realizing he coastal area as the salt ponds.
References
Bower, H. (1978). Water Resouurces Environmental Engineering (1st ed.). New York: McGraw-Hill inc. Indahwati, N., Muryani, C., & Wijayanti, P. (2012). Studi
Salinitas Airtanah Dangkal Di Kecamatan Ulujami
Kabupaten Pemalang Tahun 2012. UNS Surakarta.
pg.1–11.(in Bahasa Indonesia)
Indarto. (2010). Hidrologi : Dasar Teori dan Contoh Aplikasi Model Hidrologi. Jakarta: Bumi Aksara. (in Bahasa Indonesia)
Notodarmojo, S. (2005). Pencemaran Tanah dan Air
Tanah (1st ed.). Bandung: ITB Press. (in bahasa
indonesia)
Purnama, I. L. S. (2010). Hidrologi Air Tanah (1st ed.).
Yogyakarta: Kanisius. (in bahasa indonesia) Rahmawati, N and Marfai, M. A. (2013). Salinity Pattern
in Semarang Coastal City. Indonesian Journal of Geology. 8(2), 111–120.
Saputra, S. (1998). Telaah Geologi Terhadap Banjir Dan Rob Kawasan Pantai Semarang. Jurnal Ilmu Kelautan. 3(1), 85–92.