Gadjah Mada International Journal of Business January-April 2009, Vol. 11, No. 1, pp. 117–144
FRAUDULENT FINANCIAL STATEMENT
Evidence from Statement on Auditing Standard No. 99
*Suyanto**
The goals of this study are to empirically identify fraud risk factors and construct a model to predict the likelihood of financial statement frauds based on SAS No. 99. Employing logistic regres-sion on 143 firms, this research finds that fraud risk factor proxies for Pressure—net profit/total assets—and Opportunity— inventory/ total assets ratio, related party transactions, and Big 4—are signifi-cantly associated with fraudulent financial statements, whereas none of the fraud risk factor proxies for Rationalization is signifi-cantly associated with fraudulent financial statements. Consistent with prior research, it seems that the likelihood of fraudulent financial statements is easier to be observed publicly using fraud risk factor proxies for Pressure and Opportunity rather than Ratio-nalization. The constructed model can correctly classify firms with a relatively high success rate.
Keywords: financial statement frauds; fraud triangle; fraud risk factors; SAS 99
* Data for this paper come from public sources.
Introduction
In the beginning of the 21st
cen-tury, business world was upset by a series of corporate financial and ac-counting scandals; Enron, WorldCom, and Xerox are just a few companies that daunted public trust and dissi-pated tremendous dollars of market capitalization. Five companies –Enron, WorldCom, Qwest, Tyco, and Global Crossing– and their respective losses on their market capitalization caused by accounting scandals accounted to approximately $460 billion (Cotton 2002). Enron’s loss itself totaled around $70 billion (Rezaee 2005). A financial fraud assessment survey con-ducted by KPMG (2003) finds that 70 percent of the responding companies have experienced at least one type of fraud, increasing by 13 percent com-pared to the results obtained with the same survey in 1998.
These and other series of financial frauds and accounting scandals seem-ingly fostered AICPA to issue the Statement on Auditing Standards (SAS) No. 99, “Consideration of Fraud in a Financial Statement Audit”, in October 2002, which superseded SAS No. 53 (1988) and SAS No. 82 (1997). SAS No. 99 consists of an extensive list of fraud risk indicators. The Stan-dard advocates for auditors to be more cautious in the audit process.
This research intends to identify fraud risk factors stated in SAS No. 99 (AICPA 2002) –perceived Pressure/ Incentive, Opportunity, and Attitude/ Rationalization– and empirically
re-lates those factors to the impending likelihood of financial statement fraud. This study also aims to construct a fraud prediction model to predict the likelihood of financial statement fraud based on the identified fraud risk fac-tors. Financial statement fraud usually involves management because man-agers can directly or indirectly ma-nipulate accounting records and present fraudulent financial informa-tion by overriding controls or direct-ing employees to carry out the fraud. Even though it is difficult to discover fraud (Albrecht et al. 2006), fraudu-lent activities can still be predicted by considering certain conditions.
This research finds that a Pressure proxy variable –net profit/total assets– and Opportunity proxy variables –in-ventory/total assets, related party trans-action (RPTRANS) and Big 4/5 audit firms (BIG4)– are significantly related to the tendency of committing fraud, whereas Rationalization proxy vari-ables are insignificantly related to the likelihood of fraudulent financial state-ment. Rationalization of fraud is ap-parently the most difficult factor among other fraud triangle elements to be observed by public data. Furthermore, the findings include the construction of a fraud prediction model, which accurately predicts fraud with a suc-cess rate up to 67.1 percent. By using cross validation method, this model can correctly classify non-fraudulent firms by 77 percent and fraudulent firms by 51 percent.
Theory and Hypotheses
Development
Fraud detection has become a criti-cal concern of researchers and aca-demics, and this leads them to conduct a myriad of empirical research. Fraud triangle –Pressure, Opportunity, and Rationalization– is a well recognized technique used to examine fraud oc-currences. The fraud triangle was widely introduced by Cressey in 1953 after conducting research on inmates who had been alleged of violation of financial trust. Cressey (1953) argues that a fraud triangle is always present when a fraud occurs. AICPA (2002) has adopted this theory and further
proposes it in SAS No. 99. Based on the proposal, AICPA (2002) claims that only one fraud risk factor needs to be present for the occurrence of fraud. AICPA (2002) defines fraud in SAS No. 99 as an intentional act that results in a material misstatement in financial statements, which are the subject of the audit. The Standard rec-ognizes two types of misstatements pertaining to auditor’s consideration of fraud: (1) misstatement arising from fraudulent financial reporting and (2) misstatement arising from misappro-priation of assets. This study is specifi-cally focused on fraudulent financial reporting. SAS No. 99 (AICPA 2002) defines fraudulent financial reporting as intentional misstatements or omis-sions of monetary amounts or disclo-sures in financial statements designed to deceive financial statement users, disregarding critical financial infor-mation and violating the conformity to the generally accepted accounting prin-ciples (GAAP). Financial statement fraud generally involves intention and deception by knowledgeable people (e.g., top executives, auditors) with a set of well-planned schemes and a considerable gamesmanship (Rezaee 2005).
Three conditions depicted in SAS No. 99 are present in fraudulent be-haviors:
1. Pressure. Pressure constitutes an
results than actual performance, frustration with work, or even a challenge to manipulate the system. Albrecht et al. (2006) state that fraud can be perpetrated to benefit one-self or to benefit an organization. They provide four types of Pressure examples: (1) financial pressure, (2) vice, (3) work-related pressure, and (4) other pressure.
2. Opportunity. Opportunity is defined
as existing circumstances –such as the absence of controls, ineffective controls, or the ability of manage-ment to override controls– that pro-vides an opportunity for fraud to be perpetrated. Albrecht et al. (2006) argue that Opportunity is perceived as concealing or avoiding punish-ments. They also note six major factors that increase opportunities for an individual to commit frauds within an organization: (1) lack of or circumvention of controls pur-ported to prevent or detect fraudu-lent behaviors, (2) inability to judge quality of performance, (3) failure to discipline fraud perpetrators, (4) lack of access to information, (5) ignorance, apathy, and incapacity, and (6) lack of a fraud audit.
3. Rationalization (Attitude). Those
involved in financial statement fraud are able to rationalize fraudulent acts as being consistent with their personal code of ethics. Some indi-viduals possess attitudes, charac-ters or set of ethical values that allow them to knowingly and inten-tionally commit dishonest acts.
This research develops hypoth-eses derived from the fraud triangle above as introduced by SAS No. 99. Therefore, this study empirically hy-pothesizes that the fraud risk factors – categorized by Pressure, Opportunity, and Rationalization– are associated with the higher likelihood of fraudu-lent financial reporting.
FRAUD = f (Pressure, Opportunity, Rationalization)
Each fraud risk factor will be proxied by associated variables. Hence, the variables used in this research are as follows:
Pressure Variables
Albrecht et al. (2006) state that financial ratios can be a useful tool for detecting fraudulent financial report-ing. Financial ratio is one of the ana-lytical procedures, as SAS No. 99 sug-gests, derived from an entity’s finan-cial and operational data to help audi-tor identify fraud (Kaminski et al. 2004). Unusual changes in financial ratios may indicate fraudulent activi-ties carried out by managers. Some of the financial ratios utilized by this research are: financial leverage, capi-tal turnover, and profitability, which serve as proxies for Pressure. This research predicts that these financial ratios are associated with fraudulent financial reporting.
1. Financial Leverage - Total Liabil-ity/Total Assets (LEV). Financial
(Loebbecke et al. 1989; Stice 1991; Kirkos et al. 2007). In this study, total liability/total assets or finan-cial leverage (LEV) is used as a proxy for Pressure. Persons (1995) suggests that there is an association between higher leverage and higher likelihood of loan agreement viola-tion, and also an association be-tween higher leverage and less abil-ity to obtain additional funding through borrowing. Furthermore, management typically tends to manipulate financial statements to cope with the requirement for cov-enants (Kirkos et al. 2007). Thus, this investigation expects to ob-serve a positive and statistically significant link between financial distress and the likelihood of fraudulent financial statements. H1a: Firms with higher financial
leverage will be more likely to engage in financial state-ment frauds.
2. Capital Turnover - Sales/Total As-sets (SALTA). Capital turnover
measures the sales generating power of a firm’s assets and also management ability to deal with competitive situations (Pearsons 1995). He argues that fraudulent firm management may be less com-petitive than that of non-fraudulent firms in using the firm’s assets to generate sales. If a firm is not able to successfully compete, it may be fostered to produce fraudulent fi-nancial statements (Persons 1995). Therefore, this study expects to see an association between capital
turn-over and fraudulent financial state-ments.
H1b: Firms with lower net sales/ total assets ratio will be more likely to engage in financial statement frauds.
3. Profitability - Net Profit/Total As-sets (NPROFTA). Persons (1995)
states that firms with lower profit-ability are likely to overstate rev-enues or underestimate expenses. Kreutzfeldt and Wallace (1986) and Persons (1995) find that firms with lower profitability are significantly linked to have more errors in their financial statements than firms with higher profitability. This research uses net profit/total assets (NPROFTA), and expects that NPROFTA is significantly associ-ated with fraudulent financial state-ments.
H1c: Firms with lower net profits/ total assets ratio will be more likely to engage in financial statement frauds.
Opportunity Variables
Opportunity, in this study, con-sists of related party transaction, Big 4, and inventory/total assets ratio.
1. Related Party Transaction (RPTRANS). SAS No. 99 suggests
com-pany and an insider —in the form of a subsidiary, family-related com-pany, employee, and so forth. This kind of transaction may not reflect arm’s —length bargaining, which is a crucial point for revenue recog-nition between independent par-ties. Carmichael (1999) states if a transaction materially differs from its economic substance, profit rec-ognition should generally be de-ferred. Related party transaction, unfortunately, for many cases is allegedly used to manipulate earn-ings, loot companies, and commit frauds (Young 2005). Young (2005) also asserts that recent frauds in Enron, Tyco, Adelphia, WorldCom, and Holingger typically involved related party transactions. Chen and Elder (2007) consistently find that firms with more related party trans-actions tend to engage in fraud. Therefore, this study expects to observe a positive relationship be-tween related party transactions and the likelihood of financial state-ment frauds.
H2a: Firms involved related party transactions will be more likely to engage in financial statement frauds.
2. Big 4 (BIG4). Prior studies find an
association between audit-firm quality and Big 4 (audit-firm size). Big 4 represents the four largest international accounting firms (Deloitte & Touche, Ernst and Young, KPMG, and Price-waterhouse Coopers). Palmrose (1988) finds that Big 8 has higher
audit quality shown by low litiga-tion activities than does Non-Big 8. Audit-firm quality is proxied by audit-firm size, brand name, and its ability to mitigate agency problems (DeFond 1992). Farber (2005) con-sistently shows that fraudulent firms have fewer instances of employing Big 4 audit firms. These findings indicate that Big 4 audit-firm size provides better audit-firm quality than does Non-Big 4, and reduces a firm’s opportunity to engage in frauds. Therefore, this study pre-dicts that fraudulent firms are more likely to have a lower probability of employing a Big 4 audit firm. H2b: Firms audited by a Big 4
audit firm will be less likely to engage in fraudulent fi-nancial reporting.
3. Inventory/Total Assets (INVTA).
associa-tion with fraudulent financial state-ments.
H2c: Firms with higher inventory/ total assets ratio will be more likely to engage in financial statement frauds.
Rationalization Variables
Skousen and Wright (2006) argue that even though Rationalization is a necessary factor in the fraud triangle, it is still very difficult to observe an individual’s rationale. Furthermore, they do not find any significant fraud risk factors as proxies for Rationaliza-tion. Ramos (2003) states that auditors cannot possibly know with certainty what a person’s ethical standards and beliefs are. Even more, Brazel et al. (2007) do not include any fraud risk factors as proxies for Rationalization in their empirical research. They state that it is very limited or even unavail-able public data to be surrogates for management rationales or attitudes. On the other hand, Ramos (2003) notes that auditors may become aware of circumstances that indicate the pos-sible presence of an attitude that po-tentially induces fraud risk. Chen and Elder (2007) find some significant fraud risk factors, such as the number of earnings restatement, the number of internal auditor switches, and the num-ber of internal auditor switches, as proxies for Rationalization or Atti-tude. In addition, audit qualifications are perceived to have a negative effect on a firm’s stock price (Chow and Rice 1982) and its ability to borrow funds (Schwartz and Menon 1985).
Accord-ingly, a firm with a qualified opinion may change to other auditors. This fact is exemplified by research conducted by Johnson and Lys (1990) and Krishnan, Krishnan, and Stephens (1996) which find that firms tend to change auditors after receiving a quali-fied opinion. Following Chen and El-der (2007), Johnson and Lys (1990), and Krishnan, Krishnan, and Stephens (1996), this study involves auditor change (AUDCHANG) and audit opin-ion (AO) as proxies for Ratopin-ionaliza- Rationaliza-tion. These variables will be accompa-nied by the going concern report (GC) variable, which is expected to be a suitable parameter for Rationalization.
1. Auditor Change (CPA).
H3a: Firms with more often audi-tor switches have a tendency to engage in fraudulent re-porting.
2. Audit Opinion (AO). Vermeer
(2003) reveals that SAS No. 82 has not changed an auditor’s tolerance toward a client’s attempts to man-age earnings. He even finds that auditors have become more toler-ant with a client’s attempts to man-age earnings over time. Earnings management is management deci-sion-making process that opens roads to incentives or insight man-agement, terms that might lead to the Rationalization of fraudulent financial reporting (Beneish 1997; Francis and Krishnan 1999; Vermeer 2003; and Skousen and Wright 2006). Following Skousen and Wright (2006), this research uses Audit Opinion as one of the proxies for Rationalization. Thus, this study predicts that firms com-mitting earnings management will tend to rationalize its fraudulent financial reporting.
H3b: Firms that get an unqualified opinion with an additional explanatory language will be more likely to engage in fraudulent financial report-ing.
3. Going Concern (GC). Statement
on Auditing Standard (SAS) No. 59, The Auditor’s Consideration of Entity’s Ability to Continue As a Going Concern, requires auditors to assess the client’s ability to
con-tinue as a going concern and assess management plans and provide guidance as to what information and steps to consider if auditors believe that any substantial going concerns are present. Furthermore, the Standard considers the adequacy of financial statement disclosure as a sign of the ability to continue as a going concern. Ellingsen et al. (1989) define going concern as management ability to continue op-erations. They note that going con-cern can be affected by many causes, such as foreign competi-tion, declining commodity prices, and poor management. Hopwood et al. (1994) argue that the exami-nation of an auditor’s going-con-cern decision should be tested us-ing stressed and non-stressed samples, because bankrupt firms have potentials to engage in fraudu-lent financial reporting. Thus, in this research, it is expected that firms with the presence of going concerns are positively associated with fraudulent financial report-ing.
H3c: Firms with an auditor’s go-ing-concern opinion tend to engage in financial statement frauds.
Sample Selection and
Description
Fraudulent Firm Selection
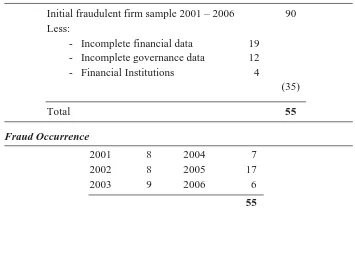
This research utilizes data from three different sources. Initial sample is retrieved from Audit Analytics, which provides restatement data of firms engaged in financial fraudulent activities. These firms were allegedly involved in fraudulent financial state-ments between 2001 and 2006. This study looks at 90 firms identified as having been engaged in financial state-ment frauds occurring during this pe-riod. Fraudulent firms are defined as firms obliged to do restatements be-cause of financial frauds, irregulari-ties, and misrepresentations. This study subsequently collects governance mechanism data from EDGAR SEC
Filling and Report and financial state-ment data from COMPUSTAT data-base for the corresponding year of the alleged fraud. Eliminating financial institutions (bank, insurance, etc.) and missing or incomplete data, the sample comprises 55 fraudulent firms, repre-senting 28 different industries. Finan-cial institutions are excluded from this sample because they lack certain fi-nancial information such as accounts receivable and inventories (Persons 1995).
Table 1, Panel A shows fraudu-lent firm sample selection and its dis-tribution in the period of 2001-2006, while Panel B presents industry repre-sentation of fraudulent firms.
Table 1. Sample Selection Method
Panel A: Fraudulent Firm Selection
Initial fraudulent firm sample 2001 – 2006 90 Less:
- Incomplete financial data 19 - Incomplete governance data 12 - Financial Institutions 4
(35)
Total 55
Fraud Occurrence
2001 8 2004 7
2002 8 2005 17
2003 9 2006 6
Continued from Table 1
Panel B: Industry Representation of Fraudulent Firms
SIC Code Industry Number Percent
10 Metal Mining 1 1.82%
12 Bituminous Coal and Lignite Surface Mining 1 1.82%
13 Drilling Oil and Gas Wells 2 3.64%
14 Mining & Quarrying of Nonmetallic Minerals (No Fuels) 1 1.82% 16 Heavy Construction Other Than Building Construction 1 1.82%
22 Textile Mill Products 1 1.82%
23 Apparel & Other Finished Products 3 5.45%
28 Chemical and Allied Products 3 5.45%
33 Iron and Steel Foundries 1 1.82%
34 Fabricated Metal Products 1 1.82%
35 Industrial and Commercial Machinery and Computer Equipment 1 1.82% 36 Electronic and Other Electrical Equipment and Components 4 7.27%
37 Motor Vehicle Parts and Accessories 1 1.82%
38 Measuring, Analyzing, and Controlling Instruments 1 1.82%
42 Trucking 1 1.82%
45 Air Transportation 1 1.82%
47 Arrangement of Transportation of Freight and Cargo 1 1.82%
48 Communications 1 1.82%
49 Electric, Gas, and Sanitary Services 2 3.64%
50 Wholesale Trade - Durable Goods 1 1.82%
51 Wholesale Trade - Non Durable Goods 3 5.45%
67 Holding and Other Investment Offices 1 1.82%
73 Business Services 13 23.64%
75 Services-Automotive Repair, Services & Parking 1 1.82% 78 Motion Picture and Video Tape Production and Distribution 2 3.64%
80 Health Services 3 5.45%
83 Services-Social Services 1 1.82%
87 Management Consulting Services 2 3.64%
Comparing Fraudulent Firms to
Non-Fraudulent Firms
Following Beasley (1996), and Bell and Carcello (2000), this study uses a control group, the non-fraudu-lent firms, in terms of year, industry, and firm size. Matching fraudulent and non-fraudulent firms is subject to similar:
1. Year. This research identifies
non-fraudulent firms in the same period of fraud occurrence from 2001 to 2006.
2. Industry. Firms in the same
indus-try are expected to have similar business environments and ac-counting and reporting require-ments (St. Pierre and Anderson 1984; Persons 1995). The study selects matched non-fraudulent firms based on the same four-digit SIC code (industry membership) as that of the fraudulent firms. If there
is no similar four-digit SIC code identified, three-digit SIC code matching is used. If there is no similar three-digit SIC code identi-fied, correspondingly, a two-digit SIC code matching is performed.
3. Firm Size. If non-fraudulent firms
identified in steps 1 and 2 are more than five firms, they will be re-duced to five firms whose net sales are in the range of +/-30 percent of the fraudulent firms’ net sales. Ac-cording to Kaminski et al. (2004), if the non-fraudulent firms’ net sales are beyond the range of +/-30 per-cent, then their total asets will be compared to fraudulent firms’ total assets. It is expected that the non-fraudulent firms’ total assets will be in the range of +/- 30 percent of fraudulent firms’ total assets. This study chooses five matched non-fraudulent firms for each fraudu-lent firm. Exception prevails if the
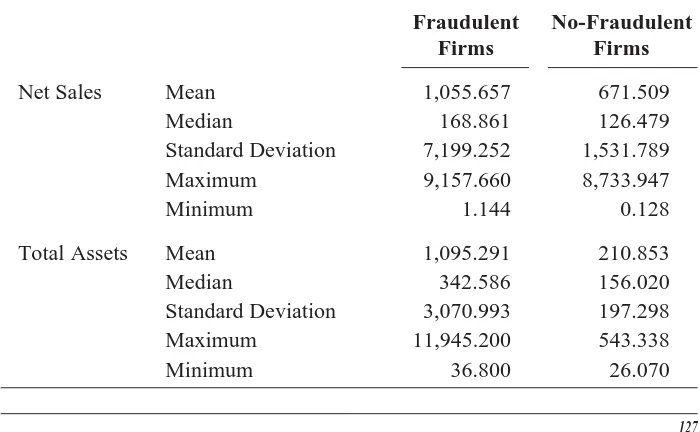
Table 2. Descriptive Statistics
Fraudulent No-Fraudulent
Firms Firms
Net Sales Mean 1,055.657 671.509
Median 168.861 126.479
Standard Deviation 7,199.252 1,531.789
Maximum 9,157.660 8,733.947
Minimum 1.144 0.128
Total Assets Mean 1,095.291 210.853
Median 342.586 156.020
Standard Deviation 3,070.993 197.298
Maximum 11,945.200 543.338
matched non-fraudulent firms in the same industry total less than five firms. Since this study does not find a complete dataset using a single criterion (net sales), an addi-tional criterion (total assets) is nec-essary to match fraudulent firms and non-fraudulent firms, which consequently may disrupt the matching process.
Table 2 shows descriptive statis-tics of fraudulent and non-fraudulent firms. The table indicates that the fraudulent firms and non-fraudulent firms do not differ significantly based on net sales and total assets.
Research Design
Since the dependent variable, FRAUD, is dichotomous, the study uses a logistic regression model to test the hypothesis of association between fraud risk factors and the likelihood of fraudulent financial reporting. The re-gression is based on a matched-pair sample in which 38.5 percent of the firms have committed fraudulent fi-nancial statements and the rest have not committed fraudulent financial statements.
FRAUD = a dummy variable with a value of 1 if a firm is
alleged to have commit-ted a financial statement fraud, and a value of 0 otherwise.
LEV = ratio of Total Debt/To-tal Assets.
SALTA = ratio of Sales/Total As-sets.
NPROFTA = ratio of Net Profits/To-tal Assets.
INVTA = ratio of Inventory/Total Assets.
RPTRANS = a dummy variable with a value of 1 if a firm is engaged in related party transactions and a value of 0 otherwise.
BIG4 = a dummy variable with a value of 1 if a firm is audited by a Big 4 ac-counting firm and a value of 0 otherwise. CPA = a dummy variable with
a value of 1 if a firm switches its auditor and a value of 0 otherwise. GC = a dummy variable with
a value of 1 if a going-concern opinion is is-sued by auditor and a value of 0 otherwise. AO = a dummy variable with
a value of 1 if a firm has an unqualified auditor and a value of 0 other-wise.
LnASSETS= Ln Total Assets. ε = the residual.
with a value of 1 (one) if a firm is engaged in fraudulent financial state-ment and a value of 0 (zero) otherwise. Hypothesis 1 states that the fraud risk factors for Pressure are positively as-sociated with the likelihood of fraudu-lent financial statements. More spe-cifically, the study hypothesizes that total debt/total assets ratio (LEV), sales/total assets ratio (SALTA), and net profits/total assets ratio (NPROFTA), are related to the likeli-hood of fraudulent financial state-ments.
Hypothesis 2 (H2) proposes that fraud risk factors for Opportunity are related to the engagement in fraudu-lent financial statements. In this case, this research hypothesizes that inven-tory/total assets ratio (INVTA), re-lated party transactions (RPTRANS), and Big 4 or 5 (BIG4), are associated with the likelihood of financial state-ment frauds.
Hypothesis 3 (H3) states that fraud risk factors for Rationalization are re-lated to the increasing tendency to engage in fraudulent financial state-ments. This study expects auditor change (CPA), audit opinion (AO), and going-concern opinion (GC) to be associated with the likelihood of fi-nancial statement frauds. Following Chen and Elder (2007), this research uses firm size (ASSETS) as a control variable, and expects that assets is negatively associated with the likeli-hood of fraudulent financial statements since firms with bigger assets (firm size) tend to have stronger internal
controls than do smaller firms (Beasley et al. 1999).
Following Chen and Elder (2007), this research initially tests individual hypotheses for each fraud risk factor proxy, and then simultaneously uses full regression for all three fraud risk factor proxies. This study also includes ASSETS as a control variable for both individual fraud risk factor proxy and the full regression model.
Empirical Results and
Additional Analysis
The independent variables of this study are selected by performing an initial assessment of 30 variables, which at length result in the use of 11 independent variables. Following Chen and Elder (2007), this study selects three independent variables for each fraud risk factor based on statistical criteria from the univariate analysis as shown in Tables 3 and 4. Table 3 shows the t-test and Wilcoxon Sign-Rank test. The correlations among de-pendent variable and indede-pendent vari-ables are reported in Table 4.
Table 3. T-tests and Wilcoxon Sign-Rank Test
Variable Fraudulent Firms NFraudulent Firms Wilcoxon Test
Means Median SD Means Median SD Z P
NCFO 0.3091 0.0000 0.4664 0.3182 0.0000 0.4684 -0.1135 0.9096 LEV 0.5683 0.5783 0.2819 0.5060 0.4600 0.2746 -1.2822 0.1998 ROA -0.1326 -0.0162 0.3412 -0.0636 0.0081 0.2525 -1.3320 0.1829 SALAR 9.2133 5.6482 13.6410 17.4856 6.2430 69.3699 -0.5270 0.5982 SALTA 1.2231 1.0190 0.9968 1.1852 0.7189 1.3767 -1.2822 0.1998 NPROFTA -0.1336 -0.0162 0.3404 -0.0643 0.0075 0.2527 -1.3486 0.1775 WCAPTA 0.2084 0.2014 0.2364 0.2086 0.2244 0.2563 -0.2677 0.7890 EBIT 392.4733 23.4440 1937.9645 92.2728 8.8015 216.7345 -1.3859 0.1658 DETEQ 0.5010 0.9540 21.6992 2.2794 0.6888 6.0173 -0.8714 0.3835 INVSAL 0.0811 0.0316 0.1077 0.0638 0.0068 0.0991 -1.2692 0.2044 INVTA 0.0876 0.0317 0.1156 0.0565 0.0116 0.0883 -1.5120 0.1305 DUALITY 0.6182 1.0000 0.4903 0.6023 1.0000 0.4922 -0.1890 0.8501 BODMEET 10.4909 9.0000 7.0261 9.0000 8.0000 4.6929 -0.8205 0.4119 BODSIZ 7.7818 8.0000 2.1662 7.4545 7.0000 1.9529 -0.7788 0.4361 INSBOD 1.7636 1.0000 0.9806 1.8409 2.0000 1.0382 -0.4765 0.6337 OUTB 6.0182 6.0000 2.1559 5.6023 5.5000 1.8291 -0.8857 0.3758 ACMEET 11.7091 9.0000 7.7212 9.7727 9.0000 6.0281 -1.2199 0.2225 ACSIZ 3.4909 3.0000 0.8136 3.3182 3.0000 0.9890 -0.6215 0.5343 OUTAC 3.4727 3.0000 0.8357 3.2841 3.0000 1.0278 -0.6550 0.5125 ACCEXP 0.9818 1.0000 0.7069 0.9545 1.0000 0.9086 -0.5578 0.5770 FINEXP 2.1636 2.0000 1.0321 1.9432 2.0000 1.2627 -1.2943 0.1956 NONBEXP 0.3273 0.0000 0.5112 0.4205 0.0000 0.6200 -0.7028 0.4822 RPTRANS 0.4545 0.0000 0.5025 0.1023 0.0000 0.3047 -4.7973 0.0000 BIG4 0.9273 1.0000 0.2621 0.7273 1.0000 0.4479 -2.9219 0.0035 CPA 0.2909 0.0000 0.4584 0.4318 0.0000 0.4982 -1.6851 0.0920 GC 0.0727 0.0000 0.2621 0.0682 0.0000 0.2535 -0.1033 0.9177 AO 0.9818 1.0000 0.1348 0.9886 1.0000 0.1066 -0.3366 0.7364 ICD 0.7091 1.0000 0.4584 0.7841 1.0000 0.4138 -1.0113 0.3119 ICA 0.5455 1.0000 0.5025 0.6705 1.0000 0.4727 -1.4948 0.1350
FRAUD = a dummy variable with a value of 1 if a firm is alleged to have experience financial statement fraud and a value of 0 otherwise.
NCFO = a dummy variable with a value of 1 if a firm has negative operating cash flows and a value of 0 otherwise.
Continued from Table 3
SALAR = ratio of Net Sales/Account Receivable. SALTA = ratio of Net Sales/Total Assets. NPROFTA = ratio of Net Profits/Total Assets. WCAPTA = ratio of Working Capital/Total Assets. EBIT = Earning Before Interests and Taxes. DETEQ = ratio of Debt/Equity.
INVSAL = ratio of Inventory/Net Sales. INVTA = ratio of Inventory/Total Assets.
DUALITY = a dummy variable with a value of 1 if the firm’s CEO and board chairman are the same person and a value of 0 otherwise.
BODMEET = the number of the board meeting. BODSIZ = the number of the board of director.
INSBOD = the number of the board of director from inside. OUTB = the number of the board of director from outside. ACMEET = the number of the audit committee meeting. ACSIZ = the number of the audit committee.
OUTAC = the number of the audit committee member from outside. ACCEXP = the number of the audit committee’s accounting expert. FINEXP = the number of the audit committee’s financial expert.
NONBEXP = the number of the audit committee’s non accounting-financial expert.
RPTRANS = a dummy variable with a value of 1 if a firm is engaged in related party transaction and a value of 0 otherwise.
BIG4 = a dummy variable with a value of 1 if a firm is audited by Big 4 accounting firm and a value of 0 otherwise.
DUALITY = a dummy variable with a value of 1 if CEO and chairman of the board are held by same person and a value of 0 otherwise.
CPA = a dummy variable with a value of 1 if a firm switches its auditor and a value of 0 otherwise. AO = a dummy variable with a value of 1 if a firm has unqualified auditor and a value of 0 otherwise. GC = a dummy variable with a value of 1 if going concern opinion is issued by auditor and a value of
0 otherwise.
ICD = a dummy variable with a value of 1 if a firm commits fraud in 2003-2006 and a value of 0 if a firm commits fraud in 2001-2002.
Gadjah Mada International Journal of Business,
January -April 2009, Vol. 11, No. 1
Table 4. Correlations among Dependent and Independent Variables
FRAUD NCFO LEV ROA SALAR SALTA NPROFTA WCAPTA EBIT DETEQ INVSAL INVTA DUALITY BODMEET
NCFO -0.0095 1 0.9101
LEV 0.1093 -0.1410 1 0.1938 0.0931
ROA -0.1160 -0.5273 0.0558 1 0.1677 0.0000 0.5077
SALAR -0.0733 0.1401 -0.0452 0.0008 1 0.3843 0.0951 0.592 0.9927
SALTA 0.0149 -0.0379 0.1347 0.0514 -0.0201 1 0.8595 0.6528 0.1088 0.5421 0.8117
NPROFTA -0.1166 0.5266 0.0544 0.9999 0.0011 0.0523 1 0.1654 0.0000 0.5184 0.0000 0.9897 0.5350
WCAPTA -0.0004 0.0554 -0.6505 0.0787 -0.1100 0.1116 0.0803 1 0.9961 0.5111 0.0000 0.3501 0.1909 0.1846 0.3403
EBIT 0.1205 -0.1046 0.0371 0.0739 -0.0181 -0.0905 0.0742 -0.1125 1 0.1516 0.2137 0.6603 0.3806 0.8305 0.2825 0.3782 0.1808
DETEQ -0.0611 0.0819 0.0560 -0.0533 -0.0088 -0.1136 -0.0534 -0.1437 0.0030 1 0.4686 0.3307 0.5063 0.5269 0.9172 0.1767 0.5266 0.0869 0.9713
INVSAL 0.0823 0.1160 -0.1434 -0.0698 -0.0408 -0.1269 -0.0687 0.2744 -0.0343 -0.0035 1 0.3285 0.1678 0.0874 0.4077 0.6284 0.1309 0.4149 0.0009 0.6845 0.9667
INVTA 0.1511 0.0688 -0.0436 -0.0148 -0.0535 0.1269 -0.0137 0.2872 -0.0745 -0.0294 0.8179 1 0.0716 0.4145 0.6054 0.8606 0.5257 0.1309 0.8711 0.0005 0.3765 0.7276 1.1714
DUALITY 0.0159 -0.1659 0.1724 0.1706 0.0912 0.1403 0.0089 0.0831 0.1706 -0.0950 0.0685 -0.0424 1 0.8509 0.0477 0.0395 0.0416 0.2788 0.0947 0.9163 0.3236 0.0416 0.2592 0.4164 0.6150
BODMEET 0.1271 0.0559 -0.0664 -0.0500 -0.0243 -0.1278 -0.0558 -0.1303 -0.0501 0.0345 0.0468 0.0001 -0.055 1 0.1303 0.5070 0.4306 0.5530 0.7735 0.1282 0.5083 0.1209 0.5526 0.6821 0.5788 0.9993 0.5145
133
Fraudulent Financial Statement
Continued from Table 4
FRAUD NCFO LEV ROA SALAR SALTA NPROFTA WCAPTA EBIT DETEQ INVSAL INVTA DUALITY BODMEET
Gadjah Mada International Journal of Business,
January -April 2009, Vol. 11, No. 1
Continued from Table 4
FRAUD NCFO LEV ROA SALAR SALTA NPROFTA WCAPTA EBIT DETEQ INVSAL INVTA DUALITY BODMEET
AO -0.0282 0.0807 0.0247 -0.0615 0.0072 -0.0035 -0.0332 -0.0608 -0.0618 -0.0318 0.0067 0.0048 0.0264 -0.0089 0.7377 0.3380 0.7693 0.4653 0.9322 0.9671 0.6943 0.4707 0.4635 0.7062 0.9369 0.9550 0.7539 0.9160 ICD -0.0849 -0.1396 0.0149 0.2663 -0.1344 0.0437 0.0000 0.0048 0.2698 -0.0027 0.0803 -0.0603 0.1098 0.1057 0.3136 0.0963 0.8601 0.0013 0.1095 0.6039 0.9999 0.9544 0.0011 0.9741 0.3402 0.4742 0.1919 0.2092 ICA -0.1254 -0.0623 -0.0057 0.1963 -0.1235 0.0334 -0.1519 -0.1105 0.1992 0.0094 0.0842 -0.0885 0.1139 0.0960 0.1355 0.4595 0.9465 0.0188 0.1418 0.6923 0.0701 0.1889 0.0171 0.9111 0.3177 0.2933 0.1757 0.2542 ASSETS 0.1318 -0.0902 0.0774 0.0663 -0.0235 -0.1019 -0.0348 -0.0810 0.0665 -0.1268 0.9823 -0.0180 0.0572 0.0844 0.1165 0.2839 0.3581 0.4318 0.7808 0.2260 0.6802 0.3363 0.4298 0.1312 0.0000 0.8309 0.4972 0.3160
BODSIZ INSBOD OUTB ACMEET ACSIZ OUTAC ACCEXP FINEXP NONBEXP TRANS BIG4 CPA GC AO ICD ICA
INSBOD 0.3196 1 0.0001
OUTB 0.8710 -0.1854 1 0.0000 0.0266
ACMEET 0.2432 -0.0123 0.2572 1 0.0034 0.8837 0.0019
ACSIZ 0.3662 -0.0196 0.3873 0.1634 1 0.0000 0.8161 0.0000 0.0511
OUTAC 0.3690 -0.0389 0.4001 0.1741 0.9852 1 0.0000 0.6448 0.0000 0.0376 0.0000
ACCEXP 0.0410 -0.1578 0.1152 0.1092 0.2453 0.2356 1 0.6264 0.0599 0.1706 0.1941 0.0031 0.0046
FINEXP 0.2774 0.1221 0.2276 0.0731 0.5761 0.5692 -0.4924 1 0.0008 0.1461 0.0063 0.3857 0.0000 0.0000 0.0000
135
Fraudulent Financial Statement
Continued from Table 4
BODSIZ INSBOD OUTB ACMEET ACSIZ OUTAC ACCEXP FINEXPNONBEXP TRANS BIG4 CPA GC AO ICD ICA
RPTRANS 0.1721 0.1207 0.1182 0.1593 0.1410 0.1352 -0.0358 0.1403 -0.0022 1 0.0398 0.1512 0.1598 0.0574 0.0930 0.1073 0.6713 0.0946 0.9793
BIG4 0.2801 0.0124 0.2822 0.3226 0.3392 0.3314 0.1064 0.1915 -0.0070 0.1514 1 0.0007 0.8827 0.0006 0.0001 0.0000 0.0001 0.2058 0.0220 0.9336 0.0711
CPA -0.1375 0.1170 -0.2075 -0.0640 -0.1527 -0.1547 -0.0887 -0.0553 0.0058 -0.0284 -0.2336 1 0.1015 0.1639 0.0129 0.4474 0.0687 0.0650 0.2921 0.5118 0.9456 0.7360 0.0050
GC -0.1190 -0.0030 -0.1208 -0.1999 -0.2628 -0.2456 -0.1204 -0.2163 0.1969 0.0401 -0.2793 0.1823 1 0.1570 0.9713 0.1507 0.0167 0.0015 0.0031 0.1520 0.0095 0.0184 0.6345 0.0007 0.0293
AO 0.0341 0.0367 0.0160 0.1062 -0.0149 -0.0179 0.0666 -0.0478 -0.0238 -0.2132 -0.0588 0.0928 0.0327 1 0.6863 0.6635 0.8500 0.2066 0.8599 0.8324 0.4292 0.5709 0.7782 0.0106 0.4857 0.2705 0.6986
ICD 0.1789 0.1029 0.1303 0.3282 0.0610 0.0932 0.0739 -0.0141 0.0130 -0.0641 0.0060 0.1079 -0.0352 0.2092 1 0.0326 0.2213 0.1209 0.0001 0.4693 0.2681 0.3805 0.8671 0.8777 0.4467 0.9431 0.1995 0.6761 0.0122
ICA 0.1162 0.1400 0.0454 0.3719 0.0120 0.0341 0.1061 -0.0918 0.0691 -0.0393 -0.1299 0.1604 -0.0127 0.1529 0.7308 1 0.1671 0.0954 0.5903 0.0000 0.8867 0.6863 0.2074 0.2753 0.4125 0.6409 0.1220 0.0556 0.8807 0.0683 0.0000 ASSETS 0.2961 0.0052 0.3047 0.0843 0.3130 0.3077 0.0028 0.2205 0.0476 -0.0107 0.0979 -0.0927 -0.0556 0.0131 0.0977 0.1020
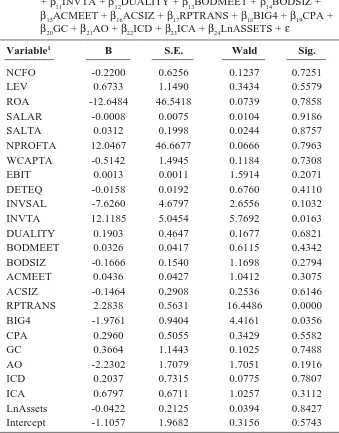
Table 5. Initial Logistic Regression
FRAUD = β0 + β1NCFO + β2 LEV + β3ROA + β4SALTA + β5SALTA + β6NPROFTA + β7WCAPTA + β8EBIT + β9DETEQ + β10INVSAL + β11INVTA + β12DUALITY + β13BODMEET + β14BODSIZ + β15ACMEET + β16ACSIZ + β17RPTRANS + β18BIG4 + β19CPA + β20GC + β21AO + β22ICD + β23ICA + β24LnASSETS + ε
Variable1 B S.E. Wald Sig.
NCFO -0.2200 0.6256 0.1237 0.7251
LEV 0.6733 1.1490 0.3434 0.5579
ROA -12.6484 46.5418 0.0739 0.7858
SALAR -0.0008 0.0075 0.0104 0.9186
SALTA 0.0312 0.1998 0.0244 0.8757
NPROFTA 12.0467 46.6677 0.0666 0.7963
WCAPTA -0.5142 1.4945 0.1184 0.7308
EBIT 0.0013 0.0011 1.5914 0.2071
DETEQ -0.0158 0.0192 0.6760 0.4110
INVSAL -7.6260 4.6797 2.6556 0.1032
INVTA 12.1185 5.0454 5.7692 0.0163
DUALITY 0.1903 0.4647 0.1677 0.6821
BODMEET 0.0326 0.0417 0.6115 0.4342
BODSIZ -0.1666 0.1540 1.1698 0.2794
ACMEET 0.0436 0.0427 1.0412 0.3075
ACSIZ -0.1464 0.2908 0.2536 0.6146
RPTRANS 2.2838 0.5631 16.4486 0.0000
BIG4 -1.9761 0.9404 4.4161 0.0356
CPA 0.2960 0.5055 0.3429 0.5582
GC 0.3664 1.1443 0.1025 0.7488
AO -2.2302 1.7079 1.7051 0.1916
ICD 0.2037 0.7315 0.0775 0.7807
ICA 0.6797 0.6711 1.0257 0.3112
LnAssets -0.0422 0.2125 0.0394 0.8427
Intercept -1.1057 1.9682 0.3156 0.5743
Chi-Square for Model = 52.02; p-value = 0.001; Pseudo R2 = 0.414
Hosmer & L Test = 0.547 _________________
Regression Results
Table 6 statistically illustrates the logistic regression results for each el-ement and the full regression.
The result for each fraud risk fac-tor –Pressure, Opportunity, and Ratio-nalization– will be described in the following sections as well as the full regression for the fraud triangle.
Model 1: Pressure. In model 1 of
Table 6, NPROFTA is negatively and significantly associated with fraudu-lent financial statements, while LEV and SALTA are statistically insignifi-cant. Pseudo R2 is relatively low (0.071)
and the p-value for the model is sig-nificant at 0.103. The result indicates that a company with lower profitabil-ity tends to make errors in its financial statements or tries to make financial statements look better by cooking the books. This finding is in line with Person (1995) who states that lower profitability could encourage manage-ment to overstate revenues or under-state expenses.
Model 2: Opportunity. Opportunity
fraud risk factors in the model 2 of Table 6 produce figures that are statis-tically significant and have positive signs for INVTA and RPTRANS, and a negative sign for BIG4. Pseudo R2
(0.286) and p-value (0.000) also sup-port the association between INVTA, RPTRANS, and BIG4, and the likeli-hood of committing frauds. The re-sults are consistent with the second hypothesis, which states that the prox-ies are significant in explaining the link between Opportunity fraud risk
factors and the tendency to commit financial statement frauds. Auditors should be careful in conducting inven-tory audits since it involves a subjec-tive estimation and can easily be falsi-fied. Related party transactions also give an opportunity to commit frauds since it may not reflect arm’s-length bargaining between involved parties. These transactions can greatly influ-ence revenue recognition if defects exist. Finally, audit quality –proxied by audit-firm size, brand name, and its ability to mitigate agency problems– may also support the indication of fraud. Accounting firms –Big 4 usu-ally provide a better audit quality, so they can reduce the opportunity to commit frauds.
Model 3: Rationalization. The third
Gadjah Mada International Journal of Business,
January -April 2009, Vol. 11, No. 1
FRAUD=β0+ β1 LEV + β2 SALTA + β3 NPROFTA + β4 INVTA + β5RPTRANS+ β6BIG4+ β7 CPA + β8 GC+ β9AO+ β10LnASSETS+ ε
Model 1 Model 2 Model 3 Model 4
Variable Coefficient Wald Coefficient Wald Coefficient Wald Coefficient Wald
Intercept none -2.1162 8.8866 *** 0.8017 2.5155 -1.162 2.339 -2.2739 2.7553 *
Pressure
LEV + 0.4955 0.5414 0.9809 1.6053
SALTA - 0.0760 0.2811 0.0823 0.2687
NPROFTA - -1.2537 3.6917 * -0.9248 1.2954
Opportunities
INVTA + 4.2415 3.9838 ** 4.4248 3.4557 *
RPTRANS + 1.8604 16.2356 *** 1.9694 14.9668 ***
BIG4 - -1.5318 4.7299 ** -1.5565 4.1522 **
Rationalization
CPA + 0.558 2.137 0.5509 1.4929
GC + -0.584 0.659 0.0661 0.0045
AO - 0.303 0.044 -1.4785 0.9580
Control Variable
LnASSETS 0.2026 3.6811 * 0.1189 0.1494 0.152 2.385 0.0217 0.0259
*,**, and *** indicate significance at p < 0.10, p < 0.05, and p < 0.01, respectively
Hosmer & L Test 0.101 0.828 0.151 0.158
Pseudo R-Square 0.071 0.286 0.052 0.327
p-value 0.103 0.000 0.234 0.000
fraudulent financial statements. They argue that there is very limited or even no public data available to indentify and measure Rationalization for fraudulent behavior of management.
Model 4: Full Regression of Fraud Triangle. Model 4 of Table 6
displays the results of a full regression performed simultaneously using all proxies for Pressure, Opportunity, and Rationalization. The model finds that all three proxies for Opportunity (INVTA, RPTRANS, and BIG4) are consistently significant, while NPROFTA from Pressure fraud risk factors is no longer significant. Ratio-nalization variables remain insignifi-cant, and consistently support that Rationalization of fraud triangle seems to be the most difficult factor to be observed using public data.
Additional Analysis
Predictive Fraud Model and Robust-ness. In the next step, an additional
analysis is presented in order to study further the possibility of fraud predic-tion model. For this purpose, this re-search uses the following model:
FRAUD= β0 +β1NPROFTA+ β2 INVTA+
β3RPTRANS+β4BIG4+ β5LnASSETS+ε
where,
FRAUD = a dummy variable with a value of 1 if a firm is alleged to have com-mitted a financial
state-ment fraud and a value of 0 otherwise
NPROFTA = ratio of Net Profits/To-tal Assets
INVTA = ratio of Inventory/To-tal Assets
RPTRANS = a dummy variable with a value of 1 if a firm is engaged in related party transactions and a value of 0 otherwise
BIG4 = a dummy variable with a value of 1 if a firm is audited by a Big 4 ac-counting firm and a value of 0 otherwise LnASSETS = Ln Total Assets
ε = Residual
These variables are employed be-cause they are statistically significant at the individual level and in full re-gression scale, except for NPROFTA that is only significant at the indi-vidual level. The regression results are presented in Table 7. INVTA, RPTRANS and BIG4 are consistently significant to the likelihood of com-mitting frauds, while NPROFTA is no longer significant. Table 7 also pre-sents the goodness-of-fit measures. The model’s chi-square is 35.5 and statisti-cally significant at <0.01. Pseudo R2 is
relatively higher (0.299) and p-value is significant at p<0.01. This model is seemingly appropriate for further analysis since both chi-square and pseudo R2 are significant.
sensi-tivity analysis to examine whether those fraud risk factors can be used to construct a fraud prediction model. One of the discriminant analysis meth-ods is cross-validation method, which removes the first observation from the dataset and builds a discriminant model using the remaining observations (Jones 1987; Hair et al. 1995; and Kuruppu et al. 2003; Skousen and Wright 2006). Cross-validation method is very effective in providing an unbi-ased estimate of a model’s mis-classi-fication rate (Hair et al. 1995) and is particularly useful in studies with small sample size since the entire sample can be used to cross-validate the results (Kuruppu et al. 2003; Skousen and Wright 2006).
After performing the cross-vali-dation method, the results as reported in Table 8 show that model accuracy is approximately 67.1 percent (or the overall misclassification rate of the model is 32.9 percent). Still in Table 8, the model correctly classifies non-fraudulent firms by 77 percent and correctly classifies fraudulent firms by 51 percent. Compared with Kaminski et al. (2004) who have a model success rate of 30 to 40 percent, this model has achieved a higher level of prediction and also has a lower misclassification for both fraudulent firms and non-fraudulent firms. Kaminski et al. (2004) correctly clas-sify fraudulent firms by 2 to 42 percent and non-fraudulent firms by 84 to 90 percent.
Table 7. Fraud Prediction Model
FRAUD= β0 + β1NPROFTA + β2INVTA + β3RPTRANS+ β4BIG4 + β5LnASSETS + ε
Chi-Square for Model = 35.5 p-value = 0.000
Pseudo R2 = 0.299
Hosmer & L Test = 0.257
Variable Coefficient S.E. Wald p-value
Intercept -1.622 0.851 3.638 0.056 *
NPROFTA -0.947 0.740 1.638 0.201
INVTA 4.605 2.230 4.265 0.039 **
RPTRANS 1.753 0.468 14.056 0.000 ***
BIG4 -1.587 0.736 4.646 0.031 **
LnAssets 0.091 0.124 0.546 0.460
Conclusion
This research examines fraud risk factors and constructs a model to pre-dict the likelihood of fraudulent finan-cial statements based on the fraud tri-angle notion, which is adopted in SAS No.99 of AICPA (2002). From various setting of research designs, this study identifies some fraud risk factors that are significantly associated with the likelihood of committing frauds. Con-sistent with prior research, Pressure– represented by net profit/total assets (NPROFTA)–and Opportunity–repre-sented by inventory/total assets (INVTA), related party transaction (RPTRANS), and Big 4 of audit firms (BIG4)–are significantly related to the financial reporting frauds. Meanwhile, none of the Rationalization variables is found to be statistically relevant to the model. It seems that Rationaliza-tion attributes are more difficult to
observe using public data than the other two elements of the fraud triangle– Pressure and Opportunity.
The second objective of this re-search is to construct a model to pre-dict the likelihood of committing frauds using the identified fraud risk factors. Using the cross-validation method of discriminant analysis, it is indicated that the model can predict the ten-dency of fraudulent financial report-ing with a relatively high success rate. Overall, the model correctly classifies firms by 67.1 percent; additionally, the model correctly classifies non-fraudulent firms by 77 percent and fraudulent firms by 51 percent.
Nevertheless, there are some limi-tations of this research. First, fraudu-lent firm data are very limited. Only information on fraudulent firms sub-ject to SEC enforcement actions is publicly available. Second, the predic-Table 8. Discriminate Analysis
Predicted Group Membership
NFRAUD FRAUD Total
Count NFRAUD 71 17 88
FRAUD 24 31 55
% NFRAUD 81% 19% 71.30%
FRAUD 44% 56%
Count NFRAUD 68 20 88
FRAUD 27 28 55
% NFRAUD 77% 23% 67.10%
FRAUD 49% 51%
Original
tive fraud model may misclassify non-fraudulent firms, which have in fact
committed fraud, but have not been subject to the SEC enforcement.
Reference
AICPA. 2007. AU section 316: Consideration of fraud in a financial statement audit. AICPA.
Agrawal, A., and S. Chadha. 2005. Corporate governance and accounting scandals. Journal of Law and Economics 48: 371-406.
Albrecht, W. S., C. C. Albrecht, and C. O. Albrecht. 2006. Fraud Examination. Thomson South-Western.
Beasley, M. S. 1996. An empirical analysis of the relation between the board of director composition and financial statement fraud. The Accounting Review 71 (4):443-465. Beasley, M. S., J. V. Carcello, and D. R. Hermanson. 1999. Fraudulent financial reporting: 1987-1997 an analysis of U.S. public companies. In Research Report: Committee of Sponsoring Organizations of the Treadway Commission 68.
Bell, T. B., and J. V. Carcello. 2000. A decision aid for assessing the likelihood of fraudulent financial reporting. Auditing: A Journal of Practice 19 (1):169-184. Beneish, M. D. 1997. Detecting GAAP Violation: Implications for Assessing Earnings
Management among Firms with Extreme Financial Performance. Journal of Ac-counting and Public Policy 16:271-309.
Brazel, J. F., K. Jones, and M. F. Zimbelman. 2007. Using nonfinancial measures to assess fraud risk. In Working Paper. North Carolina State University, George Mason University, and Brigham Young University 45.
Carmichael, D. R. 1999. Hocus-pocus accounting. Journal of Accountancy (October): 59-65.
Chen, K. Y., and R. J. Elder. 2007. Fraud risk factors and the likelihood of fraudulent financial reporting: Evidence from statement on Auditing Standards No. 43 in Taiwan. In Working Paper. National Taiwan University and Syracuse University, 36. Cressey, D. R. 1953. Other people’s Money: A Study in the Social Psychology of
Embezzlement. Glencoe, Illinois: The Free Press
DeFond, M. L. 1992. The association between changes in client firm agency costs and auditor switching. Auditing: A Journal of Practice 11 (1): 16-31.
Ellingsen, J. E., K. Pany, and P. Fagan. 1989. SAS no. 59: How to evaluate going concern. Journal of Accountancy (January): 24-31.
Fama, E. F., and M. C. Jensen. 1983. Separation of ownership and control. Journal of Law and Economics 26 (2): 301-325.
Farber, D. B. 2005. Restoring trust after fraud: Does corporate governance matter? The Accounting Review 80 (2): 539-561.
Ge, W., and S. McVay. 2005. The disclosure of material weaknesses in internal control after the Sarbanes-Oxley Act. Accounting Horizons 19 (3): 137-158.
Hopwood, W., J. McKeown, and J. Mutchler. 1989. A test of the incremental explanatory power of opinions qualified for consistency and uncertainty. The Accounting Review 64 (1): 28-48.
Johnson, W. B. and Lys T. 1990. The market for audit services: Evidence from voluntary auditor changes. Journal of Accounting and Economics 12 (January).
Kaminski, K. A., T. S. Wetzel, and L. Guan. 2004. Can financial ratio detect fraudulent financial reporting? Managerial Auditing Journal 19 (1): 15-28.
Kirkos, E., C. Spathis, and Y. Manolopoulos. 2007. Data mining techniques for the detection of fraudulent financial statements. Expert Systems with Applications 32: 995–1003.
Klein, A. 2002. Audit committee, board of director characteristics, and earnings manage-ment. Journal of Accounting and Economics 33: 375–400.
Kreutzfeldt, R., and. Wallace, W. 1986. Error characteristics in audit populations: Their profile and relationship to environment factors. Auditing: A Journal of Practice and Theory (Fall): 20-43
Krishnan, J., and J. Krishnan. 1997. Litigation risk and auditor resignations. The Account-ing Review 70 (4): 539-560.
Kuruppu, N., F. Laswad, and P. Oyelere. 2003. The efficacy of liquidation and
bankruptcy models for assessing going concern. Managerial Auditing Journal 18 (6/7): 577-590.
Loebbecke, J. K., M. M. Eining, and J. J. Willingham. 1989. Auditors’ experience with material irregularities: Frequency, nature, and detectability. Auditing: A Journal of Practice 9 (1):1-28.
Palepu, K. G. 1986. Predicting takeover targets: A methodological and empirical analysis. Journal of Accounting and Economics 8: 3-35.
Palmrose, Z.-V. 1988. 1987 Competitive manuscript co-winner: An analysis of auditor litigation and audit service quality. The Accounting Review 63 (1): 55-73.
Patterson, E. R., and J. R. Smith. 2007. The effect of Sarbanes-Oxley on auditing and internal control strength. The Accounting Review 82 (2): 427-455.
Persons, O. S. 1995. Using financial statement data to identify factors associated with fraudulent financial reporting. Journal of Applied Business Research 11 (3): 38. Ramos, M. 2003. Auditors’ responsibility for fraud detection. Journal of Accountancy
January: 28-36.
Rezaee, Z. 2005. Causes, consequences, and deterrence of financial statement fraud. Critical Perspectives on Accounting 16: 277–298.
Skousen, C. J., and C. J. Wright. 2006. Contemporaneous risk factors and the prediction of financial statement fraud. In Working Paper. University of Texas at Arlington and Oklahoma State University, 41.
St. Pierre, K., and J. Anderson. 1984. An analysis of the factors associated with lawsuits against public accountants. The Accounting Review (April): 242-263.
Stice, J. D. 1991. Using financial and market information to identify pre-engagement factors associated with lawsuits against auditors. The Accounting Review 66 (3): 516-533.
Uzun, H., S. H. Szewczyk, and R. Varma. 2003. Board composition and corporate fraud. Financial Analysts Journal (May/June): 33-43.
Vermeer, T. E. 2003. The impact of SAS No. 82 on an auditor’s tolerance of earnings management. Journal of Forensic Accounting 14: 21-34.