MACRONONE, A NOVEL DIEPOXYLIGNAN FROM BARK OF
MAHKOTA DEWA
(
Phaleria macrocarpa
(
Scheff.
) Boerl.) AND ITS ANTIOXIDANT ACTIVITY
Susilawati
1,2,*, Sabirin Matsjeh
2, Harno Dwi Pranowo
2, and Chairil Anwar
21
Department of Education of Mathematics and Natural Sciences, FKIP, Universitas Riau, Pekanbaru, Indonesia
2
Department of Chemistry, Faculty of Mathematics and Natural Sciences, Universitas Gadjah Mada, Jl. Sekip Utara, Yogyakarta 55281
Received November 3, 2011; Accepted January 12, 2012
ABSTRACT
Mahkota dewa (Phaleria macrocarpa (Scheff.) Boerl.) which is belong to family of Thymelaeaceae is one of Indonesian traditional medicines. Chemical constituent has been isolated from bark of mahkota dewa. Sample was extracted with methanol. Concentrated methanol extract was extracted by n-hexane, chloroform and ethyl acetate. A Compound that separated and purified by column chromatography from ethyl acetate extract is a red spherical crystal (m.p. 94-95 °C). Its spot gave yellow fluorescence at TLC plate (UV366) and has optical rotation of -9.3° (c. 2
mg/mL, methanol). Structure elucidation by UV, IR, 1H-NMR, 13C-NMR and NMR 2 dimension (HMQC, COSY, HMBC and DEPT-135) spectroscopy show that the compound gives a name macronone. Computational chemistry calculation using Hyperchem on the level of semiempirical method PM3 was confirmed the conformation of macronone. DPPH method shows that macronone has lower antioxidant activity compare to the ethyl acetate extract.
Keywords:macronone; diepoxylignan; mahkota dewa; Phaleria macrocarpa (Scheff.) Boerl.; DPPH
ABSTRAK
Mahkota dewa (Phaleria macrocarpa (Scheff.) Boerl.) yang termasuk kedalam famili Thymelaeaceae merupakan salah satu obat tradisional Indonesia. Konstituen kimia telah diisolasi dari ekstrak etil asetat kulit batang mahkota dewa. Sampel diekstrak dengan metanol, dipekatkan kemudian diekstrak dengan n-heksana, khloroform dan etil asetat. Satu senyawa dipisahkan dan dimurnikan dengan kromatografi kolom dari ekstrak etil asetat sebagai kristal bulat anggur berwarna merah (Tl 94-95 °C). Noda pada TLC memberikan fluorisensi gelap (UV366) dan
mempunyai putaran optik -9,3° (2 mg/mL, metanol). Elusidasi struktur dengan spektroskopi UV, IR, 1H-NMR,
13
C-NMR dan NMR 2 dimensi (HMQC, COSY, HMBC dan DEPT-135) menunjukkan senyawa yang diberi nama makronon. Perhitungan kimia komputasi menggunakan Hyperchem pada metode semiempirik PM3 mengkonfirmasi konformasi dari makronon. Metode DPPH menunjukkan bahwa makronon mempunyai aktivitas antioksidan yang lebih rendah dibandingkan dengan ekstrak etil asetat.
Kata Kunci:makronon; diepoksilignan; mahkota dewa; Phaleria macrocarpa (Scheff.) Boerl.; DPPH
INTRODUCTION
Mahkota dewa plant (Phaleria macrocarpa (Scheff.) Boerl.) a Thymelaeaceae, is widely found in Indonesia. This plant has synonym ofPhaleria papuana var warb wichnanmi(val) Back. In English, it is known as crown of God. In Sumatra (Malay) and Depok it is known assimalakama. In Java, it is also called asmakutadewa, makuto rajo,makuto ratuormakuto mewo[1].
Mahkota dewa fruit is frequently and empirically utilized by Indonesian to treat various diseases with satisfactory results [1]. Mahkota dewa is one of Indonesian traditional medicines. Information about the bioactivity test (antimicrobial, brine shrimp, cytotoxic,
pharmacological and antioxidant activity) of the extract or fraction of seed and fruits had been studied intensively. However, isolation and purification of active compound inmahkota dewawas rarely performed.
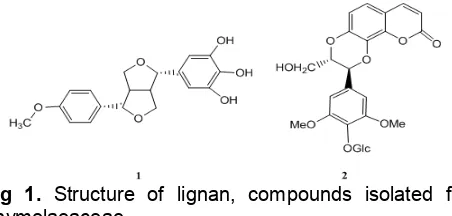
Fig 1. Structure of lignan, compounds isolated from Thymelaeaceae
of its bark gave one compound of benzophenone glucoside [8]
Lignans of culture of mahkota dewa had been extracted and identified [9]. Lignan(1)which was similar with syringaresinol (Lirioresinol B) was 5-[4{4-methoxy- phenyl)-tetrahydrofuro[3,4-c]furan-1-yl]-benzene-1,2,3-triol with molecular formula of C19H20O6. It had been
isolated from ethyl acetate extract ofmahkota dewafruit and separated with column chromatography by step Gradient polarity (SGP) method. This compound had a tendency as a sitostatica compound based on taxonomic approach/chemotaxonomy [4]. While lignan conjugated with coumarin (2) in the form of glucosides had been obtained fromDaphne oleoides (family Thymelaeaceae) [10] (Fig. 1).
This paper reported the isolation and structure elucidation of phenolic compound from the ethyl acetate extract of bark of mahkota dewa and its antioxidant activity. Structure elucidation of isolated compound was performed by means of spectroscopy analyses (UV, IR,
1
H-NMR, 13C-NMR, HMBC, HMQC, COSY and DEPT-135). The measurement of antioxidant activity was performed by DPPH method.
EXPERIMENTAL SECTION
Materials
Bark of mahkota dewa was collected from Universitas Gadjah Mada (UGM), Yogyakarta, Indonesia in January 2009. The plant was identified by Plant Taxonomy Laboratory, Faculty of Biology, UGM. The used chemicals were methanol (technical, distilled) and p.a. (Merck), n-hexane (technical, distilled), ethyl acetate (technical, distilled), chloroform p.a. (Merck), acetone p.a. (Merck), ethanol p.a. (Merck), FeCl3(Merck), DPPH
(Merck).
Instrumentation
Melting point apparatus (Electrothermal 9100), polarimeter (Atago Polax-D), UV-vis spectrophotometer (Spectronic 3000, Genesis 10), Fourier Transformation-Infra Red (FT-IR) spectrophotometer (Shimadzu
internal standard. Mass Spectrophotometer (MS-QP2010S Shimadzu), Column chromatography was conducted using Merck silica gel 60 (70-230 mesh ASTM). Thin Layer Chromatography (TLC) analysis was conducted on precoated Silica gel plates (Merck silica gel GF 254). TLC glass preparative. Software of computational chemistry of HyperChem for Windows version 7.0 (Hypercube).
Procedure
Extraction, Isolation and Identification
One kg of dried bark of mahkota dewa was extracted using macerator (drip pan) with methanol by heating (60 °C) for 7 h then allowed to cool at room temperature for up to 24 h. The residue was macerated for 3 times and all the filtrates were combined (11.5 L) and concentrated using vacuum distillation and rotary evaporator. The methanol extract was partitioned with n-hexane-water. Into the residue of methanol extract, chloroform was added to give chloroform extract and the residue was added with ethyl acetate to produce ethyl acetate extract. Ethyl acetate extract (7 g) was fractionated by column chromatography on silica gel using isocratic elution by n-hexane : ethyl acetate (3:7) to give 7 fractions. The column was eluted by ethyl acetate until give the orange eluate. Having dried by rotary evaporator, orange eluate was obtained in 3.28 g.
The orange eluate (3.28 g) was refractioned by column chromatography using gradient elution by eluents of n-hexane : ethyl acetate (3:7), ethyl acetate, ethyl acetate : methanol (1:1) and methanol. The 5th fraction (+ phenolic with FeCl3) consisted of two spots
in the plate. TLC preparative was then performed with eluents of ethyl acetate : methanol (9:1). The spot with yellow fluorescence was scraped, dissolved in methanol for overnight and filtered. The filtrate was formed crystal at room temperature. It was purified by recrystallization using methanol : water (3:1) and give red spherical crystal after washed by chloroform. Structure elucidation of the crystal was performed using UV, IR, H-NMR, C-NMR, HMQC, COSY, HMBC, DEPT and MS.
Computational Method
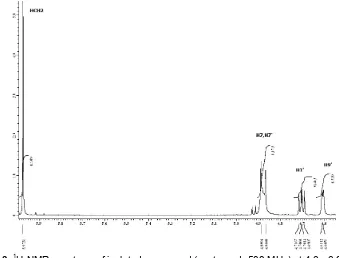
Fig 2.1H-NMR spectrum of isolated compound (acetone d6500 MHz) at 6.6 - 7.1 ppm
Fig 3.1H-NMR spectrum of isolated compound (acetone d6500 MHz) at 4.6 - 6.0 ppm
version 7.0 for Windows using semiempirical, AM1 and PM3 methods.
Method which gave the results of geometry optimization calculations that closest to the experimental data was considered as the most representative semiempirical method for computing the next calculation step. Based on the optimized geometry of isolated compound, all of the possible geometries were studied and the most stable geometry with the lowest energy was obtained to give estimation of UV, IR and NMR spectra.
Antioxidant Activity Test
The measurement of antioxidant activity was performed according to a procedure described previously [11]. Quercetin was used as the standard
antioxidant. DPPH and MeOH were used as the stable free radical reagent and reference, respectively. The sample (isolated compound) was dissolved in MeOH. It was then diluted to give concentrations of 40, 100, 140, 200 and 400 μg/mL. As much as 250 μL of each concentration was transferred to different vials, and add 1 mL DPPH (0.4 mM) and methanol until 5 mL. The absorbance at wavelength of 515 nm was determined after 30 min. The antioxidant activity was measured as the decrease in the absorbance of DPPH and expressed as percentage of the absorbance of control DPPH solution without sample. Color of solution would change from violet to yellow if solution has activity of antioxidant. The IC50 value was defined as
Fig 4.1H-NMR spectrum of isolated compound (acetone d6500 MHz) at 2.9 - 3.9 ppm
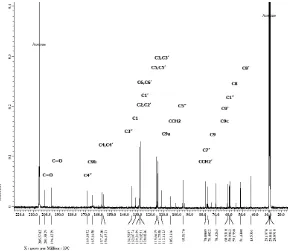
Fig 5.13C-NMR spectrum of isolated compound (acetone d6, 125 MHz)
was expressed as the inhibition percentage of the DPPH radical and was determined by the following equation:
control sample
control
A - A
% TAA = x 100%
A
where TAA was Total antioxidant activity and A was the absorbance.
The data of the activity percentage on concentration variation were then used to determine the
value of IC50 of sample using a linear regression
equation.
RESULT AND DISCUSSION
1
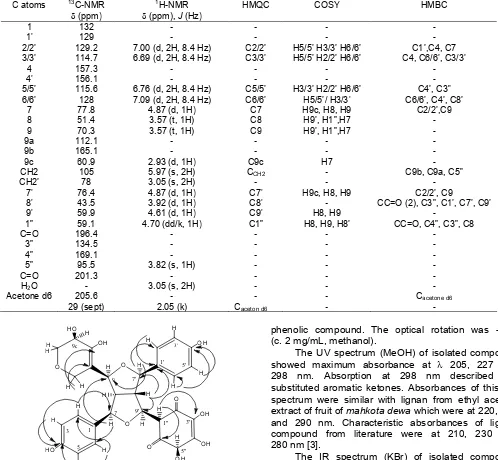
H-NMR (acetone d6500 MHz) and correlation HMQC, COSY and
HMBC of isolated compound C atoms 13C-NMR
(ppm)
Fig 6.Correlation HMBC of macronone
Its spot gave yellow fluorescence at TLC plate (UV366)
with Rf of 0.2 at TLC chromatogram with eluent of n-hexane : ethyl acetate (3:7); 0.4 with n-n-hexane : ethyl acetate (1:9) ; 0.6 with ethyl acetate and 0.8 with chloroform : methanol (8:2). This compound was dissolved in methanol and acetone. The compound was tested with FeCl3 in order to show the presence of
phenolic compound. The optical rotation was -9.3° (c. 2 mg/mL, methanol).
The UV spectrum (MeOH) of isolated compound showed maximum absorbance at 205, 227 and 298 nm. Absorption at 298 nm described the substituted aromatic ketones. Absorbances of this UV spectrum were similar with lignan from ethyl acetate extract of fruit ofmahkota dewawhich were at 220, 240 and 290 nm. Characteristic absorbances of lignan compound from literature were at 210, 230 and 280 nm [3].
O O
OH OH
HO
OH O
O
OH
O
H H
H H
H H
H H
H
OH HO
Note: numeral in bold:ΔPM3smallest, closest to the experimental
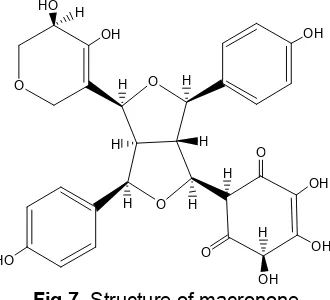
Fig 7.Structure of macronone
Analyses using 1H-NMR and 13C-NMR were performed to elucidate for the structure of isolated compound (Table 1). The 1H-NMR (acetone d6, 500 MHz) data (Fig. 2-4) indicated the presence of 21 H atoms (7 H of hydroxyl were absent). There were signals at δ 7.00, 6.69, 6.76 and 7.09 ppm (doublet, 2H, 8.4 Hz) respectively derived from H2/H2’, H3/H3’, H5/H5’ and H6/H6’ of 2 symmetric aromatic rings.
According to COSY Spectrum, the target compound was presumably of 7,9' : 7',9 diepoxylignan as observed that the presence of eight aromatic protons was correlated each other. This is only possible with the deployment of eight protons in 2 symmetrical aromatic should be the same chemical environment. Based on the value of coupling constant, J, eighth proton have the same J of 8.4 Hz indicated orthocoupling, so inorthoposition each other.
Based on13C-NMR (aceton-d6, 125 MHz) (Fig. 5) and DEPT analyses, isolated compound contained 29 carbon atoms which consisted of 2 ketone C atom at
δ = 201.3 and 196.4 ppm, 8 quarternary C atδ 169.1, 165.2, 157.4, 156.2, 134.5, 132, 129, and 112.1 ppm. Seventeen methine carbons (tertiary carbon) atδ129.2 (2), 128.0 (2), 115.6 (2), 114.7 (2), 95.5, 77.8, 76.4, 70.3, 60.9, 59.9, 59.1, 51.4, and 43.5 ppm. Methylene carbons (secondary carbon) atδ 105.1 and 78.1 ppm. Primary carbon was not detected in DEPT-135.
Table 3. Antioxidant activities of ethyl acetate extract, macronone and quercetin using the free radical-scavenging assay (DPPH)
Compounds Concentrations
(μg/mL) activities (%)Antioxidant
Linear Regression equation
IC50
(μg/mL)
Ethyl acetate extract* 50 52.77 - 47.38
40 24.38
*
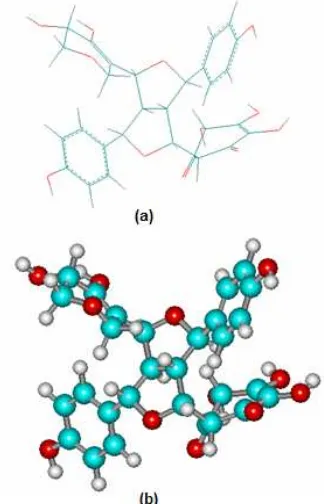
The measurement of antioxidant activity from ethyl acetate extract was performed only one concentrationFig 8.Structure of macronone (Lignan 14 stereoisomer) using PM3 calculation (a) sticks, (b) balls and cylinders
spectrum of 1H-1H COSY represents autocorrelation spectra by connecting the dots signals from protons contained in the spectrum. H2/2’ (7.00 ppm) coupled each other with H3/3’ (6.69 ppm) and H5/H5’ (6.76 ppm). The spectrum of HMBC provided information about the correlation between each proton with the neighboring carbon atom up to 2 bond (1H-C-13C) or 3 bond (1H-CC-13C). H2/2’ (7.00 ppm) correlated with C1’ (129 ppm), C4 (157.3 ppm) and C7 (77.8 ppm). Like that also H7/7’ (4.87 ppm) correlated with the C2/2’ (129.2 ppm) and C9 (70.3 ppm). H8’ (3.92 ppm) correlated with C7’ (76.4 ppm) and C9’( 59.9 ppm). (Table 1, Fig. 6).
Data of MS confirmed the existence of core diepoxylignan at m/z of 260, where value of m/z of 77 was the peak of benzene cation. From the spectroscopy analyses UV, IR, H-NMR, C-NMR, NMR 2 dimension and MS, isolated compound was predicted as derivative of diepoxylignan i.e. macronone (2-(4- (4,5-dihydroxy-5,6-dihydro-2H-pyran-3-yl)-3,6-bis(4- hydroxyphenyl)hexahydrofuro[3,4-c]furan-1-yl)-4,5,6-trihydroxycyclohex-4-ene-1,3-dione) with molecular formula of C29H28O12(Fig. 7).
Macronone has nine chiral C atoms so it had many stereoisomers. Analysis using computational chemistry is needed to support the spectroscopy analysis. This compound was calculated with Hyperchem using semiempirical method (AM1 and PM3). Having applied these methods to this compound, semiempirical method of PM3 analysis was closer with experimental data. The possible conformations of macronone were studied and the closest 13C-NMR to experimental data is lignan 14 (Fig. 8, Table 2).
In this research, antioxidant assay using DPPH method showed IC50 values of macronone and ethyl
acetate extract were 47.38 and 240.14 μg/mL, respectively (Table 3). The IC50value of macronone is
higher, 5 times than ethyl acetate extract; it means that antioxidant activity of macronone is lower, 1/5 times than ethyl acetate extract. So, macronone is not a contributor of prominent to antioxidant activity of ethyl acetate extract from bark ofmahkota dewa.
CONCLUSION
BPPS. The authors thanks to Mrs. Fitni, Mrs. Siti Asfiyah and Mr. Supaya the staff of laboratory of Organic Chemistry of Department of Chemistry UGM for analysis of UV, IR and MS, respectively. We are also thankful to Mrs. Sofa Fajriah from Research Center for Chemistry, Indonesian Institute of Science for analysis of NMR and 2D-NMR, to Mr. Is Suranto, staff of laboratory of Pharmacy Chemistry Faculty of Pharmacy UGM for test of antioxidant activity and to Mr. Idham Darussalam for his helpful reviewing this manuscript.
REFERENCES
1. Harmanto, N., 2005, Mahkota dewa, Gods Heritage Drugs, 1STEd., Agro Media Pustaka, Jakarta. 2. Oshimi, S., Zaima, K., Matsuno, Y., Hirasawa, Y.,
Iizuka, T., Studiawan, H., Indrayanto, G., Zaini, N.C., and Morita, H., 2008,J. Nat. Med., 62, 2, 207–210. 3. Lisdawati, V., Wiryowidagdo, S., Kardono, L., and
Broto, S., 2007,Buletin Penelitian Kesehatan, 35, 3, 115–124.
6. Hartati, M.S., Mubarika, S., Gandjar, I.G., Hamann, M.T., Rao, K.V., and Wahyuono, S., 2005,Indo. J. Pharm., 16, 1, 51–57.
7. Susilawati, Matsjeh, S., Pranowo, H.D., and Anwar, C., 2011,Indo. J. Chem., 11, 2, 180–185.
8. Winarno, H., and Katrin W.E, 2009,Indo. J. Chem., 9, 1, 142–145.
9. Saufi, A, 2007, Lignan in Phaleria macrocarpa (Scheff.,) Boerl., Inaugural-Dissertation, Düsseldorf, Germany.
10. Ullah, N., Ahmeed, S., Muhammad, P., Ahmed, Z., Nawaz, H.R., and Malik, A., 1999,Phytochemistry, 51, 103–105.
11. Molyneux, P., 2004, Songklanakarin J. Sci. Technol., 26, 2, 211–219.
12. Creswell, C.J., Runquist, O.A., and Campbell, M.M., 2005, Spectral Analysis of Organic Compounds, 10thed., ITB, Bandung, Indonesia. 13. Silverstein, R.M., Bassler, G.C., Morrill, and T.C.,