Summary Aboveground respiration of five 8-year-old trees of field-grown hinoki cypress (Chamaecyparis obtusa (Sieb. et Zucc.) Endl.) was nondestructively measured at monthly inter-vals over 1 year with an enclosed standing tree method. The relationship between monthly specific respiration rate and monthly mean relative growth rate at the individual tree level was described by a linear equation. During the dormant season, respiration was used mainly for maintenance purposes, whereas during the growing season, more than 40% of the respiration was used for growth purposes, i.e., 60 to 70% in May. We conclude that annual maintenance and growth respi-ration of a tree are directly proportional to the aboveground phytomass and its annual increment, respectively. The mainte-nance coefficient was estimated to be 0.504 ± 0.039 (SE) kg kg−1 year−1, indicating that the amount respired for maintaining
already existing phytomass was equivalent to about half of the existing phytomass. The growth coefficient was estimated to be 0.772 ± 0.043 (SE) kg kg−1, indicating that the amount
respired for constructing new phytomass was equivalent to about three-fourths of the annual phytomass increment. The annual stand maintenance and growth respiration were, respec-tively, 8.8 Mg ha−1 year−1 for an aboveground biomass of 17.4
Mg ha−1 and 5.0 Mg ha−1 year−1 for an annual stand
above-ground biomass increment of 6.5 Mg ha−1 year−1. About
two-thirds of the total respiration was used to maintain already existing biomass, and about one-third was used to construct new biomass.
Keywords: biomass, biomass increment, relative growth rate, specific respiration rate.
Introduction
Plants respire to produce the energy required for constructing new tissues and maintaining existing tissues. To understand fully the physiological process, it is necessary to know the proportions of energy resulting from respiration that are used for construction and for maintenance (McCree 1970). Several methods have been proposed for separating respiration into maintenance and growth respiration (Hesketh et al. 1971, Thornley 1976, Yokoi et al. 1978, Mariko 1988).
Numerous attempts have been made to separate respiration
into maintenance and growth respiration in herbaceous plants (Amthor 1989), but little is known about woody tree species because their large size has presented technical difficulties (Jarvis and Leverenz 1983, Landsberg 1986, Hagihara and Hozumi 1991, Sprugel and Benecke 1991). As a result, most studies on woody species are not related to whole standing trees but are confined to a small part of stems (Lavigne 1988, Ryan 1990, Sprugel 1990), although Paembonan et al. (1992) continuously measured the CO2 exchange rate of the
above-ground parts of a field-grown 13-year-old Chamaecyparis ob-tusa (Sieb. et Zucc.) Endl. tree over a 3-year period and succeeded in partitioning respiration into maintenance and growth respiration on the basis of McCree’s model (McCree 1970).
Based on the results of a previous study (Yokota et al. 1994), in which monthly measurements of the aboveground respira-tion and phytomass of field-grown 8-year-old C. obtusa trees were nondestructively made over a 1-year period, we have analyzed the relationship among respiration, phytomass and phytomass increment at the individual tree level. We have also scaled up the relationship to the stand level, and estimated annual stand maintenance and growth respiration separately.
Materials and methods Study site
The study was conducted in an 8-year-old (as of 1991) hinoki cypress (Chamaecyparis obtusa) plantation on the campus of the School of Agricultural Sciences, Nagoya University, from March 1991 to February 1992. The study site was almost flat. The general features of the study site were: annual mean temperature = 15.0 °C, annual precipitation = 1543 mm, tree density = 10355 trees ha−1, mean tree height = 3.35 ± 0.05 (SE)
m, and mean stem volume = 3.42 ± 0.16 (SE) dm3 (as of
February 1992).
Plant materials
Five differently sized sample trees were selected for respira-tion measurements. General features of the sample trees in February 1992 are listed in Table 1. Tree height and stem girth at 1 m above the ground of the sample trees ranged from 2.45
Maintenance and growth respiration of the aboveground parts of
young field-grown hinoki cypress (
Chamaecyparis obtusa
)
TAKETO YOKOTA and AKIO HAGIHARA
Laboratory of Forest Ecophysiology, School of Agricultural Sciences, Nagoya University, Nagoya 464-01, Japan
to 3.77 m and from 6.5 to 13.3 cm, respectively. Nondestruc-tive measurements, such as stem girth at 50-cm intervals along the bole and tree height, were obtained monthly for all trees in the stand. The calculation of stem volume was based on Smalian’s equation (e.g., Avery and Burkhart 1994). Stem volume was converted to the corresponding aboveground phy-tomass, including woody stem and foliage, on the basis of an allometric equation between stem volume, vS (dm3 tree−1), and
aboveground phytomass, wT (kg tree−1), i.e., wT = 0.626vS0.954
(Hagihara et al. 1993).
Respiration measurement
The respiration of the sample trees was nondestructively meas-ured with an enclosed standing tree method (Ninomiya and Hozumi 1981, 1983) under field conditions (Yokota et al. 1994). The aboveground parts of the sample trees were en-closed in a chamber made of 0.2-mm thick polyvinyl chloride films (Takafuji Chemical and Synthetic Co. Ltd., Japan). The skirt of the chamber was tied around the base of the stem and was well sealed with clay. The air in the chamber was mixed by a fan to keep the CO2 concentration uniform. Gas samples
from each chamber were collected at hourly intervals from sunset to sunrise. The CO2 concentration inside the chamber
reached 1000--1800 µl l−1 in the summer. This technique may
underestimate CO2 efflux from dark respiration in these trees,
because many studies have reported decreases in dark respira-tion at elevated CO2 (e.g., Bunce 1990, Amthor 1991, Amthor
et al. 1992, Bunce 1992, Wullschleger et al. 1992). However, we did not observe strong inhibition of CO2 efflux (Yokota et
al. 1994).
The CO2 concentration was measured with an infrared gas
analyzer (URA-2S, Shimadzu Seisakusho Ltd., Japan). The aboveground nighttime respiration rate (mg CO2 tree−1 h−1)
was calculated from the increment in CO2 concentration (µl l−1
h−1) of the chamber and then corrected to the monthly mean
respiration rate (g CO2 tree-1 month-1) to take into account the
monthly mean temperature (Yokota et al. 1994). Respiratory consumption was expressed in terms of dry mass using a dry mass/CO2 conversion factor of 0.614 (C6H10O5/6CO2 = 162
g/264 g) (Yoda 1983, Mariko and Koizumi 1993).
Data analysis
The aboveground respiration of a sample tree, r (g tree−1 month−1), was divided into maintenance respiration, which is
proportional to the phytomass, wT (g tree−1), and growth
respi-ration, which is proportional to the phytomass increment, ∆wT
(g tree−1 month−1) (Hesketh et al. 1971):
r=g∆wT+mwT, (1)
where g (g g−1) and m (g g−1 month−1) are the growth and maintenance coefficients, respectively. Dividing both sides by wT and integrating from t1 to t2 with respect to time gave:
where SRR and RGR denote the specific respiration rate and relative growth rate, respectively (Mariko 1988). The mean specific respiration rate ( 1
t2−t1
∫
SRR
t1
t2
dt , g g−1 month−1) and
the mean relative growth rate of phytomass ( 1 t2−t1
∫
Equation 2 indicates a linear relationship between the parame-ters, and coefficients m and g are the Y-intercept and slope of the linear relation, respectively.
Results and discussion
Relationship between specific respiration rate and relative growth rate
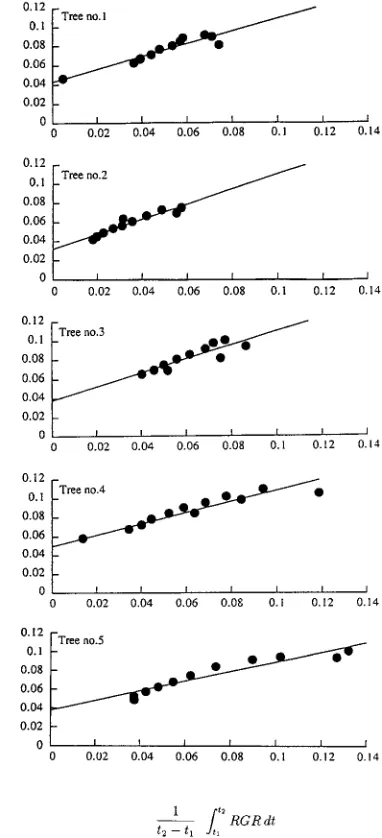
The relationships between mean specific respiration rate,
SRR
to increase with increasing RGR_____. This SRR____--RGR_____ rela-tion was described by the linear equarela-tion in Equarela-tion 2. We therefore applied Equation 2 to this relation to calculate the growth coefficient, g, and the maintenance coefficient, m. The values of g of the sample trees were, in order of tree number, Table 1. General features of the sample trees in February 1992.
Features1 Tree number
1 2 3 4 5
Tree height (m) 3.77 3.05 3.11 2.78 2.45
Stem girth at 1 m above the ground (cm) 13.3 12.7 11.1 8.4 6.5
Aboveground phytomass (kg) 2.56 1.80 1.47 0.83 0.51
Leaf mass (kg) 0.96 0.45 0.48 0.35 0.29
Aboveground phytomass increment2 (kg year−1) 0.94 0.28 0.59 0.32 0.18 Relative growth rate of aboveground phytomass2 (kg kg−1 year−1) 0.39 0.15 0.43 0.43 0.37
1 Aboveground phytomass, w
T (kg tree−1), and leaf mass, wL (kg tree−1), were estimated from stem volume, vS (dm3 tree−1), and stem diameter
at the base of the live crown, DB (cm tree−1), on the basis of allometric equations, i.e., wT = 0.626vS0.954 and wL = 0.0226DB2.452, respectively
(Hagihara et al. 1993).
0.660, 0.786, 0.719, 0.592 and 0.515 g g−1, and the
correspond-ing values of m were 0.0429, 0.0319, 0.0379, 0.0498 and 0.0378 g g−1 month−1.
According to Amthor (1989), who referred to the mainte-nance and growth coefficients of crop plants on the basis of regression methods, maintenance and growth coefficients range from 0.0884 to 3.76 g g−1 month−1 and from 0.0921 to
0.768 g g−1, respectively (if we adopt a dry mass/CO 2
conver-sion factor of 0.614). We determined a growth coefficient ranging from 0.515 to 0.786 g g−1, which is within the upper
limits of the reported values, and a maintenance coefficient
ranging from 0.0319 to 0.0498 g g−1 month−1, which is smaller
than the reported values.
Relationships between the maintenance coefficient and tree size parameters are shown in Figure 2. Although there was no relationship between the maintenance coefficient and above-ground phytomass (Figure 2a), there was a relationship be-tween the maintenance coefficient and the ratio of leaf mass to aboveground phytomass (Figure 2b). The maintenance coeffi-cient tended to increase as the ratio of leaf mass to above-ground phytomass increased, with the exception of Tree 5 (leaf mass of this tree may be overestimated because of its low clear bole length and large stem diameter at the base of the live crown). Figure 2 illustrates that small maintenance coefficient values are associated with large amounts of nonliving tissues, which is a characteristic of woody plants.
Seasonal changes in the contribution of maintenance and growth respiration to total respiration
Seasonal changes in the ratios of maintenance and growth respiration, calculated from Equation 1, to total respiration are shown in Figure 3. The ratio of growth respiration to total respiration increased rapidly in early spring, remained high during the growing season with a maximum value in either May or June, decreased abruptly from July to late summer, decreased gradually throughout the autumn season, and ap-proached zero during the winter. Respiration was used only for maintenance purposes during the dormant season (Jarvis and Leverenz 1983, Ryan 1990, Paembonan et al. 1992) from December to February in Trees 2, 4 and 5, whereas in Trees 1 and 3, some portion of total respiration was used for growth from late autumn to early winter. During the growing season from April to June, growth respiration accounted for more than 40% of total respiration. In May, growth respiration ranged from 59 to 69% of total respiration.
Annual maintenance respiration based on Equation 1 was, in order of tree number, 1.19, 0.67, 0.61, 0.46 and 0.21 kg tree−1 year−1, whereas annual growth respiration was 0.63,
0.29, 0.44, 0.21 and 0.096 kg tree−1 year−1. The ratio of annual
growth respiration to annual total respiration was 34.9, 30.0, 42.2, 31.2 and 30.9%, in order of tree number. In trees with a high relative growth rate, growth respiration accounted for a large proportion of total respiration. Paembonan et al. (1992) reported that, for a 13-year-old C. obtusa tree, the relative value of growth respiration to total respiration was 21%, but the contribution of maintenance respiration tended to increase slightly year by year. In the present study on younger C. obtusa trees, the ratio of growth respiration to total respiration was larger than for the older C. obtusa tree. Because woody plants increase their phytomass with age, maintenance respiration increases, whereas the relative contribution of growth respira-tion may decrease with tree age.
Annual maintenance and growth respiration
The relationship between annual maintenance respiration and aboveground phytomass of the five sample trees is plotted on logarithmic coordinates in Figure 4. We infer from the figure that annual maintenance respiration, rm (kg tree−1 year−1), was
Figure 1. Relationship between monthly mean relative growth rate,
RGR
_____
(g g−1 month−1), and monthly mean specific respiration rate,
SRR
____
(g g−1 month−1). The straight lines were derived from Equa-tion 2: Tree 1, SRR____ = 0.0429 + 0.660 RGR_____ (rxy2 = 0.877, P < 0.001);
Tree 2, SRR____ = 0.0319 + 0.786 RGR_____ (rxy2 = 0.925, P < 0.001); Tree 3,
SRR
____
closely proportional to aboveground phytomass, wT (kg
tree−1):
rm= 0.504wT.
(3)
The proportional constant of 0.504 kg kg−1 year−1 with a
standard error of 0.039 kg kg−1 year−1 may be considered an
average value for the maintenance coefficient of these C. ob-tusa trees. Thus, we conclude that about half of the above-ground phytomass equivalent was consumed for maintenance of existing phytomass.
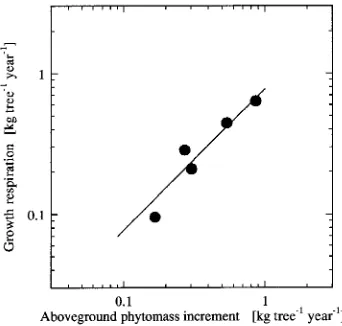
Figure 5 depicts a proportional relationship between annual growth respiration, rg (kg kg−1 year−1), and annual
above-ground phytomass increment, ∆wT (kg tree−1 year−1), of the
sample trees. This relationship may be written in the form:
rg= 0.722∆wT.
(4)
Because the proportional constant of 0.772 ± 0.043 (SE) kg kg−1 is an average value for the growth coefficient of the trees,
we conclude that about three-fourths of the aboveground phy-tomass increment equivalent was consumed in synthesizing new tissues.
Maintenance and growth respiration in the stand
Equations 3 and 4 indicate that the maintenance and growth coefficients may be regarded as constants because they are independent of the physiological functions of the individual trees constituting the stand. Therefore, the respiration scheme Figure 2. Relationships between mainten-ance coefficient and tree size parameters. (a) Relationship between maintenance co-efficient and aboveground phytomass. (b) Relationship between maintenance coeffi-cient and the ratio of leaf mass to above-ground phytomass. The deviating observation is for Tree 5.
Figure 3. Seasonal changes in the contribution of maintenance and growth respiration to total respiration. Tree 1 = d, Tree 2 = ×, Tree 3 = e, Tree 4 = s, and Tree 5 = n.
Figure 4. Relationship between annual maintenance respiration, rm (kg
tree−1 year−1), and aboveground phytomass, wT (kg tree−1). The data
are plotted on logarithmic coordinates. The straight line corresponds to Equation 3 (rxy2 = 0.886, P < 0.005).
Figure 5. Relationship between annual growth respiration, rg (kg
tree−1 year−1), and annual aboveground phytomass increment, ∆wT
at the individual tree level can be scaled up to the stand level:
R=0.504yT+ 0.772∆yT, (5)
where R is the annual aboveground stand respiration (Mg ha−1 year−1), and y
T and ∆yT are, respectively, the aboveground
biomass (Mg ha−1) and its annual increment (Mg ha−1 year−1).
Because the aboveground biomass and its increment in this stand were 17.4 Mg ha−1 and 6.5 Mg ha−1 year−1, respectively
(Yokota et al. 1994), we estimated annual stand maintenance and growth respiration to be 8.8 and 5.0 Mg ha−1 year−1,
respectively. Thus, the relative contributions of maintenance and growth respiration to total respiration are 64 and 36%, respectively, i.e., about two-thirds of the annual respiration was used to maintain already existing biomass, whereas about one-third was used to construct new biomass.
Conclusion
Aboveground respiration of young C. obtusa, based on monthly measurements over 1 year, was analyzed on the as-sumption that the respiration of individual trees can be parti-tioned into two terms: maintenance respiration dependent on phytomass, and growth respiration dependent on phytomass increment (Hesketh et al. 1971). We used the values of the maintenance and growth coefficients, together with stand biomass and its increment, to estimate stand maintenance and growth respiration.
Based on data published for evergreen forest stands, Hagi-hara and Hozumi (1983, 1991) concluded that the relationship among stand respiration, biomass and biomass increment at an inter-stand level could be expressed in the same form as at the individual tree (Equation 1) or intra-stand level (Equation 5). Thus, the maintenance--growth respiration model may be use-ful for describing the interrelationships among respiration and phytomass (or biomass) and its increment on individual, inter-and intra-stinter-and levels.
During the time each year that woody plants add newly produced phytomass to already existing phytomass, woody plants accumulate less active tissues in their internal bodies. This can affect the value of the maintenance coefficient, which is defined as the maintenance respiration rate per unit phy-tomass (Jarvis and Leverenz 1983). On the other hand, the growth coefficient, which is defined as growth respiration per unit phytomass increment, may tend to persist at a constant value over a long period. Therefore, it may not be valid to extrapolate the present results obtained at an early stage of tree growth to older forest stands.
Acknowledgments
We thank Emeritus Prof. K. Hozumi for his encouragement during the study. We also thank Dr. K. Ogawa, Nagoya University, for his gener-ous technical support. Thanks are also due to our colleagues for their assistance in collecting the data and for their helpful suggestions, and to Mr. S.A. Bredu for editing the English text. This study was sup-ported in part by a Grant-in-Aid for Scientific Research (No. 03454073) from the Ministry of Education, Science and Culture, Japan.
References
Amthor, J.S. 1989. Respiration and crop productivity. Springer-Ver-lag, New York, 215 p.
Amthor, J.S. 1991. Respiration in a future, higher-CO2 world. Plant
Cell Environ. 14:13--20.
Amthor, J.S., W.K. George and J.B. Arnold. 1992. CO2 Inhibits
respi-ration in leaves of Rumex crispus L. Plant Physiol. 98:757--760. Avery, T.E. and H.E. Burkhart. 1994. Forest measurements, 4th Edn.
McGraw-Hill, New York, 408 p.
Bunce, J.A. 1990. Short- and long-term inhibition of respiratory carb-on dioxide efflux by elevated carbcarb-on dioxide. Ann. Bot. 65:637--642.
Bunce, J.A. 1992. Stomatal conductance, photosynthesis and respira-tion of temperate deciduous tree seedlings grown outdoors at an elevated concentration of carbon dioxide. Plant Cell Environ. 15:541--549.
Hagihara, A. and K. Hozumi. 1983. Studies on the primary production in a Chamaecyparis obtusa plantation. J. Jpn. For. Soc.
65:357--365.
Hagihara, A. and K. Hozumi. 1991. Respiration. In Physiology of
Trees. Ed. A.S. Raghavendra. John Wiley & Sons Inc., New York, pp 87--110.
Hagihara, A., T. Yokota and K. Ogawa. 1993. Allometric relations in hinoki (Chamaecyparis obtusa (Sieb. et Zucc.) Endl.) trees. Bull.
Nagoya Univ. For. 12:11--29.
Hesketh, J.D., D.N. Baker and W.G. Duncan. 1971. Simulation of growth and yield in cotton: respiration and the carbon balance. Crop Sci. 11:394--398.
Jarvis, P.G. and J.W. Leverenz. 1983. Productivity of temperate, de-ciduous and evergreen forests. In Physiological Plant Ecology IV.
Eds. O.L. Lange, P.S. Nobel, C.B. Osmond and H. Ziegler. Sprin-ger-Verlag, Berlin, pp 233--280.
Landsberg, J.J. 1986. Physiological ecology of forest production. Academic Press, London, 198 p.
Lavigne, M.B. 1988. Stem growth and respiration of young balsam fir trees in thinned and unthinned stands. Can. J. For. Res. 18:483--489. Mariko, S. 1988. Maintenance and constructive respiration in various organs of Helianthus annuus L. and Zinnia elegans L. Bot. Mag. Tokyo 101:73--77.
Mariko, S. and H. Koizumi. 1993. Respiration for maintenance and growth in Reynoutria japonica ecotypes from different altitudes on
Mt. Fuji. Ecol. Res. 8:241--246.
McCree, K.J. 1970. An equation for the rate of respiration of white clover plants grown under controlled conditions. In Prediction and Measurement of Photosynthetic Productivity. Ed. I. Šetlík. PUDOC, Wageningen, pp 221--229.
Ninomiya, I. and K. Hozumi. 1981. Respiration of forest trees. I. Measurement of respiration in Pinus densi-thunbergii UYEKI by an enclosed standing tree method. J. Jpn. For. Soc. 63:8--18. Ninomiya, I. and K. Hozumi. 1983. Respiration of forest trees. II.
Measurement of nighttime respiration in a Chamaecyparis obtusa
plantation. J. Jpn. For. Soc. 65:193--200.
Paembonan, S.A., A. Hagihara and K. Hozumi. 1992. Long-term respiration in relation to growth and maintenance processes of the aboveground parts of a hinoki forest tree. Tree Physiol. 10:101--110. Ryan, M.G. 1990. Growth and maintenance respiration in stems of
Pinus contorta and Picea engelmannii. Can. J. For. Res. 20:48--57. Sprugel, D.G. 1990. Components of woody-tissue respiration in
young Abies amabilis (Dougl.) Forbes trees. Trees 4:88--98.
Sprugel, D.G. and U. Benecke. 1991. Measuring woody-tissue respi-ration and photosynthesis. In Techniques and Approaches in Forest
Thornley, J.H.M. 1976. Mathematical models in plant physiology. Academic Press, London, 318 p.
Wullschleger, S.D., R.J. Norby and C.A. Gunderson. 1992. Growth and maintenance respiration in leaves of Liriodendron tulipifera L. saplings exposed to long-term carbon dioxide enrichment in the field. New Phytol. 121:515--523.
Yoda, K. 1983. Community respiration in a lowland rain forest in Pasoh, Peninsular Malaysia. Jpn. J. Ecol. 33:183--197.
Yokoi, Y., M. Kimura and K. Hogetsu. 1978. Quantitative relationships between growth and respiration. I. Components of respiratory loss and growth efficiencies of etiolated red been seedlings. Bot. Mag. Tokyo 91:31--41.
Yokota, T., K. Ogawa and A. Hagihara. 1994. Dependence of the aboveground respiration of hinoki cypress (Chamaecyparis obtusa)