Summary Use of soil water and groundwater by open-grown Acer saccharum Marsh. (sugar maple) tree canopies and forests was estimated by measuring transpiration (E) rates using porometry, sap flow methods, and the Bowen ratio method. The Bowen ratio and sap flow methods showed the best agreement; porometer measurements scaled to whole canopies always underestimated E by 15--50%. Trees of different sizes showed very different rates of E. I hypothesized that these differences were due to the differential access of large and small trees to groundwater and soil water, respectively. Transpirational flux was partitioned between soil water and groundwater by tracing the water sources based on their hydrogen stable isotopic composition (δD). Soil water δD varied between −41 and −16‰ seasonally (May to September), whereas groundwater δD was −79 ± 5‰ during the entire growing season. Daily transpiration rates of large (9--14 m tall) trees were significantly higher than those of small (3--5 m tall) trees (2.46--6.99 ± 1.02--2.50 versus 0.69--1.80 ± 0.39--0.67 mm day−1). Small trees also showed greater variation in E during the growing season than large trees. In addition, compared to the large trees, small trees demonstrated greater sensitivity to environmental factors that influence E, such as soil water deficits and in-creased evaporative demand. Over the entire growing season, large trees and forest stands composed of trees > 10 m tall transpired only groundwater. The high rates of water loss from large trees and older forests were likely a result of the influence of an enhanced ‘‘pool’’ of transpirational water in the upper soil layers caused by hydraulic lift (see Dawson 1993b). The hy-draulically lifted water reservoir enabled large trees to use more potential transpirational water during daylight hours than small trees, leading to a greater total water flux. In contrast, small trees and forest stands composed of younger trees almost exclusively used soil water, except during two dry periods when their transpirational water was composed of between 7 and 17% groundwater. Thus groundwater discharge from sugar maple trees and forest stands of different sizes (ages) differs significantly, and large trees and older forest stands have a greater impact on the hydrologic balance of groundwater than small trees and younger forest stands. However, mixed stands (small and large trees) may have a greater overall impact on the
regional hydrologic balance than old stands, because trees in mixed stands draw on both soil water and groundwater reser-voirs and thus can substantially increase total water discharge on scales from tens to hundreds of hectares.
Keywords: Acer saccharum, Bowen ratio, hydrogen stable isotopes, groundwater, sap flow, size class, soil water.
Introduction
Trees of forested ecosystems represent a major route by which water in soils and groundwater aquifers re-enters the hydro-logic cycle. Where these trees obtain their water, how they transport and store this water, and how leaf stomata regulate water loss by the process of transpiration influence the rates and magnitude of water movement along this route. This information can be obtained by understanding the pattern and depth to which trees are rooted and the sources of water taken up by these roots. In addition, it is important to know how different tree species obtain, transport, lose and store the water they do obtain as well as the role that stomata play in regulating water loss at the leaf and canopy levels.
Because tree cover worldwide is currently being reduced by deforestation at rates of nearly 30 ha per minute (Goude 1993, Myers 1993), both the rate and magnitude of water movement through trees and the forests they compose is being signifi-cantly altered (Bruijnzeel 1991). To understand better the im-pact of removing trees on local and regional water balances, we need to understand the physiological, ecological and envi-ronmental factors that influence water loss from trees and forested lands. In addition, as stands are reforested, either by tree planting or by the process of forest succession, we need to understand how tree age and the water sources used by trees of different age classes influence our water use estimates of a given individual during the course of a day, a growing season, and a lifetime. Such information is required to estimate the water balance and productivity of entire forest stands as they develop, and to assess the impact that losing or gaining trees has on rates of soil erosion, biomass turnover and forest biodi-versity (Harvey and Pimentel 1995).
Determining water use by trees and forests from isotopic, energy
balance and transpiration analyses: the roles of tree size and
hydraulic lift
TODD E. DAWSON
Section of Ecology and Systematics, Corson Hall, Cornell University, Ithaca, NY 14853, USA
Received March 2, 1995
In recent years, tree physiologists and forest hydrologists have developed several robust methods for determining rates of water loss from leaves and canopies (Kaufmann and Kelli-her 1991), and for measuring the discharge of water from entire forest stands (Calder et al. 1992). For example, belowground stable isotope determinations of the ratios of deuterium/hydro-gen (δD) and oxydeuterium/hydro-gen-18/oxydeuterium/hydro-gen-16 (δ18O) in water provide a
powerful tool for determining the sources of water used by plants, and thus their rooting depths and patterns (Walker and Richardson 1991, Ehleringer et al. 1991, Ehleringer and Dawson 1992, Flanagan et al. 1992, Dawson 1993a). The δD and δ18O analyses of water have also been used to estimate soil water and groundwater discharge from Eucalyptus forests (Thorburn et al. 1993, Salama et al. 1994).
Aboveground, classical leaf porometry has been used to obtain a measure of water loss through leaf stomata for more than 40 years (Bange 1953, Pearcy et al. 1988, Smith and Hollinger 1991). In the past decade, sap flow methods have been developed to measure water loss rates from groups of leaves on branches and whole-tree canopies (see Jones et al. 1988, Hinckley et al. 1994, and references therein). The sap flow method relies on the relationship between water flux rates through the xylem and the dissipation of heat applied to the stem. Heat flux is used to determine sap flow velocity which can, in turn, be converted to a measure of transpirational water loss (see Èermák et al. 1980). At the whole canopy or stand level, the ratio of sensible to latent heat flux, or the Bowen ratio, can also be used independently to estimate transpira-tional or evapotranspiratranspira-tional water loss (Hatton and Vertessy 1990, Monteith and Unsworth 1990, Malek and Bingham 1993). Taken together, these four methods provide a means of obtaining a comprehensive understanding of tree and forest water use. Forest water balance and the role that trees play in the hydrologic cycle can then be viewed from the leaf to the landscape scales.
In this study, I used hydrogen stable isotope analysis to determine the sources of water used by different sized sugar maple (Acer saccharum Marsh.) trees throughout a day and over the course of a drought-prone growing season. I also determined rates of transpiration using porometric, sap flow and Bowen ratio methods on the same trees during the same time periods. Information was also obtained on the influence on total plant water use of nocturnal water movement through the root system between lower and upper soil levels (termed hydraulic lift) by the largest trees. These data allowed an estimate of how the water sources and water use patterns of different sized (aged) trees influence total water discharge through the forest stands in which they occur. The study was undertaken with the ultimate objective of understanding the role that trees of different ages have on the water balance of a forest to enable determinations of how stand development may impact the hydrologic balance of a forested region. In addition, the data were assessed for their reliability in gauging what the loss of trees might mean for local and regional forest water balances.
Materials and methods
Site description and conditions
The investigation was conducted on small (3--5 m tall) and large (9--14 m tall) open-grown A. saccharum trees. All trees were growing in full sun and were isolated from one another so that their root systems did not overlap. Small trees were growing in an early successional phase in an abandoned field adjacent to the large trees which were growing at the edge of a 30--60-year-old forest near Ithaca, New York, USA (42°26′ N, 76°30′ E). The site is characterized by having a fragipan, or hard pan layer, at the lower part of the rooting zone (about 50--80 cm deep) that naturally prevents upward movement of groundwater to the upper soil layers. However, cracks are present in the fragipan, and the roots of the large trees penetrate this layer and grow into the groundwater aquifer (Dawson 1993b). The average depth of the groundwater table is 3.0 m. The site and soil conditions have been described previously (Dawson 1993b). A description of forest history and the changes in the forest vegetation of the region has been publish-ed in Smith et al. (1993).
Local micrometeorological conditions were monitored from May 5 until September 30, 1993. Soil water potential (Ψsoil ) at
−20 cm deep, and N and W compass directions were deter-mined with screen-caged thermocouple psychrometers (Model PST-55, Wescor Inc., Logan, UT) at 1.5 m away from the bole of five trees in the two different tree size classes. Soil, leaf and air temperatures were measured with 300 µm (soil) and 76 µm lead-constantan thermocouples (± 0.0055 °C). Relative hu-midity inside and outside the canopies was measured with a shielded Vaisala HMP35C temperature/humidity sensor (Vais-ala, Helsinki, Finland), photosynthetically active radiation (PAR at 400--700 nm) was measured with an LI-190SB quan-tum sensor (Li-Cor Inc., Lincoln, NE), and precipitation was determined with a TE525 tipping bucket rain gauge (Texas Electronics, Dallas, TX). All sensors were monitored every 5 s and averaged every 30 min by means of a computerized data acquisition system (Model CR7, Campbell Scientific Inc., Logan, UT). Slight diurnal variations in soil temperature (± 1.13 °C), which can cause as much as a 0.32 MPa error in the determination of Ψsoil , were corrected for following the
recommendations of Brown and Bartos (1982) and the proce-dures outlined in Dawson (1993b).
Stable isotope measurements
the exception of salt-excluding mangroves (Lin and Sternberg 1993), plants do not fractionate water during the uptake proc-ess (Dawson and Ehleringer 1991). As a result, the isotopic composition of water contained within the xylem can be used to trace the source, or sources, from which a plant is drawing its water, provided that these water sources and their isotopic variation can be characterized. Moreover, if trees of different sizes root to different depths, sampling the water in their xylem should reflect the zone from which they draw water. Soil water samples were collected twice every 10 days at 0600 and 2100 h EST. Cores were collected to a depth of 25 cm (fine root depth, Dawson 1993b) and extracted, and the lowest 10 cm of the core (−15 to −25 cm) immediately removed and stored in airtight Teflon containers. During each sampling period, one core was taken along each cardinal compass direction, and 1.6--2.0 m away from the bole of five trees in each of the two size classes. Groundwater from a well drilled 60 m from the site and water from the nearest stream to the sample trees were also collected at each sampling date (n = 3 for each water source). Nongreen stem tissue samples were collected from the same trees around which soil samples were collected (n = 5 per tree). The bark was immediately removed from the stem samples and stored in airtight Teflon vials. Details of the stem sampling have been described by Dawson and Ehleringer (1993a).
Water was extracted from stem tissues and soil samples by cryogenic vacuum distillation. The final extracts were sealed under a slight vacuum in 9-mm Pyrex glass tubes. Each sample was prepared for the analysis of its isotopic ratio by reacting a 5 µl (mm3) subsample of water within a clean capillary tube
with a zinc foil catalyst (a gift from J.M. Hayes at the Depart-ment of Chemistry, Indiana University) in an evacuated Vycor glass (7 mm) tube for 1 h at 550 °C (modified from Dawson 1993b). The hydrogen gas resulting from combustion was analyzed for its isotopic composition on a gas-phase isotope-rationing mass spectrometer (Finnigan Model delta S or MAT 252, San Jose, CA). The ratio of deuterium to hydrogen (D/H or δD) in each water sample was expressed according to the delta notation in parts per thousand relative to the standard (Dawson 1993a):
with sample precision equal to ± 1.0‰ and 0.01‰ for the delta S and MAT 252 machines, respectively. The proportion of each water source used by each tree in each of the two size classes was calculated using a modified two-end member mix-ing model developed by Dawson (1993b). This mixing model permits the determination of how much soil water is derived from the process of hydraulic lift by deeply rooted trees access-ing groundwater (see Dawson 1993b).
Leaf-level measurements
Maximal daily stomatal conductance to water vapor (gs) was
measured using a null balance porometer (Model LI-1600, Li-Cor Inc.) between 1000 and 1230 h EST on seven sunlit leaves at midcanopy on each of the five trees in each size class.
Transpiration (E) was calculated as:
E = gs∆w, (2)
where ∆w is the leaf-to-air vapor pressure gradient determined from measurements of relative humidity and the leaf saturated vapor pressure, from leaf temperature following Pearcy et al. (1988). The leaf-level transpiration values were scaled-up to whole-tree values by first estimating the total leaf area of each tree, based on the methods and regressions derived for A. sac-charum by Yang and Tyree (1994), and then multiplying leaf E by the estimated leaf area for each tree. This method is more robust than direct scaling estimates based only on basal trunk diameter--leaf area relationships, because the estimate of leaf area is based on both basal and branch diameters (Yang and Tyree 1994). Leaf water potential was determined on seven sunlit leaves with a pressure chamber (Model 1000, PMS Instruments Inc., Corvallis, OR) following the protocol out-lined in Dawson and Ehleringer (1993b).
Sap flow measurements
From May 6 to September 28, 1993, sap flow was continuously monitored on five trees in each of the two size classes with several dual-sensor heat-pulse systems installed 180° apart to a depth of 10 mm in the sapwood (Model SF300, GreenSpan Technology Ltd., Warwick, Queensland, Australia). Each sen-sor unit has a central heater probe and two temperature sensen-sors, at 10 mm above and 5 mm below the heater, installed in holes drilled horizontally into the sapwood. The upper and lower temperature sensors are used to detect the convective and conductive heat flux, respectively, after a short (0.5--1.5 s) heat pulse. Sap velocity was calculated according to the procedures outlined in Swanson and Whitfield (1981) and Green and Clothier (1988). Measurements were collected every 30 min with a controller/data logger unit attached to each sensor. Estimations of sap flux density followed the methods of Thor-burn et al. (1993). Two complete sap flow units (one in each of two trees in each size class) were randomly moved among the 10 sample trees every 5 days during the study. Because sap velocity varies two- to sixfold across the sapwood of A. sac-charum (Dawson and Pausch, unpublished data), a weighted-average method was used to integrate sap velocity across the thickness of the sapwood (Thorburn et al. 1993). Sapwood area, volume, thickness and water content, and the specific gravity of the wood were determined by extracting two perpen-dicular cores from each of the sample trees each month. Monthly estimates of sapwood parameters were used because they change over time and can introduce errors of > 40% into the water use estimates (Dawson and Pausch, unpublished data).
proce-dure similar to that outlined by Hinckley et al. (1994). The method is based on determinations of the biometric data of each study tree, m2 leaf area per m2 ground area, the radiation balance (W m−2), and the slope and intercept from regressions of sap flow versus xylem basal area (following Èermák et al. 1980). Sap flow measurements were made both day and night, and the daily totals (see Table 2) are based on a 24-h period because A. saccharum continues to take up and lose water even at night (Dawson and Pausch, unpublished data). Because water loss rates are determined on an LAI basis, differences observed among individual trees are absolute differences and not the result of among-tree differences in the amount of leaf area from which water is lost.
Energy balance measurements
To obtain an independent estimate of tree canopy E rates, the Bowen ratio was determined using an apparatus described by Malek and Bingham (1993) as modified for forest energy balance/evapotranspiration work by Black and McNaughton (1971) and Hatton and Vertessy (1990). Parameters used in calculating the Bowen ratio were collected every 30 min for 96-h periods by means of a solar powered (Model MSX10) computerized data acquisition system (Model CR10) and an SM192 data storage module (Campbell Scientific Inc.). This system was interfaced with 76-µm lead-constantan thermo-couples (n = 5, ± 0.0055 °C), DEW-10 chilled mirror hygrome-ters (n = 2, General Eastern Corp., Watertown, MA) for measuring the dew point temperature difference (± 0.003 °C), a total solar radiation sensor (LI-200X pyranometer, Li-Cor Inc.), a net radiation sensor (Model Q-6 net radiometer, Radia-tion and Energy Balance Systems Inc., Seattle, WA), an HFT-3 soil heat flux plate installed at −8 cm deep (Radiation and Energy Balance Systems Inc.), and a wind speed and direction indicator (R.M. Young, Model 3001 Wind Sentry System, Traverse City, MI). Lower and upper sensors were placed 1.5 m apart at 1.5 and 3 m, respectively, above the closest plant parts in a uniform herb-covered field with a 240 m wind fetch or above both small and large tree canopies in June and July (peak season). All calculations follow those outlined in Malek (1992) and Malek and Bingham (1993) and assume a negli-gible canopy heat storage and PAR storage (Hatton and Vertessy 1990).
Results
Rainfall was slightly above normal during the study period (147 mm); however, there were three periods during the season when Ψsoil at a depth of 20 cm declined to between −1.25 and
−1.80 MPa (Figure 1). During these short-term drought peri-ods, trees began to exhibit significant leaf water stress at midday (Ψleaf = −1.11 to −2.07 ± 0.45 MPa) and underwent
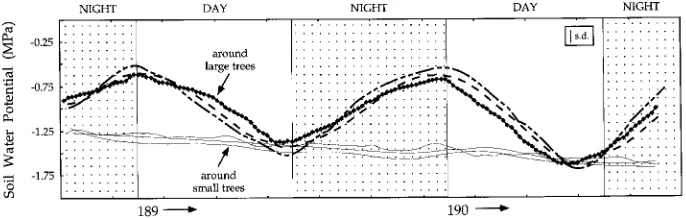
midday stomatal closure. In addition, in the rooting zone around large trees, there was a diel change in Ψsoil of
approxi-mately 0.4 to 1.0 MPa, representing a rewetting of the upper soil layer caused by passive water loss from the root system into the drier upper soil layers (Figure 2). This phenomenon has been termed ‘‘hydraulic lift’’ (Richards and Caldwell 1987) and occurs when water is taken up by deep roots from the groundwater aquifer, transported upward in the root system and then ‘‘leaks’’ out of very small diameter roots into a drier upper soil layer which is at a lower water potential. For large trees, as much as 80 l of water is moved into the upper soil layers in this manner each night (Emerman and Dawson, unpublished observations).
Stable isotope results
The stable hydrogen isotopic compositions (δD) of the soil and groundwater, the local stream water and the tree xylem sap differed significantly (Table 1). Soil water δD varied between −41 and −16‰ seasonally, whereas groundwater δD was −77
Figure 1. The average soil water potential at 20 cm depth (MPa, dashed line) and leaf water potential (MPa, solid line) during the 1993 grow-ing season showgrow-ing several periods of water stress. The standard deviation (s.d.) of the grand mean for all data is shown. The line representing leaf water potential is an average of both small and large trees, but it should be noted that large trees always had higher leaf water potentials than small trees (see Figure 5).
Figure 2. Diel pattern of average soil water potential (MPa) around the root systems of three large (bold lines) and three small (thin lines)
± 6‰ during the entire growing season. Stream water was slightly more positive and showed more variation in δD than groundwater (−69 ± 11‰). Analysis of the δD of xylem sap extracted from large trees indicated that these trees were using only groundwater (Figure 3). In contrast, small trees used almost exclusively soil water (Figure 3) except during two dry periods in July (Figure 1) when the water extracted from their transpirational stream was determined, by the mixing model calculations, to be composed of between 7 and 17% ground-water (see July in Figure 3).
Leaf-level responses: stomatal conductance
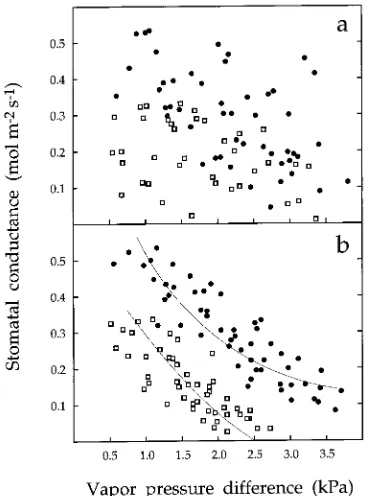
At a given vapor pressure difference (∆w), stomatal conduc-tance to water vapor (gs) was generally 1.5- to 5-fold higher in
large trees (Figure 4) than in small trees. Interestingly, there was no significant relationship between gs and the difference
in saturated vapor pressure when ∆w was referenced to the bulk air 3 m above the leaf surface (Figure 4a). An identical re-sponse was reported by Meinzer et al. (1993) for the tropical
lowland forest tree, Anacardium excelsum L. However, when the leaf and leaf surface were used as the temperature reference points to calculate ∆w, there was a strong decline in gs as ∆w
increased (Figure 4b). Stomatal conductanceof small trees declined more quickly, i.e., they were more sensitive and reached stomatal closure sooner than large trees.
Canopy-level responses: sap flow and Bowen ratio
Sap flow measurements showed that large trees possessed higher maximal E rates than small trees (Figure 5). In addition, Table 1. The stable hydrogen isotopic composition (δD, ‰) of local water sources (soil water, groundwater and stream water) and the xylem sap
δD for small and large trees during each month of the growing season. Values are means (n = 5, ± SD). Soil water δD values were statistically different from both groundwater and stream water δD values during all periods, but groundwater and stream water were not different from each other (t-test, P < 0.05). For all time periods, small trees were statistically different from large trees.
May June July August September
Water source
Soil water at −20 cm −33 ± 7 −28 ± 13 −19 ± 7 −22 ± 10 −30 ± 6
Groundwater −78 ± 5 −76 ± 7 −81 ± 3 −80 ± 4 −78 ± 7
Stream water −70 ± 6 −64 ± 8 −58 ± 6 −62 ± 8 −64 ± 5
Xylem sap
Small trees −33 ± 8 −30 ± 9 −27 ± 8 −29 ± 10 −29 ± 7
Large trees −79 ± 5 −77 ± 6 −80 ± 3 −80 ± 5 −79 ± 6
Figure 3. The stable hydrogen isotopic composition (δD, ‰) of water extracted from the xylem sap of small (s) and large (d) trees of Acer
saccharum at the midpoint of each month during the 1993 growing season. The solid band across the top of the figure represents the range of soil water δD values observed at this site during the period. The stippled band across the bottom of the figure is the range of ground-water δD values observed at this site during the period. As shown, two small trees used some groundwater during the July drought period (see Figure 1).
at any given leaf water potential (Ψleaf ), small trees exhibited
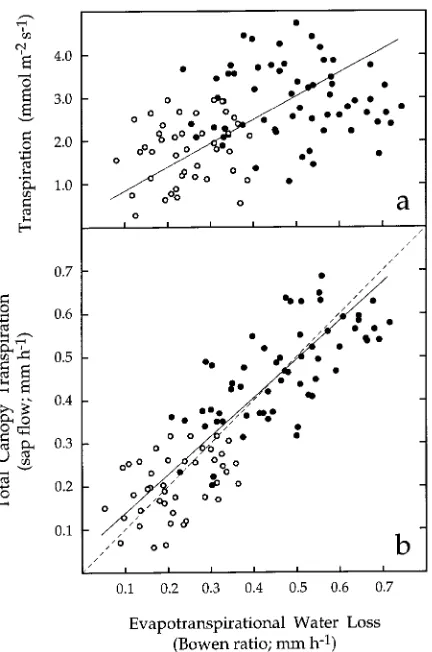
a lower canopy transpiration rate than large trees (Figure 5). When leaf-level transpiration rates (ELL , Equation 2),
deter-mined by porometry, and canopy transpiration rates (ESF ),
determined with sap-flow gauges, were plotted against stand-level evapotranspirational water loss, determined from the Bowen ratio energy measurements (EBR ) (Figure 6), it was
apparent that there was a better correspondence between ESF
and EBR (Figure 6b) than between ELL and EBR (Figure 6a).
Also, there was reasonably good correlation (R2 = 0.673) between ESF and EBR (Figure 6b) that closely followed the 1/1
line. In contrast, the correlation between ELL and EBR
(Fig-ure 6a) was much more variable (R2 = 0.247) and did not show a 1/1 relationship.
Daily and stand-level water loss estimates
When all the measures of E were scaled up and daily estimates of water loss (mm day−1, Table 2) were calculated, it was clear that daily ELL was always the lowest and always
underesti-mated water loss relative to the sap flow and Bowen ratio data (Table 2). As also seen for hourly rates (Figure 6), the best correlation between the two methods for determining daily water loss was observed between ESF and EBR . Also, the
variation in daily estimates of E was slightly lower for ESF and
EBR than for ELL . Despite the differences observed among the
three methods, all daily estimates of E showed that small trees have lower water loss rates than large trees. These data suggest that forests composed of small trees will have lower water loss rates than forests composed of large trees. In addition, total
water loss and use changed significantly over the growing season in both small and large trees, reaching its peak in August and September when ∆w was at a maximum (com-pared to June and July, Table 2).
Based on energy balance measurements, the midday maxi-mum radiation received at the site ranged from 949 to 217 W m−2 during the driest period of the growing season (July) and from 1107 to 333 W m−2 during the wetter periods (May--June and August--September, Figure 1). Based on these values and temperatures at the site, which ranged between 36.8 and 16.4 °C, the average daily water loss from small trees was between 0.69 and 1.80 (± 0.39--0.67) mm day−1, whereas the
average water loss from large trees was between 2.46 and 6.99 (± 1.02--2.50) mm day−1. These data provide additional
evi-dence that forests composed of large trees use and recycle two to five times more water than forests composed of small trees (Table 2).
Figure 5. The relationship between maximal midday canopy transpi-ration estimated from sap flow data (mm h−1) and midday leaf water potential (MPa) for small (open symbols) and large (closed symbols) trees during the early (squares) and late (circles) July drought periods shown in Figure 1. Simple linear regression analyses showed that the slopes of the relationships were not significantly different from one another (P = 0.4936) for the two tree size classes, but the intercepts were different (P = 0.0419, R2 = 0.565 for large trees, R2 = 0.629 for small trees).
Figure 6. The relationship between maximal midday (a) leaf-level transpiration (ELL , mmol m−2 s−1), (b) canopy transpiration (ESF , mm
h−1) and stand level evapotranspirational water loss determined by the Bowen ratio (EBR , mm h−1) for small (s) and large (d) trees of Acer
saccharum. The slope of the correlation between ELL and EBR in (a)
was less than one with a high degree of variation (R2 = 0.247, P = 0.0572), whereas the slope of the correlation between ESF and EBR in
Discussion
The influence of tree size and hydraulic lift on water balance
The study provided four lines of evidence indicating that water uptake and water use by small and large sugar maple trees have an important impact on the hydrologic balance of different aged forests. First, all of the methods used indicated that small trees had lower overall rates of water loss at both the leaf and canopy levels than large trees. Second, water stress, whether due to increasing ∆w or decreasing Ψleaf , had a greater impact
on the rates of water loss from small trees compared with large trees. The small trees used only soil water (Table 1) and did not carry out hydraulic lift, whereas large trees used groundwater and carried out hydraulic lift (Figure 2). It is known that the process of hydraulic lift creates a second, shallow water reser-voir in the soil from which large trees can draw an additional pool of transpirational water during daylight hours (Dawson 1993b), thereby permitting a greater total water flux. Third, forest stands composed of small trees lose two to five times less water than forest stands composed of large trees (Figures 3--6, Table 2). This is partly because small trees only have access to soil water, which is more susceptible to large oscillations in water potential (content) than groundwater. When the soil water potential is low, small trees close their stomata and reduce E. Such a response means that forest stands composed of small trees will have lower total water loss on an hourly, daily or seasonal basis compared with older forests with large trees. Fourth, it is likely that forest stands composed of both small and large trees have overlapping root systems that use different water sources and hence have a greater influence on the hydrologic balance of a region than even-aged stands, because large trees that conduct hydraulic lift ‘‘replenish’’ the soil water pool each night with 40--80 l of groundwater (Emer-man and Dawson, unpublished observations), thereby increas-ing the water available to small trees. That is, water consumption and hence discharge within a mixed stand is likely to be much greater than within an even-aged stand because trees of all size classes will tap and use both soil water
and groundwater as well as soil water derived by the process of hydraulic lift.
The influence and regulatory role that trees play in water movement through forests stands are poorly understood. For example, it is not known how stomatal closure influences whole canopy or stand water balance, or how the water rela-tions traits (e.g., hydraulic lift) possessed by different trees influence stand water balance. I have found that large A. sac-charum trees take up, use, move and lose water very differently from small trees. Furthermore, the ability of a large maple tree to conduct hydraulic lift enhances daily E rates and stand water loss well beyond that of small maple trees and also beyond that expected for other tree species of comparable size that do not perform hydraulic lift. For example, Hinckley et al. (1994) estimated that water loss from hybrid poplar trees of similar size to the large maple trees was between 3.64 to 4.81 mm day−1, which is only about half of the highest rate of water loss measured in this study for a large maple tree (9.08 mm day−1).
On a canopy or leaf basis, poplar should have a higher daily E than maple; however, the addition of the shallow soil water source created by hydraulic lift coupled with nighttime E that can be as much as 18% of total daily E (Dawson, unpublished data) permits large sugar maple trees to take up and lose more water on a daily basis (Table 2) than poplar trees and accounts for the high ‘‘daily’’ rates of E in large maple trees.
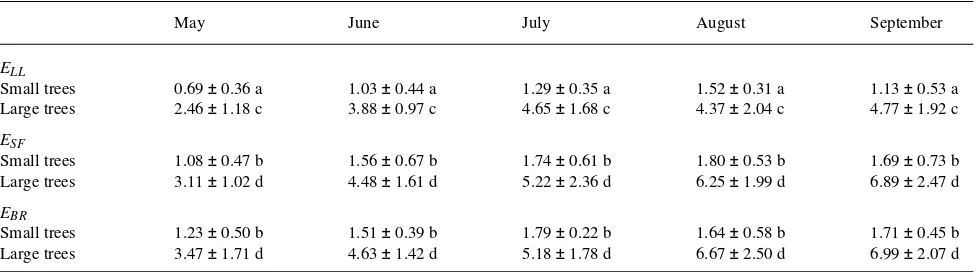
At the stand level, the different water use patterns of small and large trees affect how well a tree canopy is coupled to the atmosphere that surrounds it (Jarvis and McNaughton 1986). The degree to which a leaf or tree canopy is decoupled from the bulk air (know as Ω; McNaughton and Jarvis 1983, Mein-zer et al. 1993) depends, in part, on the water loss rates from the transpiring surface and thus the extent to which the air in the boundary layer between the transpiring surface and the bulk air around it is humidified by the plant itself (Martin 1989). All else being equal, the higher rates of E in the large trees should cause a greater degree of decoupling (higher Ω) and thus a greater degree of environmentally controlled water loss (Meinzer et al. 1993) from large trees and older forests than from small trees and younger forests. This would also Table 2. Total daily transpiration rates (E, mm day−1) for small and large trees during each month of the growing season determined from scaled-up leaf-level measurements (ELL ), sap flow measurements (ESF ) and Bowen ratio estimates (EBR ). Values are means (n = 5, ± SD). Values that were
statistically different from each other within a particular month are marked with different letters (ANOVA, P < 0.05). The ANOVA also showed a significant effect of time on all measurements of E for both size classes, and across all time periods, small trees were always different from large trees (P < 0.01).
May June July August September
ELL
Small trees 0.69 ± 0.36 a 1.03 ± 0.44 a 1.29 ± 0.35 a 1.52 ± 0.31 a 1.13 ± 0.53 a Large trees 2.46 ± 1.18 c 3.88 ± 0.97 c 4.65 ± 1.68 c 4.37 ± 2.04 c 4.77 ± 1.92 c
ESF
Small trees 1.08 ± 0.47 b 1.56 ± 0.67 b 1.74 ± 0.61 b 1.80 ± 0.53 b 1.69 ± 0.73 b Large trees 3.11 ± 1.02 d 4.48 ± 1.61 d 5.22 ± 2.36 d 6.25 ± 1.99 d 6.89 ± 2.47 d
EBR
mean that Ω (decoupling) will increase as a forest stand ages (McNaughton and Jarvis 1983). I am currently testing the hypothesis that stomatal control over water loss at the canopy and stand levels is less in old maple forests than in young maple forests.
Linking transpiration estimates with stable isotope analyses
Water loss estimates coupled with the stable isotope informa-tion provide a means to assess the impacts that trees of differ-ent size and forests of differdiffer-ent age will have on the hydrologic balance of a local patch of forest, a hydrologic catchment, or an entire region. Thorburn et al. (1993) used a similar approach to determine the extent to which saline groundwater dis-charged through Eucalyptus forests growing in a semi-arid floodplain in Australia. For A. saccharum, small trees and the forests they compose will have a measurable impact on soil water reserves, whereas large trees and the forests they com-pose will have a greater impact on groundwater discharge relative to soil water. Moreover, it is likely that a mixed forest (small and large trees) will have a greater total water loss and overall impact (discharge) on the regional hydrologic balance, because all trees draw on both soil water and groundwater reservoirs, and the soil water pool is replenished each night by the process of hydraulic lift. The hydraulically lifted water source is used the following day by both large and small trees, and allows small trees to continue transpiration when they normally would not.
It is important to note that the methodology employed may have influenced the results. First, use of the weighted-average method to integrate sap velocity across the thickness of the sapwood (Thorburn et al. 1993) based on measurements from only one depth in the sapwood likely underestimated water loss because sap velocity increases with depth in A. saccharum (Dawson and Pausch, unpublished data). The variation in sap flow across the sapwood must be better quantified because it may influence estimates of E. Second, at this site, the stream was 122 m from the nearest tree and 17 m lower. However, because stream water and groundwater were isotopically simi-lar and had simisimi-lar levels of variation early and late in the season, I cannot rule out the possibility that large trees were using stream water, especially in May. Third, unlike the Bowen ratio method which measures total evapotranspiration, the sap flow method only measures E and does not account for water loss from understory plants; however, the tight correlation between sap flow estimates of E (ESF ) and Bowen ratio
esti-mates of E (EBR , shown in Figure 6) suggests that understory
plant water loss was insignificant when estimating water loss on a daily basis. The understory vegetation at this site was minor (2--7% cover) and mostly composed of ephemeral spring herbs and young maple tree seedlings. Moreover, ESF
estimates slightly exceeded EBR estimates (2--6%), which also
suggests that the ground and understory evaporation compo-nent of the Bowen ratio, not accounted for by sap flow meas-urements, was small and insignificant. This finding is similar to that reported by Hatton and Vertessy (1990) for plantation-grown Pinus radiata D. Don in Australia, though in their study, water loss estimates based on ESF exceeded those based on EBR
by 20--30%. They attributed the difference to the method they used to determine the area occupied by a tree.
Scaling water use from leaves to landscapes
A major objective of the research presented here was directed toward scaling water use from leaves to entire forests. Scaling research is needed if we are to understand the fate of many ecological systems exposed to human-induced changes. Our ability to extrapolate information gathered at one scale to another and then to make sound predictions will rely on our ability to make information useful across scales (see Ehlerin-ger and Field 1993). Successful scaling efforts depend on the use of a combination of methods and then the verification, validation and application of these methods across a variety of forest tree species and types. Based on the data shown, I have reservations about using either sap flow or Bowen ratio meas-urements of water loss to determine whole-stand water use. Although the sap flow and Bowen ratio estimates of water loss showed good agreement, further validation of these data incor-porating more rigorous environmental information, such as that obtained from eddy correlation techniques (see Valentini et al. 1991, Baldocchi 1993, Hollinger et al. 1994), is needed to assess the reliability of the water use data obtained by these methods and to determine how far the data can be extrapolated in predicting local and regional forest hydrologic processes. Whitehead and Hinckley (1991) developed a theoretical framework and presented guidelines for collecting the critical leaf, canopy and stand parameters needed to understand water flux through forests. They suggested that the most critical information needed to scale water loss from leaves to stands successfully is water availability, aerodynamic conductance and hydraulic conductance through the soil--plant--atmos-pheric continuum. The sap flow method may be especially important because, under certain conditions, it can adequately measure canopy behavior in relation to these types of variation (see Figure 5).
Acknowledgments
I thank the Andrew W. Mellon Foundation and the National Science Foundation (IBN-9357274) for financial support. I also thank Craig Cook at the University of Utah and Bob Drimmie at the University of Waterloo stable isotope facilities for providing the stable isotope analyses, and Geoff Wilson for providing research assistance. Tom Hatton and Rob Vertessy provided helpful advice concerning sap flow methods and important feedback regarding forest hydrology. Discus-sions with and comments from Dennis Baldocchi, Peter Becker, Tom Gower, David Hollinger, Paul Jarvis, Ray Leuning, Tim Martin, Keith McNaughton and Detlef Schulze during the course of the meeting where these results were first presented were extremely useful in helping me clarify particular issues. Thanks also go to Celia Harvey whose comments were helpful in revising the manuscript.
References
Baldocchi, D.D. 1993. Scaling water vapor and carbon dioxide ex-change from leaves to a canopy: rules and tools. In Scaling Physi-ological Processes----Leaf to Globe. Eds. J.R. Ehleringer and C.B. Field. Academic Press Inc., San Diego, pp 77--114.
Bange, G.G.J. 1953. On the quantitative explanation of stomatal tran-spiration. Acta Bot. Neerl. 2:255--297.
Black, T.A. and K.G. McNaughton. 1971. Psychrometric apparatus for Bowen-ratio determination over forests. Boundary-Layer Meteorol. 2:246--254.
Brown, R.W. and D.L. Bartos. 1982. A calibration model for screen caged Peltier thermocouple psychrometers. USDA Forest Service, Research Paper INT-293, Ogden, UT, 155 p.
Bruijnzeel, L.A. 1991. Hydrological impacts of tropical forest conver-sion. Nat. Resour. 27:85--95.
Calder, I.R., R.L. Hall and P.G. Adlard. 1992. Growth and water use of forest plantations. John Wiley & Sons, New York, 381 p. Èermák, J., J. Huzulak and M. Penka. 1980. Water potential and sap
flow rate in adult trees with moist and dry soil used for the assess-ment of the root system depth. Biol. Plant. 22:34--42.
Dansgaard, W. 1964. Stable isotopes in precipitation. Tellus 16:436--468.
Dawson, T.E. 1993a. Water sources of plants as determined from xylem-water isotopic composition: perspectives on plant competi-tion, distribucompeti-tion, and water relations. In Stable Isotopes and Plant Carbon--Water Relations. Eds. J.R. Ehleringer, A.E. Hall and G.D. Farquhar. Academic Press Inc., San Diego, pp 465--496.
Dawson, T.E. 1993b. Hydraulic lift and plant water use: implications for water balance, performance and plant--plant interactions. Oe-cologia 95:565--574.
Dawson, T.E. and J.R. Ehleringer. 1991. Streamside trees that do not use stream water. Nature 350:335--337.
Dawson, T.E. and J.R. Ehleringer. 1993a. Isotopic enrichment of water in the woody tissues of plants: implications for plant water source, water uptake, and other studies which use stable isotopes. Geochim. Cosmochim. Acta 57:3487--3492.
Dawson, T.E. and J.R. Ehleringer. 1993b. Gender-specific physiology, carbon isotope descrimination, and habitat distribution in boxelder,
Acer negundo. Ecology 74:798--815.
Ehleringer, J.R. and C.B. Field. 1993. Scaling physiological proc-esses----leaf to globe. Academic Press Inc., San Diego, 388 p. Ehleringer, J.R. and T.E. Dawson. 1992. Water uptake by plants:
perspectives from stable isotope composition. Plant Cell Environ. 15:1073--1082.
Ehleringer, J.R., S.L. Phillips, W.F.S. Schuster and D.R. Sandquist. 1991. Differential utilization of summer rains by desert plants. Oecologia 88:430--434.
Eldridge, S., P.J. Thorburn, K.L. McEwan and T.J. Hatton. 1993. Health and structure of eucalypt communities on Chowilla and Monoman Islands of the Murry River floodplain, South Australia. CSIRO Div. Water Resources Report, Glen Osmond, South Austra-lia, 93 p.
Flanagan, L.B., J.R. Ehleringer and J.D. Marshall. 1992. Differential uptake of summer precipitation among co-occurring trees and shrubs in a pinyon--juniper woodland. Plant Cell Environ. 15:831--836.
Gat, J.R. 1980. The isotopes of hydrogen and oxygen in precipitation.
In Stable Isotope Geochemistry. Ed. J. Hoefs. Springer-Verlag, Heidelberg, pp 21--47.
Green, S.R. and B.E. Clothier. 1988. Water use of kiwi fruit vines and apple trees by heat-pulse technique. J. Exp. Bot. 39:115--123. Goude, A. 1993. The human impact on the natural environment.
Blackwell Scientific Publishers, London.
Harvey, C.A. and D. Pimentel. 1995. Effects of oil, water, and wood depletion on biodiversity. Biodivers. Conserv. In press.
Hatton, T.J. and R.A. Vertessy. 1990. Transpiration of plantation Pinus radiata estimated by the heat pulse method and the Bowen ratio. Hydrol. Processes 4:289--298.
Hinckley, T.M., J.R. Brooks, J. Èermák, R. Ceulemans, J. Kuèera, F.C. Meinzer and D.A. Roberts. 1994. Water flux in a hybrid poplar stand. Tree Physiol. 14:1005--1018.
Hollinger, D.Y., F.M. Kelliher, E.-D. Schulze and B.M.M. Köstner. 1994. Coupling of tree transpiration to atmospheric turbulence. Nature 371:60--62.
Jarvis, P.G. and K.G. McNaughton. 1986. Stomatal control of transpi-ration: scaling up from leaf to region. Adv. Ecol. Res. 15:1--49. Jones, H.G., P.J.C. Hamer and K.H. Higgs. 1988. Evaluation of
vari-ous heat-pulse methods for estimation of sap flow in orchard trees: comparison with micrometeorological estimates of evaporation. Trees 2:250--260.
Kaufmann, M.R. and F.M. Kelliher. 1991. Measuring transpiration rates. In Techniques and Approaches in Forest Tree Ecophysiology. Eds. J.P. Lassoie and T.M. Hinckley. CRC Press, Boca Raton, pp 117--140.
Lin, G. and S.L. Sternberg. 1993. Hydrogen isotopic fractionation by plant roots during water uptake in coastal wetland plants. In Stable Isotopes and Plant Carbon--Water Relations. Eds. J.R. Ehleringer, A.E. Hall and G.D. Farquhar. Academic Press Inc., San Diego, pp 497--510.
Malek, E. 1992. Night-time evapotranspiration versus daytime and 24-hour evapotranspiration. J. Hydrol. 138:119--129.
Malek, E. and G.E. Bingham. 1993. Comparison of the Bowen ratio-energy balance and water balance methods for the measurement of evapotranspiration. J. Hydrol. 146:209--220.
Martin, P. 1989. The significance of radiative coupling between vege-tation and the atmosphere. Agric. For. Meteorol. 49:49--53. Meinzer, F.C., G. Goldstein, N.M. Holbrook, P. Jackson and J.
Cav-elier. 1993. Stomatal and environmental control of transpiration in a lowland tropical forest tree. Plant Cell Environ. 16:429--436. McNaughton, K.G. and P.G. Jarvis. 1983. Predicting effects of
vege-tation changes on transpiration and evaporation. In Water Deficit and Plant Growth, Vol. VII. Ed. T.T. Kozlowski. Academic Press, New York, pp 1--47.
Monteith, J.L. and M.H. Unsworth. 1990. Principles of environmental physics. 2nd Edn. Edward Arnold, New York, 291 p.
Myers, N. 1993. Population, environment, and development. Environ. Conserv. 20:205--216.
Pearcy, R.W., E.-D. Schulze and R. Zimmermann. 1988. Measure-ments of transpiration and leaf conductance. In Plant Physiological Ecology: Field Methods and Instrumentation. Eds. R.W. Pearcy, J. Ehleringer, H.A. Mooney and P.W. Rundel. Chapman & Hall, New York, pp 137--160.
Richards, J.R. and M.M. Caldwell. 1987. Hydraulic lift: substantial nocturnal water transport between soil layers by Artemisia triden-tata roots. Oecologia 73:486-- 489.
Salama, R.B., G.A. Bartle and P. Farrington. 1994. Water use of plantation Eucalyptus camaldulensis estimated by groundwater hy-drograph separation techniques and heat pulse method. J. Hydrol. 156:163--180.
Smith, B.E., P.L. Marks and S. Gardescu. 1993. Two hundred years of forest cover change in Tompkins County, New York. Bull. Torr. Bot. Club 120:229--247.
Smith, W.K. and D.Y. Hollinger. 1991. Measuring stomatal behavior.
Swanson, R.H. and D.W.A. Whitfield. 1981. A numerical analysis of heat pulse velocity theory and practice. J. Exp. Bot. 32:221--239. Thorburn, P.J., T.J. Hatton and G.R. Walker. 1993. Combining
meas-urements of transpiration and stable isotopes of water to determine groundwater discharge from forests. J. Hydrol. 150:563--587. Valentini, R., G.E. Scarascia Mugnozza, P. De Angelis and R. Bimbi.
1991. An experimental test of the eddy correlation technique over a Mediterranean ‘macchia’ canopy. Plant Cell Environ. 14:987--994.
Walker, C.D. and S.B. Richardson. 1991. The use of stable isotopes of water in characterizing the source of water in vegetation. Chem. Geol. 94:145--158.
Whitehead, D. and T.M. Hinckley. 1991. Models of water flux through forest stands: critical leaf and stand parameters. Tree Physiol. 9:35--57.