PENJELASAN TEKNIS TECHNICAL NOTES
1. Penghitungan statistik neraca regional yang digunakan di sini mengikuti buku petunjuk yang diterbitkan oleh Perserikatan Bangsa Bangsa yang dikenal sebagai "Sistem Neraca Nasional". Namun, penerapan statistik neraca regional tersebut telah disesuaikan dengan kondisi sosial ekonomi DKI Jakarta.
1. The method used to estimate regional accounts statistics is based on the standard guidelines formed by United Nation known as "System of National Accounts". The implementation of the method however, has been adjusted according to DKI Jakarta social-economic condition.
2. Produk Domestik Regional Bruto (PDRB) pada tingkat regional (provinsi) menggambarkan kemampuan suatu wilayah untuk menciptakan output (nilai tambah) pada suatu waktu tertentu. Untuk menyusun PDRB digunakan 2 pendekatan yaitu sektoral dan penggunaan. Keduanya menyajikan komposisi data nilai tambah dirinci menurut sumber kegiatan ekonomi (sektoral) dan menurut komponen penggunaannya. PDRB dari sisi sektoral merupakan penjumlahan seluruh komponen nilai tambah bruto yang mampu diciptakan oleh sektor-sektor ekonomi atas berbagai aktivitas produksinya. Sedangkan dari sisi penggunaan menjelaskan tentang penggunaan dari nilai tambah tersebut.
"production approach" and
"expenditure approach". The first approach is to measure value added produced by various kinds of economic activities, while the second approach is to measure final uses of the country's output. In other words, GRDP is the sum of total value added produced by all economic sectors (activities) and the way of using it.
3. Penyajian PDRB menurut sektor dirinci
menurut total nilai tambah dari seluruh sektor ekonomi yang mencakup sektor Pertanian; Pertambangan & Penggalian; Industri Pengolahan; Listrik, Gas & Air Bersih; Konstruksi; Perdagangan, Restoran & Hotel; Pengangkutan & Komunikasi; Lembaga Keuangan; dan Jasa-Jasa.
3. GDRP by sector is classified by types of
economic activities such as
4. PDRB menurut penggunaan dirinci menurut komponen pengeluaran konsumsi rumah tangga (termasuk lembaga nirlaba), pengeluaran konsumsi pemerintah, pembentukan modal tetap bruto, perubahan inventori, ekspor dan impor.
4. GDRP by type of expenditures is classified into: Private consumption expenditure (household and non-profit institution); Government consumption
expenditure; Gross fixed capital
formation; Changes in inventories; Exports and Imports.
5. Pengeluaran konsumsi rumah tangga
mencakup berbagai pengeluaran konsumsi akhir rumah tangga atas barang dan jasa untuk memenuhi kebutuhan individu ataupun kelompok secara langsung. Pengeluaran rumah tangga di sini mencakup pembelian untuk makanan dan bukan makanan (barang dan jasa) di dalam negeri maupun di luar negeri. Termasuk pula di sini pengeluaran lembaga nirlaba yang tujuan usahanya adalah untuk melayani keperluan rumah tangga.
5. Household consumption expenditures consist of expenditures incurred by households, which are used for both
individual or collective needs.
Household consumptions are classified into food and non-food (goods and services) expenditures that may take
place in domestic or abroad.
Expenditures here include
expenditures of Nonprofit institutions serving households.
6. Pengeluaran konsumsi pemerintah
mencakup pengeluaran pemerintah untuk belanja pegawai, penyusutan maupun belanja barang (termasuk biaya perjalanan, pemeliharaan dan pengeluaran rutin lainnya), baik yang dilakukan oleh pemerintah pusat maupun pemerintah daerah.
6. Government consumption
expenditures consist of expenditures for the compensation of employees, capital consumption (depreciation)
and intermediate consumption
(including travel allowance,
maintenance cost, and other routine expenditures) spent by either central or local government.
7. Pembentukan Modal Tetap Bruto
mencakup pengadaan, pembuatan dan pembelian barang modal. Barang modal dimaksud adalah barangbarang yang digunakan untuk proses produksi,
tahan lama atau yang mempunyai umur pemakaian lebih dari satu tahun seperti bangunan, mesin-mesin dan
7. Gross fixed capital formation consists of resident producers acquisitions, less disposals, of fixed assets during a given period plus certain addition to the value of non-produced assets done by the productive activity of producer or institutional units. Fixed assets are
tangible and intangible assets
alat angkutan. Termasuk pula di sini perbaikan besar (berat) yang sifatnya memperpanjang umur atau mengubah bentuk atau kapasitas barang modal tersebut. Pengeluaran barang modal untuk keperluan militer tidak dicakup di sini tetapi digolongkan sebagai konsumsi pemerintah.
production that are used by
themselves and repeatedly, or
continuously in process of production
for more than one year. The
expenditure for military purposes are classified as government expenditure not as capital formation.
8. Ekspor barang dan jasa merupakan
transaksi perdagangan barang dan jasa dari penduduk (residen) ke bukan penduduk (non-residen). Impor barang dan jasa adalah transaksi perdagangan dari bukan penduduk ke penduduk. Ekspor atau impor barang terjadi pada saat terjadi perubahan hak kepemilikan barang antara penduduk dengan bukan penduduk (dengan atau tanpa perpindahan fisik barang tersebut).
8. Exports of goods and services consist of transactions of goods and services
from residents to non-residents.
Imports of goods and services consist of transaction of goods and services
from non-residents to residents.
Exports and imports of goods occur when there are changes in ownership of goods between residents and non residents (with or without physical movements of goods across frontiers).
9. Produk Domestik Regional Bruto
maupun agregat turunannya disajikan dalam 2 (dua) versi penilaian, yaitu atas dasar "harga berlaku" dan atas dasar "harga konstan". Disebut sebagai harga berlaku karena seluruh agregat dinilai dengan menggunakan harga pada tahun berjalan, sedangkan harga konstan penilaiannya didasarkan kepada harga satu tahun dasar tertentu. Dalam publikasi di sini digunakan harga tahun 2010 sebagai dasar penilaian.
9. GDRP and its aggregations are presented in two forms: at current market prices and at constant base year market prices. In presenting current market prices, all aggregates are valued at current market prices, while base year constant market prices are shown by valuing all aggregates at fixed base year prices. Year of 2010 is used as the base year in this publication.
10. Laju pertumbuhan Produk Domestik
(tahun sebelumnya), dibagi dengan nilai pada tahun ke n-1, kemudian dikalikan dengan 100 persen. Laju pertumbuhan menunjukkan perkembangan agregat pendapatan dari satu waktu tertentu terhadap waktu sebelumnya.
year n-1 then multiplied by 100 percent. The growth rate of GDRP explains the income growth during the given period.
11. Pendapatan per kapita adalah pendapatan regional atau Produk Domestik Regional Bruto (PDRB) dibagi dengan jumlah penduduk pertengahan tahun.
11. Per capita income is regional income or Gross Domestic Regional Product
(GDRP) divided by mid-year
Gambar PDRB Per Kapita Atas Harga Berlaku dan Atas Dasar Harga Konstan Tahun 2010, 2011-2014
15.1.
Figure GRDP Per Capita at Current Price and GRDP per Capita at 2010
Gambar Laju Pertumbuhan PDRB Atas Dasar Harga Konstan 2010 Menurut Kabupaten/Kota Administratif, 2010-2014
15.2.
Figure The Growth Rate of Gross Regional Domestic Product at 2010 Constant
12. PENDAPATAN REGIONAL / REGIONAL INCOME
Tabel : 12.1. Table
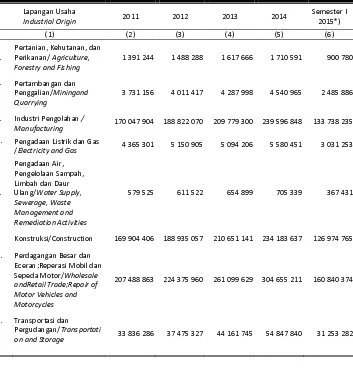
Produk Domestik Regional Bruto Atas Dasar Harga Berlaku Menurut Lapangan Usaha, 2011 – 2015 Semester I
Gross Regional Domestic Product at Current Market Prices by Industrial Origin, 2011– 2015 Semester 1 of a year
(Juta Rupiah / Million Rupiahs)
B. Pertambangan dan Penggalian/Miningand Quarrying
3 731 156 4 011 417 4 287 998 4 540 965 2 485 886
C. Industri Pengolahan /
Manufacturing 170 047 904 188 822 070 209 779 300 239 596 848 133 738 235
D. Pengadaan Listrik dan Gas
/Electricity and Gas 4 365 301 5 150 905 5 094 206 5 580 451 3 031 253
G. Perdagangan Besar dan Eceran;Reperasi Mobil dan
H. Transportasi dan Pergudangan/Transportati
I.
M,N Jasa Perusahaan/ Business
Activities 83 570 794 93 199 640 105 903 828 122 924 324 68 526 341
O.
Administrasi
Pemerintahan, Pertahanan dan Jaminan Sosial Wajib/ Public Administration and Health and Social Work Activities
18 987 046 21 759 582 25 065 342 28 886 967 15 981 772
R,S,T ,U
Jasa Lainnya/ Other
Services Activities 39 072 964 44 177 288 52 398 608 61 783 376 34 416 172
PDRB / GRDP 1 224 218 485 1 369 432 639 1 547 037 777 1 761 407 064 960 331 402
PDRB TANPA MIGAS
GRDP WITHOUT OIL-GAS 1220487329 1365421222 1 542 749 779 1 756 866 099 957 845 516
Catatan / Note : *) Angka Sementara / Preliminary Figures
Tabel : 12.2. Table
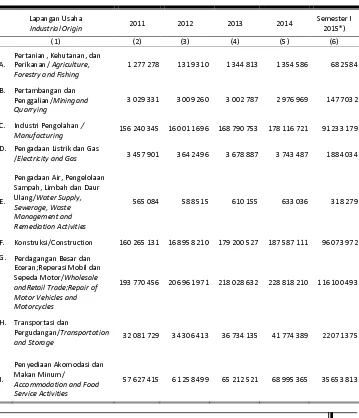
Produk Domestik Regional Bruto Atas Dasar Harga Konstan 2010 Menurut Lapangan Usaha, 2011 – 2015 Semester I
Gross Regional Domestic Product at 2010 Constant Prices by Industrial Origin, 2011– 2015 Semester 1 of a year
(Juta rupiah / Million Rupiahs)
B. Pertambangan dan Penggalian/Miningand Quarrying
3 029 331 3 009 260 3 002 787 2 976 969 1 477 032
C. Industri Pengolahan /
Manufacturing 156 240 345 160 011 696 168 790 753 178 116 721 91 233 179
D. Pengadaan Listrik dan Gas
/Electricity and Gas 3 457 901 3 642 496 3 678 887 3 743 487 1 884 034
E.
Pengadaan Air, Pengelolaan Sampah, Limbah dan Daur Ulang/Water Supply,
G. Perdagangan Besar dan Eceran;Reperasi Mobil dan
H. Transportasi dan
J.
Informasi dan
Komunikasi/Information and Communication
90 736 420 103 212 678 115 748 680 128 573 633 68 521 459
K.
Jasa Keuangan dan Asuransi/Financial and Insurance Activities
114 639 141 125 417 028 135 147 548 141 289 441 73 467 594
L. Real Estat/Real Estate
Activities 79 359 565 84 689 742 88 985 511 93 399 192 48 399 445
M, N
Jasa Perusahaan/ Business
Activities 78 460 803 83 916 951 90 835 653 98 965 444 52 210 301
O.
Administrasi Pemerintahan, Pertahanan dan Jaminan Sosial Wajib/Public Administration and Defence; Compulsory Social Security
61 800 273 62 651 012 60 859 266 61 594 054 30 809 747
P. Jasa Pendidikan/Education 58 684 434 62 220 200 64 427 115 66 798 033 34 866 179
Q.
Jasa Kesehatan dan Kegiatan Sosial/Human Health and Social Work Activities
17 767 543 19 268 301 20 379 279 21 775 260 11 518 506
R,S, T,U
Jasa Lainnya/ Other Services
Activities 37 795 379 41 095 643 44 209 165 47 953 681 25 324 664
PDRB / GRDP 1 147 558 226 1 222 527 925 1 297 195 426 1 374 348 612 710 612 656
PDRB TANPA MIGAS
GRDP WITHOUT OIL-GAS 1 144 528 895 1 219 518 665 1 294 192 639 1 371 371 642 709 135 625
Catatan / Note : *) Angka Sementara / Preliminary Figures
Tabel : 12.3. Table
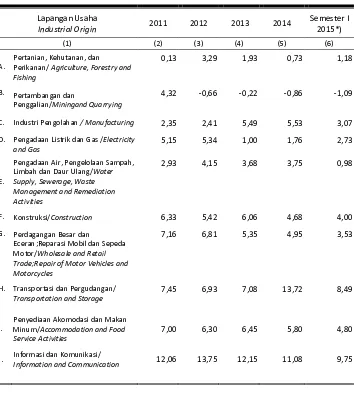
Laju Pertumbuhan Produk Domestik Regional Bruto Atas Dasar Harga Berlaku menurut Lapangan Usaha, 2011 – 2015 Semester I
The Growth Rate of Gross Regional Domestic Product at Current Market Prices by Industrial Origin, 2011 – 2015 Semester 1 of a year
(Persen / Percentage)
A. Pertanian, Kehutanan, dan Perikanan/ Agriculture, Forestry and Fishing
9,06 6,98 8,69 5,74 7,07
B. Pertambangan dan
Penggalian/Miningand Quarrying
28,49 7,51 6,89 5,90 13,11
C. Industri Pengolahan / Manufacturing 11,40 11,04 11,10 14,21 16,28
D. Pengadaan Listrik dan Gas /Electricity and Gas
32,74 18,00 -1,10 9,55 13,41
E.
Pengadaan Air, Pengelolaan Sampah, Limbah dan Daur Ulang/Water Supply, Sewerage, Waste Management and Remediation Activities
5,56 5,52 7,09 7,70 6,36
F. Konstruksi/Construction 12,73 11,20 11,49 11,17 12,39
G. Perdagangan Besar dan
Eceran;Reperasi Mobil dan Sepeda Motor/Wholesale andRetail Trade;Repair of Motor Vehicles and Motorcycles
14,75 8,14 16,37 16,68 10,39
H. Transportasi dan
Pergudangan/Transportation and Storage
13,33 10,75 17,84 24,20 20,67
I.
Penyediaan Akomodasi dan Makan Minum/Accommodation and Food Service Activities
14,30 12,95 14,73 15,80 19,40
J. Informasi dan Komunikasi/Information
and Communication 12,49 12,81 12,81 10,76 9,64
K. Jasa Keuangan dan Asuransi/Financial
L. Real Estat/Real Estate Activities 12,08 8,00 9,57 13,16 11,22
M,
N Jasa Perusahaan/ Business Activities 14,58 11,52 13,63 16,07 16,03
O.
Administrasi Pemerintahan, Pertahanan dan Jaminan Sosial Wajib/Public Administration and Defence; Compulsory Social Security
31,94 15,06 6,50 9,82 10,42
P. Jasa Pendidikan/Education 11,34 13,60 13,95 16,15 16,78
Q.
Jasa Kesehatan dan Kegiatan Sosial/Human Health and Social Work Activities
15,72 14,60 15,19 15,25 15,27
R,S,
T,U Jasa Lainnya/ Other Services Activities 17,14 13,06 18,61 17,91 16,66
PDRB / GRDP 13,86 11,86 12,97 13,86 13,37
PDRB TANPA MIGAS
GRDP WITHOUT OIL-GAS 13,82 11,88 12,99 13,88 13,37
Tabel : 12.4. Table
Laju Pertumbuhan Produk Domestik Regional Bruto Atas Dasar Harga Konstan 2010 Menurut Lapangan Usaha 2011– 2015 Semester I The Growth Rate of Gross Regional Domestic Product at 2010 Constant Prices by Industrial Origin 2011– 2015 Semester 1 of a year
(Persen / Percentage) Perikanan/ Agriculture, Forestry and Fishing
0,13 3,29 1,93 0,73 1,18
B. Pertambangan dan
Penggalian/Miningand Quarrying
4,32 -0,66 -0,22 -0,86 -1,09
C. Industri Pengolahan / Manufacturing 2,35 2,41 5,49 5,53 3,07
D. Pengadaan Listrik dan Gas /Electricity and Gas
5,15 5,34 1,00 1,76 2,73
E.
Pengadaan Air, Pengelolaan Sampah, Limbah dan Daur Ulang/Water Supply, Sewerage, Waste Management and Remediation Activities
2,93 4,15 3,68 3,75 0,98
F. Konstruksi/Construction 6,33 5,42 6,06 4,68 4,00
G. Perdagangan Besar dan
Eceran;Reparasi Mobil dan Sepeda Motor/Wholesale and Retail Trade;Repair of Motor Vehicles and Motorcycles
7,16 6,81 5,35 4,95 3,53
H. Transportasi dan Pergudangan/ Transportation and Storage
7,45 6,93 7,08 13,72 8,49
I.
Penyediaan Akomodasi dan Makan Minum/Accommodation and Food Service Activities
7,00 6,30 6,45 5,80 4,80
J. Informasi dan Komunikasi/
K. Jasa Keuangan dan Asuransi/
Financial and Insurance Activities 3,55 9,40 7,76 4,54 5,16
L. Real Estat/Real Estate Activities 6,67 6,72 5,07 4,96 5,19
M,
N Jasa Perusahaan/ Business Activities 7,57 6,95 8,24 8,95 7,46
O.
Administrasi Pemerintahan, Pertahanan dan Jaminan Sosial Wajib/Public Administration and Defence; Compulsory Social Security
11,87 1,38 -2,86 1,21 1,16
P. Jasa Pendidikan/Education 6,23 6,03 3,55 3,68 6,10
Q.
Jasa Kesehatan dan Kegiatan Sosial/ Human Health and Social Work Activities
8,28 8,45 5,77 6,85 8,07
R,S,
T,U Jasa Lainnya/ Other Services Activities 13,31 8,73 7,58 8,47 7,96
PDRB / GRDP 6,73 6,53 6,11 5,95 5,11
PDRB TANPA MIGAS
GRDP WITHOUT OIL-GAS 6,74 6,55 6,12 5,96 5,13
Tabel : 12.5. Table
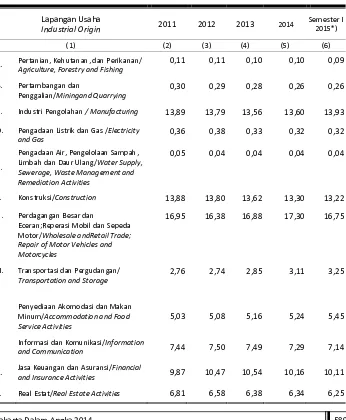
Distribusi Persentase Produk Domestik Regional Bruto Atas Dasar Harga
Berlaku Menurut Lapangan Usaha 2011 – 2015 Semester I Percentage
Distribution of Gross Regional Domestic Product at Current Market Prices by Industrial Origin 2011 – 2015 Semester 1 of a year
(Persen / Percentage)
A. Pertanian, Kehutanan, dan Perikanan/ Agriculture, Forestry and Fishing
0,11 0,11 0,10 0,10 0,09
B. Pertambangan dan
Penggalian/Miningand Quarrying
0,30 0,29 0,28 0,26 0,26
C. Industri Pengolahan / Manufacturing 13,89 13,79 13,56 13,60 13,93
D. Pengadaan Listrik dan Gas /Electricity and Gas
0,36 0,38 0,33 0,32 0,32
E.
Pengadaan Air, Pengelolaan Sampah, Limbah dan Daur Ulang/Water Supply, Sewerage, Waste Management and Remediation Activities
0,05 0,04 0,04 0,04 0,04
F. Konstruksi/Construction 13,88 13,80 13,62 13,30 13,22
G. Perdagangan Besar dan
Eceran;Reperasi Mobil dan Sepeda Motor/Wholesale andRetail Trade; Repair of Motor Vehicles and Motorcycles
16,95 16,38 16,88 17,30 16,75
H. Transportasi dan Pergudangan/ Transportation and Storage
2,76 2,74 2,85 3,11 3,25
I.
Penyediaan Akomodasi dan Makan Minum/Accommodation and Food Service Activities
5,03 5,08 5,16 5,24 5,45
J. Informasi dan Komunikasi/Information
and Communication 7,44 7,50 7,49 7,29 7,14
K. Jasa Keuangan dan Asuransi/Financial
and Insurance Activities 9,87 10,47 10,54 10,16 10,11
Lapangan Usaha
Industrial Origin 2011 2012 2013 2014
Semester I 2015*)
M,N Jasa Perusahaan/ Business Activities 6,83 6,81 6,85 6,98 7,14
O.
Administrasi Pemerintahan, Pertahanan dan Jaminan Sosial Wajib/Public Administration and Defence; Compulsory Social Security
5,95 6,12 5,77 5,57 5,45
P. Jasa Pendidikan/Education 5,02 5,10 5,15 5,25 5,36
Q.
Jasa Kesehatan dan Kegiatan Sosial/ Human Health and Social Work Activities
1,55 1,59 1,62 1,64 1,66
R,S,T,
U Jasa Lainnya/ Other Services Activities 3,19 3,23 3,39 3,51 3,58
PDRB / GRDP 100,00 100,00 100,00 100,00 100,00
PDRB TANPA MIGAS
GRDP WITHOUT OIL-GAS 99,70 99,71 99,72 99,74 99,74
Tabel : 12.6. Table
Distribusi Persentase Produk Domestik Regional Bruto Atas Dasar Harga Konstan 2010 Menurut Lapangan Usaha, 2011 – 2015 Semester I Percentage Distribution of Gross Regional Domestic Product at 2010 Constant Prices by Industrial Origin, 2011 – 2015 Semester 1 of a year
A. Pertanian, Kehutanan, dan Perikanan/ Agriculture, Forestry and Fishing
0,11 0,11 0,10 0,10 0,10
B. Pertambangan dan
Penggalian/Miningand Quarrying
0,26 0,25 0,23 0,22 0,21
C. Industri Pengolahan / Manufacturing 13,62 13,09 13,01 12,96 12,84
D. Pengadaan Listrik dan Gas /Electricity and Gas
0,30 0,30 0,28 0,27 0,27
E.
Pengadaan Air, Pengelolaan Sampah, Limbah dan Daur Ulang/Water Supply, Sewerage, Waste Management and Remediation Activities
0,05 0,05 0,05 0,05 0,04
F. Konstruksi/Construction 13,97 13,82 13,81 13,65 13,52
G. Perdagangan Besar dan Eceran;Reperasi Mobil dan Sepeda Motor/Wholesale andRetail Trade; Repair of Motor Vehicles and Motorcycles
16,89 16,93 16,81 16,65 16,34
H. Transportasi dan
Pergudangan/Transportation and Storage
2,80 2,81 2,83 3,04 3,11
I.
Penyediaan Akomodasi dan Makan Minum/Accommodation and Food Service Activities
5,02 5,01 5,03 5,02 5,02
J. Informasi dan Komunikasi/Information
and Communication 7,91 8,44 8,92 9,36 9,64
K. Jasa Keuangan dan Asuransi/Financial
and Insurance Activities 9,99 10,26 10,42 10,28 10,34
M,N Jasa Perusahaan/ Business Activities 6,84 6,86 7,00 7,20 7,35
O.
Administrasi Pemerintahan, Pertahanan dan Jaminan Sosial Wajib/Public Administration and Defence; Compulsory Social Security
5,39 5,12 4,69 4,48 4,34
P. Jasa Pendidikan/Education 5,11 5,09 4,97 4,86 4,91
Q.
Jasa Kesehatan dan Kegiatan Sosial/Human Health and Social Work Activities
1,55 1,58 1,57 1,58 1,62
R,S,T,
U Jasa Lainnya/ Other Services Activities 3,29 3,36 3,41 3,49 3,56
PDRB/GRDP 100,00 100,00 100,00 100,00 100,00
PDRB TANPA MIGAS
GRDP WITHOUT OIL-GAS 99,74 99,75 99,77 99,78 99,79
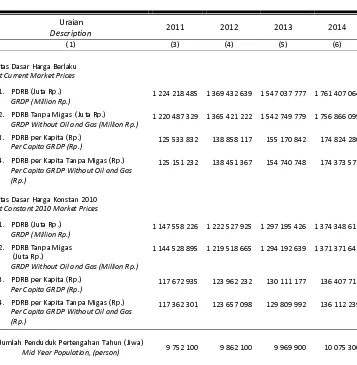
Tabel : 12.7. Table
Pendapatan Agregat dan per Kapita Atas Dasar Harga Berlaku dan Harga Konstan 2010, 2011 - 2014
Aggregate and per Capita Income at Current and 2010 Constant Market Prices, 2011 - 2014
Uraian
Description 2011 2012 2013 2014
(1) (3) (4) (5) (6)
Atas Dasar Harga Berlaku At Current Market Prices
1. PDRB (Juta Rp.)
GRDP (Million Rp.) 1 224 218 485 1 369 432 639 1 547 037 777 1 761 407 064
2. PDRB Tanpa Migas (Juta Rp.) GRDP Without Oil and Gas (Million Rp.)
1 220 487 329 1 365 421 222 1 542 749 779 1 756 866 099
3. PDRB per Kapita (Rp.)
Per Capita GRDP (Rp.) 125 533 832 138 858 117 155 170 842 174 824 280
4. PDRB per Kapita Tanpa Migas (Rp.) Per Capita GRDP Without Oil and Gas (Rp.)
125 151 232 138 451 367 154 740 748 174 373 577
Atas Dasar Harga Konstan 2010 At Constant 2010 Market Prices
1. PDRB (Juta Rp.) GRDP (Million Rp.)
1 147 558 226 1 222 527 925 1 297 195 426 1 374 348 612
2. PDRB Tanpa Migas (Juta Rp.)
GRDP Without Oil and Gas (Million Rp.)
1 144 528 895 1 219 518 665 1 294 192 639 1 371 371 642
3. PDRB per Kapita (Rp.)
Per Capita GRDP (Rp.) 117 672 935 123 962 232 130 111 177 136 407 711
4. PDRB per Kapita Tanpa Migas (Rp.) Per Capita GRDP Without Oil and Gas (Rp.)
117 362 301 123 657 098 129 809 992 136 112 239
Jumlah Penduduk Pertengahan Tahun (Jiwa)
Mid Year Population, (person) 9 752 100 9 862 100 9 969 900 10 075 300
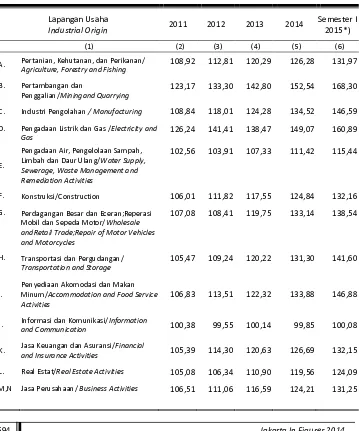
Tabel : 12.8. Table
Indeks Harga Implisit Produk Domestik Regional Bruto Menurut Lapangan Usaha, 2011 – 2015 Semester I
Implicit Prices Index of Gross Regional Domestic Product by Industrial Origin, 2011 – 2015 Semester 1 of a year
Lapangan Usaha
Industrial Origin 2011 2012 2013 2014
Semester I 2015*)
(1) (2) (3) (4) (5) (6)
A. Pertanian, Kehutanan, dan Perikanan/ Agriculture, Forestry and Fishing
108,92 112,81 120,29 126,28 131,97
B. Pertambangan dan
Penggalian/Miningand Quarrying
123,17 133,30 142,80 152,54 168,30
C. Industri Pengolahan / Manufacturing 108,84 118,01 124,28 134,52 146,59
D. Pengadaan Listrik dan Gas /Electricity and Gas
126,24 141,41 138,47 149,07 160,89
E.
Pengadaan Air, Pengelolaan Sampah, Limbah dan Daur Ulang/Water Supply, Sewerage, Waste Management and Remediation Activities
102,56 103,91 107,33 111,42 115,44
F. Konstruksi/Construction 106,01 111,82 117,55 124,84 132,16
G. Perdagangan Besar dan Eceran;Reperasi Mobil dan Sepeda Motor/Wholesale andRetail Trade;Repair of Motor Vehicles and Motorcycles
107,08 108,41 119,75 133,14 138,54
H. Transportasi dan Pergudangan/ Transportation and Storage
105,47 109,24 120,22 131,30 141,60
I.
Penyediaan Akomodasi dan Makan Minum/Accommodation and Food Service Activities
106,83 113,51 122,32 133,88 146,88
J. Informasi dan Komunikasi/Information
and Communication 100,38 99,55 100,14 99,85 100,08
K. Jasa Keuangan dan Asuransi/Financial
and Insurance Activities 105,39 114,30 120,63 126,69 132,15
L. Real Estat/Real Estate Activities 105,08 106,34 110,90 119,56 124,09
O.
Administrasi Pemerintahan, Pertahanan dan Jaminan Sosial Wajib/Public Administration and Defence; Compulsory Social Security
117,94 133,86 146,75 159,24 169,74
P. Jasa Pendidikan/Education 104,81 112,30 123,58 138,44 147,51
Q.
Jasa Kesehatan dan Kegiatan Sosial/Human Health and Social Work Activities
106,86 112,93 122,99 132,66 138,75
R,S,T,
U Jasa Lainnya/ Other Services Activities 103,38 107,50 118,52 128,84 135,90
PDRB / GRDP 106,68 112,02 119,26 128,16 135,14
PDRB TANPA MIGAS
GRDP WITHOUT OIL-GAS 106,64 111,96 119,21 128,11 135,07
Catatan / Note : *) Angka Sementara / Preliminary Figures
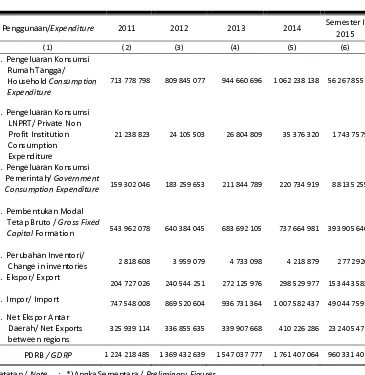
Tabel : 12.9. Table
PDRB Menurut Penggunaan Atas Dasar Harga Berlaku, 2011 – 2015 Semester I
Expenditure GRDP at Current Market Price, 2011 – 2015 Semester 1 of a year
(Juta Rupiah / Million Rupiahs)
Penggunaan/Expenditure 2011 2012 2013 2014 Semester I
2015
(1) (2) (3) (4) (5) (6)
1. Pengeluaran Konsumsi Rumah Tangga/ Household Consumption Expenditure
713 778 798 809 845 077 944 660 696 1 062 238 138 562 678 552
2. 2. Pengeluaran Konsumsi LNPRT/ Private Non Profit Institution Consumption Expenditure
21 238 823 24 105 503 26 804 809 35 376 320 17 437 579
3. 3. Pengeluaran Konsumsi
Pemerintah/ Government
Consumption Expenditure 159 302 046 183 259 653 211 844 789 220 734 919 88 135 255
4. Pembentukan Modal Tetap Bruto / Gross Fixed
Capital Formation 543 962 078 640 384 045 683 692 105 737 664 981 393 905 640
5. Perubahan Inventori/
Change in inventories 2 818 608 3 959 079 4 733 098 4 218 879 2 772 920 6. Ekspor/ Export
204 727 026 240 544 251 272 125 976 298 529 977 153 443 583
7. Impor/ Import 747 548 008 869 520 604 936 731 364 1 007 582 437 490 447 597
8. Net Ekspor Antar Daerah/ Net Exports between regions
325 939 114 336 855 635 339 907 668 410 226 286 232 405 470
PDRB / GDRP 1 224 218 485 1 369 432 639 1 547 037 777 1 761 407 064 960 331 402
Tabel : 12.10. Table
PDRB Menurut Penggunaan Atas Dasar Harga Konstan 2010, 2011 – 2015 Semester I
Expenditure GRDP at 2010 Constant Market Price, 2011 – 2015 Semester 1 of a year
(Juta Rupiah / Milion Rupiahs)
Penggunaan/Expenditure 2011 2012 2013 2014 Semester I
2015
(1) (2) (3) (4) (5) (6)
1. Pengeluaran Konsumsi Rumah Tangga/ Household Consumption Expenditure
681 235 649 723 622 472 765 461 432 808 335 608 416 780 078
4. 2. Pengeluaran Konsumsi LNPRT/ Private Non Profit Institution Consumption Expenditure
20 979 415 22 949 316 24 282 123 28 360 842 13 292 607
5. 3. Pengeluaran Konsumsi Pemerintah/ Government
Consumption Expenditure 146 292 778 154 778 816 170 160 652 172 421 683 67 044 085
4. Pembentukan Modal Tetap Bruto / Gross Fixed
Capital Formation 533 589 461 585 571 047 618 800 674 638 377 698 325 234 369
5. Perubahan Inventori/
Change in inventories 1 935 468 2 768 496 2 091 693 2 057 878 1 314 789 6. Ekspor/ Export
201 599 194 224 117 319 231 669 589 230 316 565 112 371 866
7. Impor/ Import
727 870 759 795 573 959 799 932 799 794 348 426 373 083 915
8. Net Ekspor Antar Daerah/ Net Exports between regions
289 797 020 304 294 418 284 662 062 288 826 764 147 658 778
PDRB / GDRP 1 147 558 226 1 222 527 925 1 297 195 426 1 374 348 612 710 612 656
Tabel : 12.11. Table
Distribusi Persentase PDRB Penggunaan atas Dasar Harga Berlaku, 2011 – 2015 Semester I
Percentage Distribution of GRDP at Current Market Price by Expenditure Components, 2011 – 2015 Semester 1 of a year
(Persen / Percentage)
Penggunaan
Expenditure 2011 2012 2013 2014
Semester I 2015*)
(1) (2) (3) (4) (5) (6)
1. Pengeluaran Konsumsi Rumah Tangga/Household Consumption
Expenditure 58,30 59,14 61,06 60,31 58,59
6. 2. Pengeluaran Konsumsi LNPRT/ Private Non
Profit Institution Consumption Expenditure 1,73 1,76 1,73 2,01 1,82 7. 3. Pengeluaran Konsumsi Pemerintah/
Government Consumption Expenditure 13,01 13,38 13,69 12,53 9,18
4. Pembentukan Modal Tetap Bruto/ Gross
Fixed Capital Formation 44,43 46,76 44,19 41,88 41,02
5. Perubahan Inventori/ Change in inventories
0,23 0,29 0,31 0,24 0,29
6. Ekspor/ Export
16,72 17,57 17,59 16,95 15,98
7. Impor/ Import 61,06 63,49 60,55 57,20 51,07
8. Net Ekspor Antar Daerah/ Net Exports
between regions 26,62 24,60 21,97 23,29 24,20
Produk Domestik Regional Bruto
Gross Domestic Regional Product 100,00 100,00 100,00 100,00 100,00
Tabel : 12.12. Table
Distribusi Persentase PDRB Penggunaan atas Dasar Harga Konstan, 2011 – 2015 Semester I
Percentage Distribution of GRDP at Constant Market Price by Expenditure Components, 2011 – 2015 Semester 1 of a year
(Persen / Percentage)
Penggunaan/Expenditure 2011 2012 2013 2014 Semester I 2015*)
(1) (2) (3) (4) (5) (6)
1. Pengeluaran Konsumsi Rumah
Tangga/Household Consumption Expenditure 59,36 59,19 59,01 58,82 58,65
8. 2. Pengeluaran Konsumsi LNPRT/ Private Non Profit Institution Consumption Expenditure
1,83 1,88 1,87 2,06 1,87
3. Pengeluaran Konsumsi Pemerintah/
Government Consumption Expenditure 12,75 12,66 13,12 12,55 9,43
4. Pembentukan Modal Tetap Bruto / Gross Fixed CapitalFormation
46,50 47,90 47,70 46,45 45,77
5. Perubahan Inventori/ Change in inventories 0,17 0,23 0,16 0,15 0,19
6. Ekspor/ Export
17,57 18,33 17,86 16,76 15,81
7. Impor/ Import 63,43 65,08 61,67 57,80 52,50
8. Net Ekspor Antar Daerah/ Net Exports Between Regions
25,25 24,89 21,94 21,02 20,78
Produk Domestik Regional Bruto
Gross Domestic Regional Product 100,00 100,00 100,00 100,00 100,00
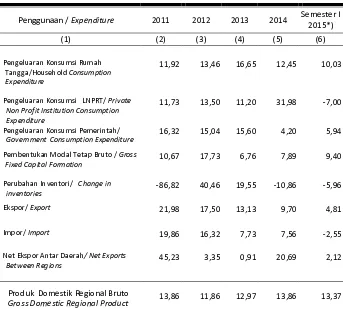
Tabel : 12.13. Table
Laju Pertumbuhan PDRB Penggunaan Atas Dasar Harga Berlaku , 2011 – 2015 Semester I
The Growth Rate of GRDP at 2000 Current Market Price by Expenditure
Components, 2011 – 2015 Semester 1 of a year
(Persen / Percentage)
Penggunaan / Expenditure 2011 2012 2013 2014 Semester I 2015*)
(1) (2) (3) (4) (5) (6)
1. Pengeluaran Konsumsi Rumah Tangga/Household Consumption Expenditure
11,92 13,46 16,65 12,45 10,03
9. 2. Pengeluaran Konsumsi LNPRT/ Private Non Profit Institution Consumption Expenditure
11,73 13,50 11,20 31,98 -7,00
3. Pengeluaran Konsumsi Pemerintah/ Government Consumption Expenditure
16,32 15,04 15,60 4,20 5,94
4. Pembentukan Modal Tetap Bruto / Gross
Fixed CapitalFormation 10,67 17,73 6,76 7,89 9,40
5. Perubahan Inventori/ Change in inventories
-86,82 40,46 19,55 -10,86 -5,96
6. Ekspor/ Export
21,98 17,50 13,13 9,70 4,81
7. Impor/ Import 19,86 16,32 7,73 7,56 -2,55
8. Net Ekspor Antar Daerah/ Net Exports Between Regions
45,23 3,35 0,91 20,69 2,12
Produk Domestik Regional Bruto
Gross Domestic Regional Product 13,86 11,86 12,97 13,86 13,37
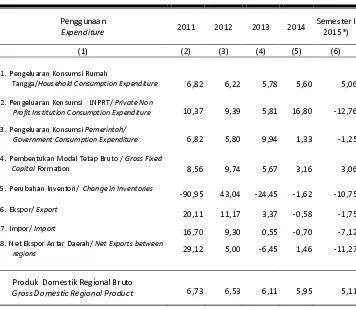
Tabel : 12.14. Table
Laju Pertumbuhan PDRB Penggunaan Atas Dasar Harga Konstan 2000, 2011– 2015 Semester I The Growth Rate of GRDP at 2000 Constant Market Price by Expenditure Components, 2011 – 2015 Semestes 1 of a year
(Persen / Percentage)
Penggunaan
Expenditure 2011 2012 2013 2014
Semester I 2015*)
(1) (2) (3) (4) (5) (6)
1. Pengeluaran Konsumsi Rumah
Tangga/HouseholdConsumption Expenditure 6,82 6,22 5,78 5,60 5,06
2. Pengeluaran Konsumsi LNPRT/ Private Non
Profit Institution Consumption Expenditure 10,37 9,39 5,81 16,80 -12,76
3. Pengeluaran Konsumsi Pemerintah/
Government Consumption Expenditure 6,82 5,80 9,94 1,33 -1,25
4. Pembentukan Modal Tetap Bruto / Gross Fixed
Capital Formation 8,56 9,74 5,67 3,16 3,06
5. Perubahan Inventori/ Change In Inventories
-90,95 43,04 -24,45 -1,62 -10,75
6. Ekspor/ Export
20,11 11,17 3,37 -0,58 -1,75
7. Impor/ Import 16,70 9,30 0,55 -0,70 -7,12
8. Net Ekspor Antar Daerah/ Net Exports between
regions 29,12 5,00 -6,45 1,46 -11,27
Produk Domestik Regional Bruto
Gross Domestic Regional Product 6,73 6,53 6,11 5,95 5,11
Tabel : 12.15. Table
Produk Domestik Regional Bruto Atas Dasar Harga Berlaku Menurut Kabupaten/Kota Adm. 2010- 2014
Gross Regional Domestic Product at Current Market Prices by Regency/ Municipality, 2010 - 2014
(Juta Rupiah / Million Rupiahs)
Kabupaten/Kota Administrasi
Regency/ Municipality
2010 2011 2012 2013 2014
(1) (2) (3) (4) (5) (6)
1. Kepulauan Seribu
3 584 570 4 502 627 4 865 065 5 264 649 5 645 205
2. Jakarta Selatan 241 225 134 274 378 611 307 189 768 346 964 030 394 348 141
3. Jakarta Timur 186 512 337 212 103 956 237 081 963 267 575 413 305 285 712
4. Jakarta Pusat 258 419 705 295 375 200 333 572 902 378 834 287 428 655 827
5. Jakarta Barat 182 020 885 205 951 118 228 382 465 258 566 471 292 709 890
6. Jakarta Utara 203 420 850 231 406 424 259 529 340 291 573 355 335 220 479
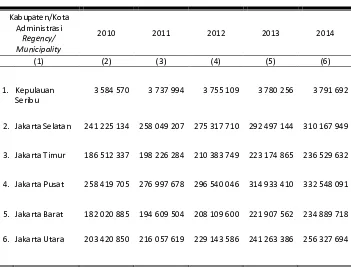
Tabel : 12.16. Table
Produk Domestik Regional Bruto Atas Dasar Harga Konstan 2010 Menurut Kabupaten/Kota Adm, 2010 - 2014
Gross Regional Domestic Product at 2010 Constant Prices by Regency/ Municipality, 2010- 2014
(Juta Rupiah / Million Rupiahs)
Kabupaten/Kota Administrasi
Regency/ Municipality
2010 2011 2012 2013 2014
(1) (2) (3) (4) (5) (6)
1. Kepulauan Seribu
3 584 570 3 737 994 3 755 109 3 780 256 3 791 692
2. Jakarta Selatan 241 225 134 258 049 207 275 317 710 292 497 144 310 167 949
3. Jakarta Timur 186 512 337 198 226 284 210 383 749 223 174 865 236 529 632
4. Jakarta Pusat 258 419 705 276 997 678 296 540 046 314 933 410 332 548 091
5. Jakarta Barat 182 020 885 194 609 504 208 109 600 221 907 562 234 889 718
6. Jakarta Utara 203 420 850 216 057 619 229 143 586 241 263 386 256 327 694
Tabel : 12.17. Table
Laju Pertumbuhan Produk Domestik Regional Bruto Atas Dasar Harga Konstan 2010 Menurut Kabupaten/Kota Adm, 2011 - 2014
The Growth Rate of Gross Regional Domestic Product at 2000 Constant Prices by Municipality/Regency, 2010 - 2014
(Persen / Percentage)
Kabupaten/Kota Administrasi
Regency/ Municipality 2010 2011 2012 2013 2014
(1) (2) (3) (4) (5) (6)
1. Kepulauan Seribu 2,11 4,28 0,46 0,67 0,.30
2. Jakarta Selatan 6,79 6,97 6,69 6,24 6,04
3. Jakarta Timur 5,60 6,28 6,13 6,08 5,98
4. Jakarta Pusat 6,99 7,19 7,06 6,20 5,59
5. Jakarta Barat 7,35 6,92 6,94 6,63 5,85
6. Jakarta Utara 5,48 6,21 6,06 5,29 6,24
Tabel : 12.18. Table
Distribusi Persentase Terhadap Total Produk Domestik RegionalBruto Menurut Kabupaten/ Kota Adm. Atas Dasar Harga Berlaku, 2010 - 2014 Percentage Distribution of Total Gross Regional Domestic Product by Regency/Municipality at Current Market Prices, 2010 - 2014
(Persen/Percentage)
Kabupaten/Kota Administrasi
Regency/Municipality 2010 2011 2012 2013 2014
(1) (2) (3) (4) (5) (6)
1. Kepulauan Seribu 0,33 0,37 0,35 0,34 0,32
2. Jakarta Selatan 22,44 22,42 22,41 22,40 22,38
3. Jakarta Timur 17,35 17,33 17,30 17,28 17,33
4. Jakarta Pusat 24,03 24,14 24,34 24,46 24,33
5. Jakarta Barat 16,93 16,83 16,66 16,69 16,61
6. Jakarta Utara 18,92 18,91 18,94 18,83 19,03
Tabel : 12.19. Table
Pendapatan Produk Domestik Regional Bruto Per Kapita Menurut Kabupaten/ Kota Adm. Atas Dasar Harga Berlaku, 2010 - 2014 Per Capita Gross Regional Domestic Product by Regency/ Municipality at Current Market Prices, 2010 - 2014
(Rupiah/Rupiah)
Kabupaten/Kota Adm.
Regency/Municipality 2010 2011 2012 2013 2014
(1) (2) (3) (4) (5) (6)
1. Kepulauan Seribu 167 393 761 205 787 340 217 093 485 231 790 120 245 326 366
2. Jakarta Selatan 116 442 302 130 921 691 144 968 600 161 985 802 182 225 224
3. Jakarta Timur 68 930 112 77 560 710 85 803 044 95 868 331 108 334 408
4. Jakarta Pusat 286 187 632 326 243 729 367 455 617 416 364 098 470 061 680
5. Jakarta Barat 79 381 214 88 469 635 96 674 737 107 889 547 120 436 424
6. Jakarta Utara 123 048 365 138 328 002 153 355 500 170 407 493 193 831 358