CHAPTER III
RESEARCH METHODOLOGY
This chapter presents the way the study is conducted, including the
formulation of the problem, research design, sites and participants, data collection,
and data analysis.
3.1 Formulation of the Problem
This study was conducted to find out students’ perception of teacher’s
bilingual language use in an English classroom. This study was mainly aimed:
1. to investigate students’ perceptions toward teacher’s bilingual language use in
English classroom.
2. to find out the benefits of teacher’s bilingual language use for students in
learning English.
3.2 Research Design
The basic framework of the present study was qualitative approach which
aimed to explore and to understand the meaning of the perception of students toward teacher’s bilingual language use in an English classroom and its benefits for the students in learning English. Hence, this study focused on individual
meaning of a social or human problem (Creswell, 2009, p.4). Furthermore, a case
study was chosen as a method of this study to analyse the collected data and to
produce understanding of the entity being studied. According to Creswell (2009,
p.176), he recommends for choosing narrative, phenomenology, ethnography,
case study, or grounded theory to be applied in qualitative research. Furthermore,
he also argues that a strategy in which the researcher is exploring a program,
event, activity, process, of someone or more individuals deeply (Creswell, 2009,
In addition, he also defines in details that a case study also focuses on
program, event, or activities, and provides a detail description and analysis of a
case based on extensive data collection (Creswell cited in Handini, 2014, p.22). It
is in line with the definition of case study research design; according to
Merriam (as cited in Laws, 2006), case study is an examination of a specific
phenomenon, such as a program, an event, a process, an institution, or a social
group. Thus, this case study is appropriate for the present study because it is
appropriate with the aim of this study in which investigating the students’
perception of teacher’s bilingual language use in an English classroom and its benefits for the students in learning English.
As cited in Chapter I, the data of this research were collected by using
interview and questionnaire. Regarding this, Phelas et al. (2011, p. 182) who
mentions that case study can use several survey instruments such as observation,
interview, and also questionnaire as the instruments of the research. In addition,
Creswell (2009) also says that people who enjoy writing in a literary way,
conducting personal interviews, or making opened observations are people who
intended to do a qualitative approach. Therefore, the use of qualitative approach
with a case study method was appropriate for this study because in collecting the
data for this research was using interview and questionnaire.
The data which had been collected from the interview and the
questionnaire were analysed by exploring and understanding the meaning of each
data to answer the questions related to the present study in detail. On the other
hand, explanation building analysis also played a role in this study as a procedure
in qualitative approach in which the researcher should give narrative data which
reflects some theoretical proportions (Burn, 1997). Explanation building analysis
was also used to show the evidence of the present study and to draw the findings.
3.3.1 Research Site
This study was conducted in a junior high school in Bandung Regency,
West Java, Indonesia. The reasons for choosing this school are because one of the
teachers in this school is using bilingual approach in teaching English in EFL
classroom. Then, English is also taught as a subject lesson in the school and the
students are non-native speaker of English.
3.3.2 Participants
The sample was drawn from 7th grade of an English classroom. This
class contains 50 students who are non-native English speaker. The reason for
choosing the 7th grade is because at this level students are at the beginning level
proficiency in English. Furthermore, the participants of this study were students
who selected based on the class where the students were taught by a teacher who
used bilingual classroom language instruction (Indonesian and English) in English
subject. The students are also English non-native speaker, and the majority
language used by the students in their daily life is Indonesian (they are Indonesian
native speaker). In addition, this study only used students as the participants of the
present study.
3.4 Data Collection Methods
In gathering the data to be explored and analysed in this research, this
study used two instruments; questionnaire for the students and interview which
was given to the students. Each technique of data collection will be described
below.
3.4.1 Questionnaire
A questionnaire was given to the students who belong to the selected
their thoughts and feelings. In line with that, Burn (1997) also states that the use
of questionnaire will elicit more truthful responses toward the field being asked.
In order to avoid misunderstanding of the respondents in understanding
the aims of each question, before the questionnaire administered to the
respondents, the questionnaire was adopted and translated into Indonesian
language. Then, the data from the questionnaire were analysed by using Likert
scales. As stated by Linn and Gronlund (1995) that for measuring perception or
attitudes, it is very easy to be conducted and to be scored by using Likert scale.
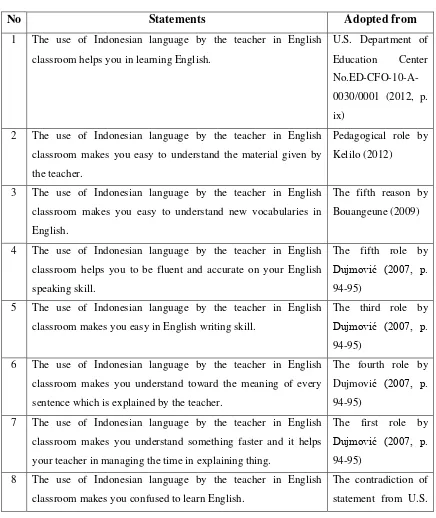
There were eight statements in the questionnaire which were used to categorize the students’ perception of teacher’s bilingual language use in the English classroom. Students answered the list of statements by giving check (√) whether they agree or disagree with each statement. The data from questionnaire were used to know students’ perception of teacher’s bilingual language use in an English classroom and classified whether students’ perceptions of it was positive or negative. Besides, it is also used to gain the data about their perception of
benefits of it for them in learning English. The following table is the list of
Table 3.1 The List of Statements in Questionnaire
classroom makes you easy in English writing skill.
The third role by
Dujmović (2007, p.
94-95)
6 The use of Indonesian language by the teacher in English
classroom makes you understand toward the meaning of every
sentence which is explained by the teacher.
The fourth role by
Dujmović (2007, p.
94-95)
7 The use of Indonesian language by the teacher in English
classroom makes you understand something faster and it helps
your teacher in managing the time in explaining thing.
The first role by
Dujmović (2007, p.
94-95)
8 The use of Indonesian language by the teacher in English
classroom makes you confused to learn English.
The contradiction of
Department of used to source in depth the data about the benefits of teacher’s bilingual language use for students in learning English and it was also used to enrich the data
collected from the questionnaire. Merriam (as cited in Handini, 2014) argues that “qualitative data consist of direct questions from respondents about their experiences, opinions, feelings, and knowledge through interviews”. Besides, the interview also offers the opportunity for the researcher to observe the subject and
the total situation in which he or she is responding (Linn and Gronlund, 1995).
This study uses semi-structured interview in which aims to find out
specific information of the entity being studied. According to Fraenkel and
Wallen (2012, p. 451), they state that semi-structured interview is a verbal
questionnaire which is rather formal than the other types of interview and it
contains a series of questions designed for eliciting a specific answer from the
respondents. Moreover, there were nine selected-students who were interviewed
by the researcher. The students were selected by the data from questionnaire who gave ‘strongly agree’ checklist with the use of bilingual language by the teacher. The reason for choosing only nine students is because to make more efficient time
and that amount is enough to strengthen the data result from the questionnaire, the
researcher also assumed that nine students could represent all members of the
class. Besides, those students are also appraised having some reasons for why they strongly agree with the use of bilingual teacher’s language in order to draw the benefits of it.
use in the English classroom. Similarly, the questions in the interview were
delivered in Indonesian language in order to make the students easy to respond the
questions and also to avoid misunderstanding of students to understand each aim
of the questions.
The conversation between the researcher and the students was recorded
by using a voice recorder. Furthermore, the data from interview were transcribed
and analysed to describe the finding of the study and to answer the second
question of the study.
3.5 Data Analysis
The data which had been collected from all instruments were analysed
through several steps; counting and analysing the questionnaire result, then
exploring and interpreting the interview result. The way of analysing data is
explained below.
3.5.1 Analysis of Questionnaire Result
In order to answer the first question of this study which is about students’ perception of bilingual teacher language use in an English classroom, the data
gained from questionnaire were analysed and explored. Hence, the data from the
questionnaire were analysed by using Likert scale which had been discussed in
Chapter I. According to Gal et al. (2003), Likert scale is defined as “a
measurement which asks individual to check their level of agreement with various
statements about an attitude object i.e. strongly agree, agree, uncertain, disagree, and strongly disagree”. This study used the data which were categorised into strongly agree, agree, disagree, and strongly disagree. Uncertain statement was
not used in this study; this was aimed to avoid uncertain data from the students.
Furthermore, in calculating the data using Likert scale, each student’s answer would be classified into percentage data. Then, it used to present the data
from questionnaire to help the researcher classify and interpret it easily. Based on
Ockert (2005), there are several steps in calculating data using Likert scale; those
are scoring the questionnaire, finding out the score of the answer, calculating the
central tendency of the answer, and classifying the average percentage. The
formulation which used in this study to measure the percentage of students’
answers is as follows.
a. Scoring Questionnaire
Before scoring the Likert scale, each student’s answer was labelled with a value from 1 to 4. As the example of scoring is followed:
Table 3.2 The Scoring system of the Questionnaire
Category
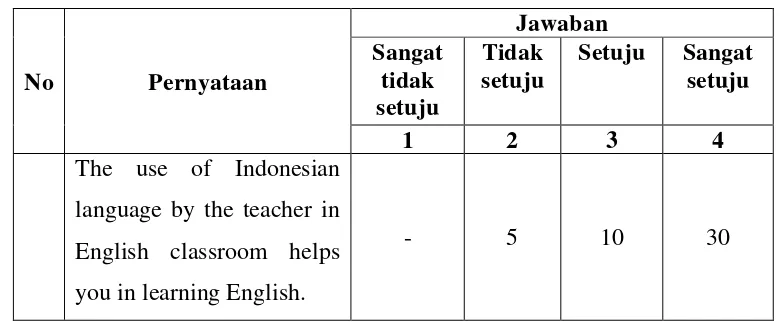
Table 3.3 Example of Statements in This Study
No Pernyataan
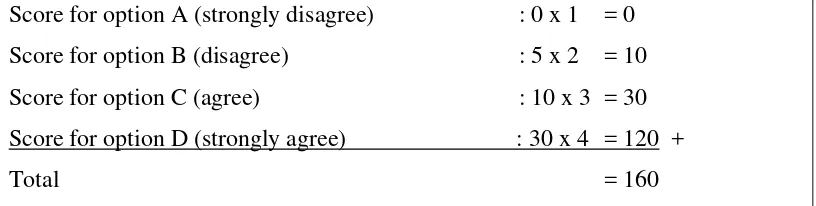
b. Finding Out the Score of the Answer
In order to find the score, the frequency of each answer was multiplied by
Score for option A (strongly disagree) : 0 x 1 = 0
Score for option B (disagree) : 5 x 2 = 10
Score for option C (agree) : 10 x 3 = 30
Score for option D (strongly agree) : 30 x 4 = 120 +
Total = 160
Notes:
The ideal score for the lowest value = (n) x 1 50 x 1 = 50
The ideal score for the highest value = (n) x 4 50 x 4 = 200
(n) is the amount of students who participate
c. Calculating the Central Tendency of the Answer
The formulation of calculating central tendency of the answer is below:
P = x 100%
Notes:
P : Percentage
f0 : total value of answer
n : the ideal score of the highest value
(Adapted from Sudjana, 1984; Nitiswari, 2012; Ibnus, 2014)
d. Classifying the Average Percentage
This is the last step of calculating the Likert scale; there were some criteria
of classifying the average percentage:
Table 3.4 Percentage of Central Tendency and Its Interpretation
0% - 20% Very weak
21% - 40% Weak
41% - 60% Enough
61% - 80% Strong
81% - 100% Very strong
(Adapted from Akdon, 2008; Nitiswari, 2012; Ibnus, 2014, p.32)
3.5.2 Interpretation of Interview Result
The data from interview were transcribed and interpreted to answer the
second research question which deals with the benefits of teacher’s bilingual
language use for students in learning English. It was also used to strengthen and
enrich the data gathered from questionnaire. The interview was recorded to help
researcher easy to carry out the data to be analysed further. Then, the data were
transcribed into the original transcription based on the participants said when they
were having an interview with the researcher.
The transcription of the interview was confirmed by the participants as it
is exactly what they said and meant. This step also aims to give the opportunity to the participants to reply whether they agree or disagree with the researcher’s transcription (Kvale, 1996). Besides, the interview was also used to gain deeper
information about the benefits of teacher’s bilingual language use which felt by
the students during English learning. Finally, the data about students’ perception of bilingual language use in an English classroom were categorized into positive
or negative perception and its benefits for the students in learning English was categorised into several categories based on the benefits’ classification of it.
3.6 Concluding Remarks
This chapter has presented the methodology used in the present study.
The function of this chapter is as a guidance to determine the research design,
analysis that is used in the present study. Research finding and discussion of this