Desi Ristiani, 2016
IMPROVING STUDENTS’ ABILITY IN WRITING RECOUNT TEXT THROUGH ELECTRONIC
JOURNALING
Universitas Pendidikan Indonesia | repository.upi.edu|perpustakaan.upi.edu
26
CHAPTER III
METHODOLOGY
This chapter presents the methodology of the study. It consists of research
design, research site and participants, data collection, research procedures. Then, it will elaborate the data analysis from pretest, posttest, and questionnaire.
1.1Research Design
This study used quantitative method. Due to many limitations of true-experimental design, this study employed quasi-true-experimental design. Hatch and
Farhady (1982) state that:
By using a quasi-experimental design, we control as many variables as we can and also limit the kinds of interpretations we make about cause-effect relationship and hedge the power of our generalization statements.
The research design applied in this study was pre and posttest design.
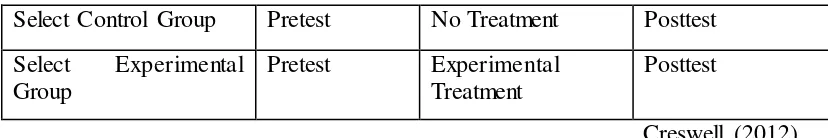
According to Creswell (2012), pretest and posttest design is one type of quasi-experimental design which involves two groups namely quasi-experimental group and
control group. Both of groups are given pretest and posttest but the treatment is only given to the experimental group. The design can be seen on the table below:
Table 3.1 Pre- and Posttest Design
Pre- and Posttest Design Time
Select Control Group Pretest No Treatment Posttest
Select Experimental
Group
Pretest Experimental
Treatment
Posttest
Creswell (2012)
As can be seen on the table above, there were two groups who participated
in the research. The first group was experimental group and the second group was control group. The experimental group was given treatment for six meetings by
Desi Ristiani, 2016
IMPROVING STUDENTS’ ABILITY IN WRITING RECOUNT TEXT THROUGH ELECTRONIC JOURNALING
Universitas Pendidikan Indonesia | repository.upi.edu|perpustakaan.upi.edu
Students were asked to write several journals based on some topics given by the teacher. Then, the journals were submitted and given feedback through email. Meanwhile, the control group was taught by the conventional method.
1.1.1 Variables
Variable means “a characteristic that can assume any one of several values” (Fraenkel et al, 2012). In this study, there were two kinds of variables namely independent and dependent variables. Independent variable is a variable which becomes the cause of the changes in dependent variable. In other words,
the dependent variable is resulted by the independent variable (Sugiyono, 2008). The independent variable in this study was electronic journal writing. Electronic
journal writing was used to make a change on students’ writing ability. Meanwhile, students’ ability which was seen through students’ score was the dependent variable.
1.2Research Site and Participants
This study was conducted in one of Junior High Schools in Bandung. It
was chosen based on some considerations. First, the school was where the researcher conducted teaching practice (PPL). Second, the place was quite near from researcher’s University so it was easy to be accessed. Third, the researcher has recognized the English teacher who teaches in the school and school’s staffs so it would be easy on the administrative matter. Last, the researcher has
recognized some students in the school so it would be easier to adapt. The participants of this study were two classes of students in 8th grade.
1.3Hypothesis
Desi Ristiani, 2016
IMPROVING STUDENTS’ ABILITY IN WRITING RECOUNT TEXT THROUGH ELECTRONIC JOURNALING
Universitas Pendidikan Indonesia | repository.upi.edu|perpustakaan.upi.edu
H0: There is no significant difference between the students’ posttest score of
the experimental group and control group before and after treatment
H1 : There is significant difference between the students’ posttest score of
the experimental group and control group after treatment
As can be seen above, the null hypothesis in this study is that there is no difference on students’ writing before and after electronic journaling activity, which means electronic journaling was is effective in improving students’ writing ability especially on recount text. The result of this study was expected to reject
the null hypothesis so that electronic journaling would be effective to improve students’ writing ability.
1.4Population and Samples
Sample is “the group on which the information is obtained”, while population is “the larger group to which one hopes to apply the results” (Fraenkel et al, 2012 p. 91). The population in this study was the whole students at the eighth grade in the school which consisted of ten classes. Eighth grade students
were the population because recount text is taught in that grade as explained in the Standard Competencies and the Basic Competencies. This study used random sampling technique in which the researcher decides the samples randomly (Creswell, 2012). Two classes were used as the samples of this study. The first class was used as the experimental group which was given electronic journaling
treatment. The class consisted of 35 students. The second class, which consisted of 37 students, was used as the control group which was given no treatment.
1.5Data Collection
1.5.1 Research Instruments
Desi Ristiani, 2016
IMPROVING STUDENTS’ ABILITY IN WRITING RECOUNT TEXT THROUGH ELECTRONIC JOURNALING
Universitas Pendidikan Indonesia | repository.upi.edu|perpustakaan.upi.edu
given to both experimental and control groups. Questionnaire was administered to observe students’ responses toward the implementation of electronic journaling technique in teaching writing Recount Text. The questionnaire was only given to the experimental group.
1.5.2 Teaching Materials
In this study, the teaching material used was Recount Text. The material
was chosen based on the standard competence of syllabus of grade VIII of Junior High School. The topics of Recount Text were chosen based on students’
condition such as knowledge and familiarity.
1.6Research Procedures
This research consisted of some steps namely preparing lesson plans, making research instruments, administering pilot test, conducting pretest, conducting teaching and learning process, administering posttest, and administering questionnaire. The description of each process can be seen as follows:
1.6.1 Preparing Lesson Plans
The lesson plan was prepared for both experimental and control groups. It was designed for six meetings and was based on the Standard Competencies and Basic Competencies in School-Based Curriculum (KTSP) 2006. The Recount Text material was decided by considering the time allotment and students’ condition. For more information, see Appendix A.
1.6.2 Making Research Instruments
Desi Ristiani, 2016
IMPROVING STUDENTS’ ABILITY IN WRITING RECOUNT TEXT THROUGH ELECTRONIC JOURNALING
Universitas Pendidikan Indonesia | repository.upi.edu|perpustakaan.upi.edu
effectiveness of electronic journaling to improve students’ writing ability especially in writing Recount Text.
Then, the questionnaire was used to answer the second research question which is to find out students’ responses toward the use of electronic journaling technique in helping students to improve students’ writing ability on Recount Text. It consisted of twenty closed-ended questions in the form of Likert Scale. It was given at the end of the research. For detailed information, see Appendix B.
1.6.3 Administering Pilot Test
A pilot test was conducted before implementing the actual research. It was
aimed to check the validity of the instruments. The test was given to ten students who were not included in the experimental and control groups but still at the same
grade.
The pilot test took three meetings. In the first meeting, the students were asked to write journal based on the topic decided by the teacher. Then, it was submitted to the teacher via email. It was done outside the classroom. After
receiving email, teacher gave them feedback and sent it back. In the second meeting, the students learnt Recount Text in the class. Some students’ journals were also used by the teacher in explaining the material. After the class ended, students were asked to send their revision based on teacher’s feedback. In the third meeting, students learnt the material based on the teacher’s last feedback.
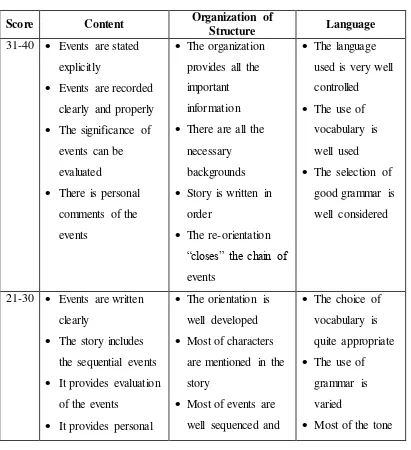
The results were analyzed by numeric and scoring rubric scoring guide (Coffin et al, 2003 and Hyland, 2004, cited in Emilia, 2011). Content,
organization, and language were three aspects which were scored. In the rubric, the maximum score for each aspect is 40 points. Therefore, the maximum score is 120 points. In order to make it easier for further analysis, the score was then
divided by 1.2 by the researcher so the maximum score was 100 points. The instrument was considered as valid if students got minimum score (25 points). It
Desi Ristiani, 2016
IMPROVING STUDENTS’ ABILITY IN WRITING RECOUNT TEXT THROUGH ELECTRONIC JOURNALING
Universitas Pendidikan Indonesia | repository.upi.edu|perpustakaan.upi.edu 1.6.4 Conducting Pretest
Pretest was conducted in the first meeting before implementing treatment. Both experimental group and control group were given pretest in order to find out students’ initial ability in writing Recount Text. The participants were asked to write a Recount Text based on the topic decided by the teacher. The students in
experimental group were asked to write it on Microsoft Word and se nt it to the teacher via email. Meanwhile, those who were in control group were asked to
write it on a paper. The result was analyzed and given score by using numeric and rubric scoring guide from Coffin, et al (2003; Hyland; 2004, cited in Emilia,
2011).
1.6.5 Teaching Phases
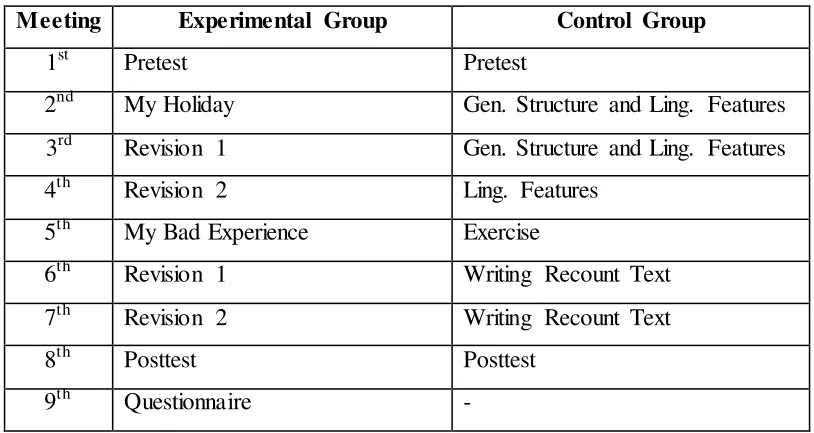
The research was conducted for nine meetings. The treatment started to be implemented from second until seventh meetings. There were only two topics taught by the teacher since this study focused on the process of writing. The
schedule can be seen on Table 3.2 below:
Table 3.2 Research Schedule
Meeting Experimental Group Control Group
1st Pretest Pretest
2nd My Holiday Gen. Structure and Ling. Features
3rd Revision 1 Gen. Structure and Ling. Features
4th Revision 2 Ling. Features
5th My Bad Experience Exercise
6th Revision 1 Writing Recount Text
7th Revision 2 Writing Recount Text
8th Posttest Posttest
Desi Ristiani, 2016
IMPROVING STUDENTS’ ABILITY IN WRITING RECOUNT TEXT THROUGH ELECTRONIC JOURNALING
Universitas Pendidikan Indonesia | repository.upi.edu|perpustakaan.upi.edu
The treatment was implemented for six meetings which were started after conducting pretest. In the class, students were taught Recount Text as the material. Then, as the homework, students were asked to write journal which was submitted via email based on topics decided by the teacher.
1st Meeting
The first topic of the treatment was holiday. It was chosen because students were familiar with holiday. Every student had his or her own
experience in spending holiday. Before writing journal, students were given a text which told someone’s holiday. Students were taught the generic structure of recount text. Furthermore, some exercises were also being a part of students’ activities in classroom. Electronic journaling was done as homework. Students submitted their journal to the teacher through email on the next two days at the latest. Meanwhile, students in the control
group were taught the same topic but they did not ask to write electronic journal. After receiving students’ email, the teacher gave them feedback then sent it back. The feedback was sent before the next meeting came 2nd Meeting
In this meeting, the experimental group was taught recount text which emphasized on the most common mistake on their journal. Several students’ journals were also used as a source in teaching and learning. The journals were then analyzed the generic structure and linguistic features. While discussing journals, students could reflect on their own journals which had been given feedback by the teacher so they could make revision
on their journals. Students were asked to send their draft 2 to the teacher’s email again outside the classroom. Then, the teacher gave feedback again.
Meanwhile, the control group was taught conventional method. 3rd Meeting
Desi Ristiani, 2016
IMPROVING STUDENTS’ ABILITY IN WRITING RECOUNT TEXT THROUGH ELECTRONIC JOURNALING
Universitas Pendidikan Indonesia | repository.upi.edu|perpustakaan.upi.edu
and language feature of the texts. Students then revised their draft 2 outside classroom but they were not asked to send the revision.
4th Meeting
In the fourth meeting, students were taught recount text with new topic which was bad experience. This topic was chosen because most students
had bad experiences in life though it was only a little thing. The teacher gave students a related text as an example. Then, teacher and students discussed the generic structure and language features of the text. Students were asked to write journal as the homework, as in the first meeting. Then, they submitted their journal to the teacher via email. Again, the teacher gave students feedback after receiving email from students. Meanwhile,
the control group was also taught a new topic but not the same as the experimental group. They were taught recount text with the topic entitled
camping. The control group was not asked to write electronic journal. 5th Meeting
In this meeting, teacher taught students used some students’ recount texts emphasizing on most common students made by students. Students were asked to analyze the generic structure and language features of the texts
given. Then, teacher and students discussed it together. After that, students
sent their revision (draft 2) to the teacher via email after the class ended. As in the second meeting, teacher gave feedback to students’ journal and sent it back before the 6th meeting came.
6th Meeting
In the last meeting, teacher presented some recount texts from the last revision to be evaluated. Students analyzed the generic structure and linguistic features of the texts. Then, teacher and students discussed it
together. After the class ended, students should made revision on their journal but they were not asked to send it to the teacher.
Desi Ristiani, 2016
IMPROVING STUDENTS’ ABILITY IN WRITING RECOUNT TEXT THROUGH ELECTRONIC JOURNALING
Universitas Pendidikan Indonesia | repository.upi.edu|perpustakaan.upi.edu
Posttest was conducted to measure students’ writing ability after receiving treatment for several meetings. Both students in control and experimental groups were asked to write a recount text with the topic decided by the teacher. For those who were in experimental group, the text was submitted to the teacher through
email. Meanwhile, students in control group wrote it on a paper. Then, the result was analyzed and given score by using numeric and rubric scoring guide from
Coffin, et al (2003; Hyland; 2004, cited in Emilia, 2011).
1.6.7 Administering Questionnaire
At the end of the research, the questionnaire was distributed to the students in the experimental group. The students were asked to answer several close-ended
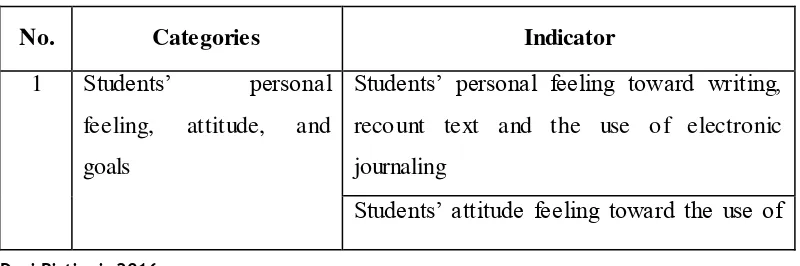
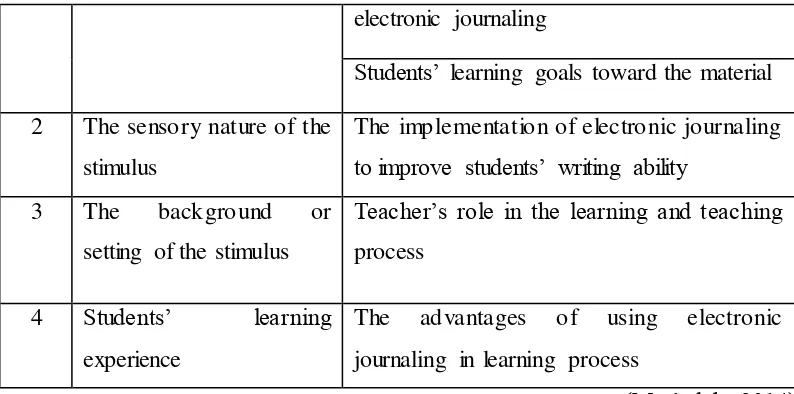
questions. In questionnaire, a researcher may ask the respondents questions related to students’ opinions, attitudes, or knowledge (Fraenkel et al, 2012 p.399). Specifically, the questions measured students’ personal feeling, attitude, and goals toward writing and the implementation of electronic journaling; students’ responses toward the implementation of electronic journaling; students’ responses toward the learning process and teacher’s role; and students’ responses toward the advantages on the use of electronic journaling. Likert scale was used in this study. Likert scale is an instrument which measures respondents’ level of agreement towards statements provided in which each option is given score (Fraenkel et al, 2012). There were four alternative answers namely “strongly agree”, “agree”, “disagree”, and “strongly disagree”. In scoring, “strongly agree”= 4, “agree”= 3, “disagree”= 2, and “strongly disagree”= 1. The questionnaire framework can be seen below:
Table 3.3 Framework of Questionnaire
No. Categories Indicator
1 Students’ personal
feeling, attitude, and goals
Students’ personal feeling toward writing, recount text and the use of electronic journaling
Desi Ristiani, 2016
IMPROVING STUDENTS’ ABILITY IN WRITING RECOUNT TEXT THROUGH ELECTRONIC JOURNALING
Universitas Pendidikan Indonesia | repository.upi.edu|perpustakaan.upi.edu
electronic journaling
Students’ learning goals toward the material
2 The sensory nature of the stimulus
The implementation of electronic journaling to improve students’ writing ability
3 The background or
setting of the stimulus
Teacher’s role in the learning and teaching process
4 Students’ learning
experience
The advantages of using electronic journaling in learning process
(Mas’udah, 2014)
1.6.7.1Validity and Reliability
The data from questionnaire were computed to test the validity and reliability of the items. Validity test is done to measure what is being measured. Meanwhile, reliability is the consistency of participants’ answers toward a test (Hatch and Farhady, 1982 p. 244). The tests were analyzed by using SPSS 20 for Windows. The validity could be seen from the value of corrected item-total
correlation. An item is considered as valid if count is positive and count > r-table Meanwhile, if r-count is negative and r-count < r-r-table, an item is considered as not valid. It was known that the r-table for this study was 0.344 with the alpha
level was set at 0.05. The results found that there were four statements (number 1, 3, 17, and 20) in which the values were less than 0.344. It means that the items
were not valid. Then, the items were omitted.
After testing the validity, the reliability test was taken by using Cronbach’s Alpha from SPSS 20 for Windows. The test was reliable if the score on Cronbach’s Alpha was higher than r-table. The results found that the score was 0.814 which means that the test was reliable. To see the detailed information, see
Appendix F.
Desi Ristiani, 2016
IMPROVING STUDENTS’ ABILITY IN WRITING RECOUNT TEXT THROUGH ELECTRONIC JOURNALING
Universitas Pendidikan Indonesia | repository.upi.edu|perpustakaan.upi.edu
As stated previously, the data were collected through pretest, posttest, and questionnaire. Then, the data were analyzed as follows:
1.7.1 Scoring Technique
Scoring technique was used to analyze the data from pretest and posttest. It used numeric and rubric scoring guide by numeric and rubric scoring guide from Coffin, et al (2003; Hyland; 2004, cited in Emilia, 2011). This scoring
technique measured content, organization, and language use. See the table below:
Table 3.4 Numeric and Rubric Scoring Guide
(Adopted from Coffin et al (2003; Hyland; 2004, cited in Emilia, 2011)
Score Content Organization of
Desi Ristiani, 2016
IMPROVING STUDENTS’ ABILITY IN WRITING RECOUNT TEXT THROUGH ELECTRONIC JOURNALING
Student’s Score = student’s score : 1.2
Desi Ristiani, 2016
IMPROVING STUDENTS’ ABILITY IN WRITING RECOUNT TEXT THROUGH ELECTRONIC JOURNALING
Universitas Pendidikan Indonesia | repository.upi.edu|perpustakaan.upi.edu
A pilot test was conducted before conducting the actual research. The pilot test was done to investigate whether electronic journaling was applicable or not. Furthermore, it was also done to test the instruments. In pilot test, students were asked to write journal electronically. Then, it was submitted to the teacher via
email. The instruments would be revised if writing instruction could not be understood by students or did not clear.
1.7.3 Data Analysis on Pretest and Posttest
Both pretest and posttest were given to experimental and control groups.
After collecting the data, the scores were analyzed by using Statistical Package for the Social Sciences (SPSS) 20 for Windows. The data analysis included normality
distribution, homogeneity of variance test, independent t-test, dependent t-test, and effect size. The details were explained as follows:
1.7.3.1Normality Distribution
This study used Kolmogorov-Smirnov to test the normality distribution of the data by employing SPSS 20 for Windows. There are some steps in conducting
Kolmogorov-Smirnov test. The first step was stating the hypothesis as follows:
H0 : the scores of experimental and control groups are normally distributed
H1 : the scores of experimental and control groups are not normally
distributed
The second step was setting the alpha level. The alpha level was set at 0.05. The third step was calculating the data by using Kolmogorov-Smirnov test
in SPSS 20 for Windows. The fourth step was interpreting the data. The null hypothesis was accepted if Asymp. Sig > 0.05 which means the scores of
experimental and control groups were normally distributed. Meanwhile, the null hypothesis was rejected if Asymp. Sig ≤ 0.05. It means that the scores of experimental and control groups were not normally distributed.
Desi Ristiani, 2016
IMPROVING STUDENTS’ ABILITY IN WRITING RECOUNT TEXT THROUGH ELECTRONIC JOURNALING
Universitas Pendidikan Indonesia | repository.upi.edu|perpustakaan.upi.edu
The Homogeneity of Variance Test was conducted if the result of the data were normally distributed. The test was aimed to find out whether or not the variance of experimental and control group were homogenous. The test used Lavene test in SPSS 20 for Windows. The first step in conducting Homogeneity
of Variance Test was stating the hypothesis as follows:
H0 : the variance of the experimental and control groups are homogenous
H1 : the variance of the experimental and control groups are not homogenous
The second step was setting alpha level. The alpha level was set at 0.05.
The third step was calculating the data by using Lavene test in SPSS 20 for Windows. The fourth step was interpreting the data. The null hypothesis was accepted if Asymp. Sig ≥ 0.05 which means the variance of experimental and control groups was homogenous. Meanwhile, the null hypothesis was rejected if Asymp. Sig < 0.05, which means that the variance of experimental and control groups were not normally distributed.
3.7.3.3 Independent t-test
Independent t-test was conducted to find out the significant difference between experimental and control groups. The first step in conducting independent t-test was setting the hypothesis as follows:
H0 : there is no significant difference between students’ scores in the
experimental and control groups
H1 : there is significant difference between students’ scores in the
experimental and control groups
The second step was setting alpha level. The alpha level is set at 0.05. The
Desi Ristiani, 2016
IMPROVING STUDENTS’ ABILITY IN WRITING RECOUNT TEXT THROUGH ELECTRONIC JOURNALING
Universitas Pendidikan Indonesia | repository.upi.edu|perpustakaan.upi.edu
significant difference between posttest mean score of experimenta l group and control group after treatment.
3.7.3.4 Dependent t-test
Dependent t-test was used to investigate the significant difference between students’ score in experimental group before and after treatment. The data from pretest and posttest of experimental group was used to conduct the dependent
t-test. The first step in conducting the dependent t-test was setting the hypothesis as follows:
H0 : there is no significant difference between pretest and posttest score of
experimental group after treatment
H1 : there is significant difference between pretest and posttest score of
experimental group after treatment
The second step was setting alpha level. The alpha level was set at 0.05. The third step was calculating the data by using dependent or paired t-test in SPSS 20 for Windows. The fourth step was interpreting the data. The null hypothesis
was accepted if Asymp. Sig ≥ 0.05 which means there was no significant difference between pretest and posttest score of experimental group after treatment. Meanwhile, the null hypothesis was rejected if Asymp. Sig < 0.05. It means that there was significant difference between pretest and posttest score of experimental group after treatment.
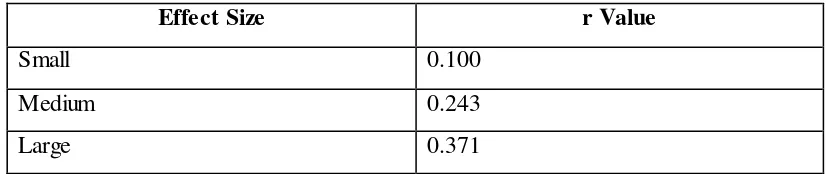
3.7.3.5 Effect Size
After calculating the dependent t-test for experimental group, the effect size was conducted to investigate the effect of the electronic journaling treatment toward students’ improvement in writing ability. The formula is as follows:
√
Note:
Desi Ristiani, 2016
IMPROVING STUDENTS’ ABILITY IN WRITING RECOUNT TEXT THROUGH ELECTRONIC JOURNALING
Universitas Pendidikan Indonesia | repository.upi.edu|perpustakaan.upi.edu
t = t value from the independent t-test
df = degree of freedom (N1+N2-2)
The result can be interpreted into three categories namely small, medium, and large as stated by Coolidge (2000) below:
Table 3.5 The Scale of Effect Size
Effect Size r Value
Small 0.100
Medium 0.243
Large 0.371
1.7.4 Data Analysis on Questionnaire
The questionnaire was conducted to find out students’ responses toward the implementation of electronic journaling in improving students’ writing Recount Text ability. The data from questionnaire were analyzed by some steps: inputting students’ answer; calculating the frequency of students’ answer in SPSS 20 for Windows; presenting the data into percentages; interpreting the data based
on some categories as previously stated.
1.8Concluding Remark
This chapter has presented some aspects related to the research methodology including research design, data collection, research site and participants, research procedure, and data analysis from pretest; posttest; and questionnaire. The next