Complex Network Simulation of Forest Network Spatial Pattern
in Pearl River Delta
Yuhuai Zeng *
Guangzhou Institute of Geography, Key Lab of Guangdong for Utilization of Remote Sensing and Geographical Information System, Guangzhou,510070, China, [email protected]
Commission IV, WG IV/3
KEY WORDS: landscape, ecology vulnerability, simulation, complex network, pattern planning
ABSTRACT:
Forest network-construction uses for the method and model with the scale-free features of complex network theory based on random graph theory and dynamic network nodes which show a power-law distribution phenomenon. The model is suitable for ecological disturbance by larger ecological landscape Pearl River Delta consistent recovery. Remote sensing and GIS spatial data are available through the latest forest patches. A standard scale-free network node distribution model calculates the area of forest network’s power-law distribution parameter value size; The recent existing forest polygons which are defined as nodes can compute the network nodes decaying index value of the network’s degree distribution. The parameters of forest network are picked up then make a spatial transition to GIS real world models. Hence the connection is automatically generated by minimizing the ecological corridor by the least cost rule between the near nodes. Based on scale-free network node distribution requirements, select the number compared with less, a huge point of aggregation as a future forest planning network’s main node, and put them with the existing node sequence comparison. By this theory, the forest ecological projects in the past avoid being fragmented, scattered disorderly phenomena. The previous regular forest networks can be reduced the required forest planting costs by this method. For ecological restoration of tropical and subtropical in south China areas, it will provide an effective method for the forest entering city project guidance and demonstration with other ecological networks (water, climate network, etc.) for networking a standard and base datum.
1. THE FOREST NETWORK SPATIAL-TEMPORAL CHARACTERISTICS
1.1The history of the forest system pattern changes
In the primitive society, the forests in the Pearl River Delta region were normally distributed. The ratio of forest coverage was very high in the region. For the great immigration during the past long history and the damaging of war and forest firing, the Pearl River Delta region and low hilly areas of forests had been gradually developed out. The forest shaped from the original heavy covers had been cut down. Finally, it been become mesh, island and linear structures in today. Now, the pressure of human development is far greater than the forest self-recovery abilities.
1.2 The modern urbanization invasion and disturbance to bring the landscape changes
Compared to Yellow River Delta's many times of the swing in north China, the Pearl River Delta region in south is more stable on natural changes. In the history of more than 2000 years of development, the original forest was almost cut down, hilly low mountain area was secondary or sparse forest; Now, Plain water network area grown up mulberry, tropical fruit lychee, longan, sugar cane and banana. Vegetation ecological function in the area is weak by which reason is the beach, wetland-based water ecological services as the main component. In particular, with nearly 40 years of reform and open policy of the external economy, urbanization over-development, population density continues to increase, the Delta soft depositional landscape gradually become cement steel, three-dimensional road network in urban areas. The tropical ecology of the Pearl River Delta gradually weakened and sustainable development was blocked. The ecosystem capacity is gradually reduced. In the event of sudden natural disasters, it is often short of the ability to return back and whose ecological flexibility (ecology resilience) is smaller. Such as in this areas, the spread of SARS epidemic in 2003, the cold winter snow and ice disasters in 2008, and the typhoon disasters in summer and autumn and the Avian Influenza Virus(H5N7) in winter, which have a greater impact on coastal marine economy, transportation and suburban aquaculture.
2. MODELING AND DATA COLLECTION METHODS
2.1 Corridor (Connecting Edges) and the number of nodes changes
Vertices: It defined as the land covers with bare, shrubs non-forest, grass, barren hills and so on.
Nodes: It start state for forest-free coverage, when the forest coverage reaches <30%, for the sparse network (edge number cannot exceed the integer number of nodes). When the forest coverage reaches> = 60%, it is a mature dense forest network. Forest Corridor: In the network theory is called edge (Edges). To rails, roads, rivers and other natural line types, it defined as the main basis and axis by which can connect the all size of nodes from the recent built forest belts.
2.2 Geometric changes: Changes in area and width
Between the nodes, as for the vegetation transported by wind or water flow or birds and other animal movements, will gradually along the corridor to the surrounding expansion and sprawling. Resulting in the node area S has a linear relationship with radius r², width a, and length b:
S = πr² = a *b, k ∝ r(a or b) (1) The node is round or rectangular, k is node degree): degree value is proportional to r, a or b. [Geoffrey B,2009]
2.3 Theoretical models and research methods on Scale Free or Forest Network
(1).Random network pattern: the connection between the node and the corridor in the plain area is mainly on shape of balanced network and random network; In the hills and lower mountains, there is a non-equilibrium state due to the obstruction and vertical differentiation of the mountains unbalanced network (2).Scale-free network pattern:
As in nature, scale-free, also known as "Allometric scaling " : Plant body size distributions, in particular, have long been of interest , and one of the most prevalent is the inverse relationship between size and abundance. In plant ecology and forestry, size–frequency distributions are perhaps one of the most general patterns and have been used to infer roles of competition and life history in structuring communities and for estimating biomass content, wood yield, carbon fluxes, and productivity of ecosystems.
Many natural biological phenomena are manifested as scale-free, power-rate distributions of nodes. Therefore, the law of scale-free distribution is defined as the theoretical and static model of forest network construction.
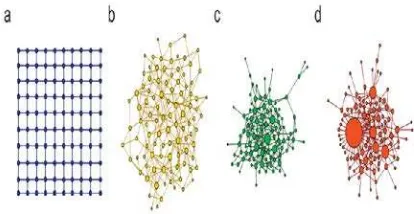
Figure 1: The four different kinds of network topology of forests: a: regular; b: random; c: exponent; d: scale free. Every node represents as a forest patch and link line as a corridor.
Size of node is proportional to r or degree values.
(3) The main features of the theory are: The Pearl River Delta forest system consists of 3~4 large nodes; Every large node is able to quickly build, control and to pin a large number of nodes by small number of nodes.
2.4 Proof and derivation of model approach
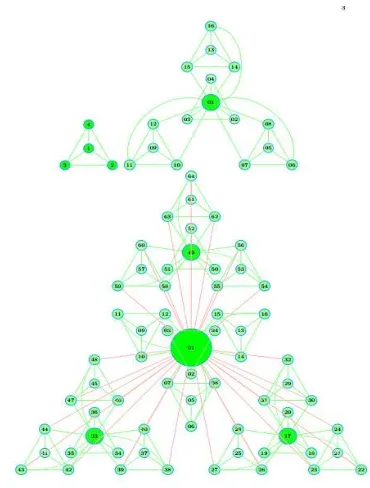
We use the basic model of complex network model: the deterministic scale-free network which is a Pseudo Fractal
Figure 2: Construction of the deterministic scale-free network, showing the first four steps of the iterative process. Number 01 is the centre Hub or node and Number 17,33,49 are sub node which combine the first level Hub of all 64 nodes. Number 17 contains 21,25,29 are second level of Hub. Number 1 contains 2,3,4 is third level of Hub.
3. THE GOAL OF VISUAL SOFTWARE MODELING
3.1 Programming Problem Requirements
The patches in the Fig3, afforest-able plots, are aim to build a scale-free network to quickly restore damaged forests, rather than randomly plant vegetation. We built model by spatial GIS data acquisition. The precision of model is not rigorous as long as it is a scale-free network (BA model or others). Of course, the model is computable, visual and verifiable.
Figure 3: The study object’s (afforest-able patches) area is mainly for greater than 1000 mu (66.6 hectares) in Pearl river delta.
(1) Ecological problems to be solved: Long-term overdevelopment in the history of the Pearl River Delta region which performed fragmentation of forest vegetation, were discontinuous distribution, and degradation of ecological functions.
(2) Objective: We’ll construct a model method (visualization and operable), restore the forest ecosystem and forest network structure in the Pearl River Delta, and achieve the past forest ecological functions, for example, which contain the size of the forest node, the network connectivity, Robust resistance to destruction and other indicators of the specific determination for the forestry ecology, environmental protection and urban planning departments to provide technical reference.
4. THE MODEL DEFINITION AND SIMULATION METHOD
4.1 Node Vertices
In a complex network, it generally abstracts as a point, regardless of its size, but in the ecosystem, the node need to be considered its size. Because the larger the forest node area, the higher the value of ecological services more powerful. We introduce a parameter: node radius “r”. According to the actual experience, we can see that r is positively related to the degree d of the nodes. The larger the r, the greater the connections between the node and the surrounding small nodes, the easier it is to generate and evolution to larger forest nodes.
4.2 Three parameters
It referred to "network connectivity", "robust survivability" in the value of forest protection:
The greater the degree of connectivity, it indicates that these nodes between the edges (greenway or corridor) is easier to form much easily into a network or a mature ecological network system.
Robustness is means that the mature forest network (coverage> 60%) of the region has formed. How the forest system will resist the spread of urbanization, the interspersing and segmentation of the traffic lines will continue to maintain the value of past forest services and function of the ability.
5. RESULTS
5.1 First level nodes (Corresponding area)
The Pearl River Delta East node, the Pearl River Delta North node, the Pearl River Delta West node, the South Islands Node.
Figure3:
The study objects are nearly 1000 patches divided5.2 Second level nodes
The western four cities (Zhuhai, Zhaoqing, Zhongshan and Jiangmen) are western node. The eastern three cities (Shenzhen, Dongguan, Huizhou), the north city of three cities(Guangzhou, Foshan, Qingyuan) are northern node. Hong Kong and Macao (through the Wanshan Series Islands, Nansha, respectively, are the Southern node. Zhuhai’s Wan-shan Series Islands are the hub that connect the East and West node.
5.3 Third level nodes ~ Fourth level nodes
Each county, district level selection of four towns or not forest, grassland area. The small scale study on the small mountains, watershed, independent hills, a single forest plaque. This object’s area is mainly for greater than 1000 mu (66.6 hectares) (afforest-able patches). To keep completeness of the patches, try to avoid roads, traffic lines, rivers, lakes etc. cutting from the patches. [Fig 4] Firstly we define that center of the geometry of every patch as nodes on account of distances between nodes. Use the random Voronoi diagram or Delaunay triangulation method to subdivide the 1000 nodes. Every node’s whole numbers of subdivision lines are the degree numbers. The degree numbers can be inquired from the GIS attribute databases and then calculate the degree distribution diagram.
Figure 4: The degree distribution of 1000 nodes of afforest network. The horizontal ordinate is the degree number and vertical is the patch count numbers of every degree number.
Figure 5: Third-Fourth level nodes of detail map. The purple zone is single afforest patch land. Blue double lines are rivers and yellow lines are main roads.
Each county, district level selection of four towns or not forest, grassland area. The small scale study on the small mountains, watershed, independent hills, a single forest plaque. This object’s area is mainly for greater than 1000 mu (66.6 hectares) (afforest-able patches). To keep completeness of the patches, try to avoid roads, traffic lines, rivers, lakes etc. cutting from the patches. [Fig 5]
ACKNOWLEDGEMENTS
The author would like to thank anonymous reviewer. The project is financed Guangdong forestry science and technology innovation special fund project: 2013KJCX007-01.
REFERENCES
A.-L. Barábasi, E. Ravasz, T. Vicsek, 2001. Deterministic scale-free networks, Phys. A: Statist. Mec. App. 299 (3–4) 529–564.
Bollobas, B., 2001. Random Graphs (2nd edn), Academic Press.
Barabási A-L., 2002. Linked: the new science of networks. Cambridge, MA: Perseus.
Barabasi,A.L.,Albert, R., 1999. Emergence of scaling in random networks. Science, 286, 509–512.
Chen J, Dai M, Wen Z, et al.,2014. Trapping on modular scale-free and small-world networks with multiple hubs[J].Physica A Statistical Mechanics & Its Applications, 393(1):542-552.
Dormann, C.F., Gruber, B. and Fründ, J., 2008. Introducing the bipartite package: analysing ecological networks. R News, 8, 8-11.
Erdo˝s P, Rényi A., 1959. On random graphs. Publicationes
Mathematicae6, 290–297.
Fortuna, M. A., Gomez-Rodriguez, C., & Bascompte, J., 2006. Spatial network structure and amphibian persistence in stochastic environments. Proceedings of the Royal Society of London Series B, 273, 1429–1434.
Geoffrey B. West,Brian J. Enquist, and James H. Brown, 2009. A general quantitative theory of forest structure and dynamics, PNAS 106 (17) 7040-7045.
Harris L.D., 1984. The Fragmented Forest: Island Biogeography Theory and Preservation of Biotic Diversity. University of Chicago Press : Chicago, IL.
JasonM.Tylianakis, Etienne Laliberté, Anders Nielsen, and Jordi Bascompte , 2010. Conservation of species interaction networks. Biological Conservation.Vol.143,Isu.10, October 2010, pp:2270-2279, ISSN 0006-3207.
J.Bascompte., 2007. Networks in ecology. Basic and Applied Ecology, 8:485–490.
Milgram,S., 1967. The small world problem. Psych.Today 2, 60–67.
May, R. M., 2006. Network structure and the biology of populations. Trends in Ecology and Evolution, 21,394–399.
McGarigal, K., Marks, B.J., 1995. FRAGSTATS: Spatial Analysis Program for Quantifying Landscape Structure. USDA Forest Service General Technical Report PNW-GTR-351.
Newman, M.E.J., 2003. The structure and function of complex networks. SIAM Rev.45, 167–256.
O’Neill, R.V., Krummel, J.R., Gardner, R.H., Sugihara, G., Jackson,B., DeAngelis, D.L., Milne, B.T.,Turner, M.G., Zygmunt, B.,Christensen, S.W., Dale, V.H., Graham, R.L., 1988. Indices of landscape pattern. Landscape Ecol.1,153–162.
Watts,D.J.and Strogatz,S.H., 1998. Collective dynamics of ‘small world’ networks. Nature 393, 440–442.