CHANGE DETECTION BY FUSING ADVANTAGES OF THRESHOLD AND
CLUSTERING METHODS
M. Tan *, M. Hao
School of Environment and Spatial Informatics, China University of Mining and Technology, 221116 Xuzhou City, China- [email protected], [email protected]
KEY WORDS: Change Detection, Medium Resolution, Remote Sensing, Threshold, Clustering, Advantage Fusion
ABSTRACT:
In change detection (CD) of medium-resolution remote sensing images, the threshold and clustering methods are two kinds of the most popular ones. It is found that the threshold method of the expectation maximum (EM) algorithm usually generates a CD map including many false alarms but almost detecting all changes, and the fuzzy local information c-means algorithm (FLICM) obtains a homogeneous CD map but with some missed detections. Therefore, we aim to design a framework to improve CD results by fusing the advantages of threshold and clustering methods. Experimental results indicate the effectiveness of the proposed method.
* Corresponding author
1. INTRODUCTION
The Change detection (CD) from remote sensing images identifies changes by analyzing multitemporal images acquired in the same geographical area at different times, such as land use/land cover, damages due to earthquakes, floods and fires, changes of roads, cities, and plants (Lu et al., 2004). In the past three decades, lots of CD methods have been proposed to automatically achieve accurate CD results (Hao et al., 2014; Moser et al., 2011). All methods can be grouped into supervised and unsupervised types. The former detects changes and supply change types by comparing the classification images of bitemporal images. However, it needs the ground reference, which limits its application. The latter identifies changes without the ground reference, therefore, the study in this paper focuses on the unsupervised ones.
Three steps are usually involved: 1) pre-processing, 2) image comparison and 3) image analysis (Singh, 1989). In the first step, several corrections need implementing between bitemporal images to reduce the effects of light and atmospheric condition, such as co-registration, radiometric corrections (Mishra et al., 2012; Ye and Shan, 2014). In the second step, the difference image is generated by pixel-by-pixel comparing between bitemporal images. Many methods have been used to generate the difference image, including the image differencing, image ratio, image correlation, image regression, log ratio for synthetic aperture radar (SAR) images and change vector analysis (CVA) (Shi et al., 2016). In the third step, the difference image is analyzed and divided into changed and unchanged parts. In the beginning, the visual analysis was applied to detect changes, which costs much time and limits the production efficiency (Sader and Winne, 1992). Afterward, a trial-and-error threshold method was implemented by changing the threshold value, and an empirical threshold method was developed to identify changes using xi m T , where xi is the gray value of the
i-th pixel, T is a constant, m and are the mean and standard deviation of the difference image, respectively (Fung and LeDrew, 1988). In order to improve the efficiency, some
automatic threshold methods were proposed (Bazi et al., 2005; Huang and Wang, 1995; Im et al., 2008). One of the most popular threshold methods was proposed by Bruzzone, where the difference image is supposed as mixture Gaussian model and the Bayes rule for minimum error is adopted to calculate the threshold using expectation maximum (EM) algorithm(Bruzzone and Prieto, 2000). Due to many false alarms existing in the change map obtained by threshold, the spatial information was introduced by some advanced models, such as Markov random model (Gu et al., 2015; Subudhi et al., 2016), , support vector machine (Nemmour and Chibani, 2006), artificial neural network (Wang et al., 2015; Xu et al., 2015), wavelet transform (Celik and Ma, 2011), active contour model (Hao et al., 2014; Li et al., 2015) and fuzzy c-means clustering (FCM) algorithm (Ghosh et al., 2011; Krinidis and Chatzis, 2010; Mishra et al., 2012). The ranges of pixel gray values in difference image belonging to the changed and unchanged clusters often have overlap, FCM has robust characteristics for ambiguity and provides an appropriate choice to identify them by using fuzzy set information (Ghosh et al., 2011). The improved ones mainly contain an improved local energy term of exploiting spatial information. A robust fuzzy local information
c-means (FLICM) was proposed by Krindis and Chatzis (Krinidis and Chatzis, 2010) for image segmentation. A novel fuzzy factor was added into FCM to guarantee noise insensitiveness and image detail preservation. Gong et al. (Gong et al., 2012) improved the fuzzy factor of FLICM by reshaping the effects of neighbor pixels on the center pixel, called reformulated FLICM (RFLICM), which improves the utilizing manner of local information by modifying the fuzzy factor. It is found that the threshold method, i.e., the EM algorithm, usually generates more false alarms but less missed detections than clustering algorithm, such as active contour model and FLICM. The EM-based threshold method generates a CD map including many false alarms but almost detecting all changes. FLICM obtains a CD map including less false alarms. Therefore, we aim to design a framework to improve CD results by fusing the advantages of threshold and clustering methods.
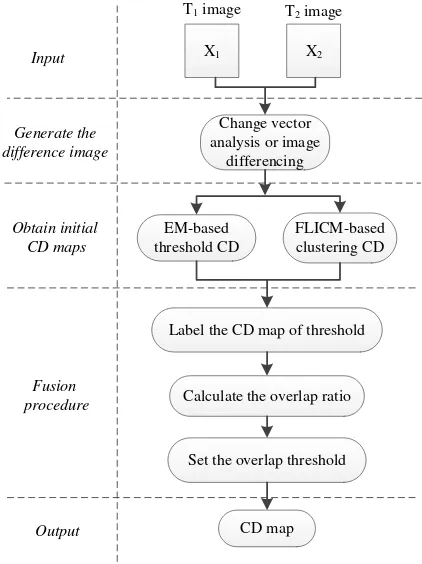
The designed framework mainly includes three blocks. First, CVA is used to bitemporal images to produce the difference image. Second, EM-based threshold and FLICM are implemented the difference image and two initial CD maps are yielded. Then, an advantage fusion strategy is proposed to fuse two initial CD maps by taking full use of their advantages and obtain the final CD map.
EM-based
Label the CD map of threshold
Calculate the overlap ratio
Figure 1. Flowchart of the designed framework
2. METHODOLOGY
2.1 EM-based Threshold CD
Let X1 and X2 be two multispectral images acquired from the same geographical area at two different times. Assuming images have been co-registered and radiometrically corrected, the two images have the same size of M × N. The difference image X is generated by the magnitude of the CVA method, and consists of changed pixels W1 and unchanged pixels W2.
In this study, it is assumed that the difference image X can be seen as a Gaussian mixture, as follows:
1 1 2 2 probabilities of changed pixels and unchanged pixels, respectively. The probability density functions p(X/W1) and
the corresponding pixels of class Wk.
Given that, EM can be performed to estimate the mean values
pixels and regarded as the initial values to EM.
Step 2: Expectation step. The equations (1) and (2) are used to evaluate the a posterior probability P(Wk/X) with the equation Step 3: Maximization step. Re-estimate the parameters using the following equations: Finally, the mean values are estimated.
Finally, the Bayes rule for minimum error is adopted to calculate the threshold T0according to the following equation:
extended by Bezdek (Bezdek, 1981). This clustering algorithm aims at producing and optimal c partition through an interactive clustering process. Suppose there are N pixels in the difference image X
x x1, 2, ,xN
, and c is the number of the clusters. The FCM aims at obtaining membership probability uki
0,12 Chatzis (Krinidis and Chatzis, 2010) proposed a robust FLICM clustering algorithm to overcome the disadvantages of the absence of spatial information in the initial FCM algorithm. A fuzzy local similarity measure factor G was added into FCM, aiming to guarantee noise insensitiveness and image detail preservation, and the modified objective function is written as
2 Additionally, the added local factor is defined as follows
2 pixel represents the neighborhood pixels within the currently local window of the i-th pixel, and dijis the spatial Euclideandistance between pixels i and j. ukj denotes the fuzzy
membership of the gray value j in terms of the k-th cluster, and
k
v represents the prototype of the center of cluster k. 2.3 Fusion of two kinds of CD Maps
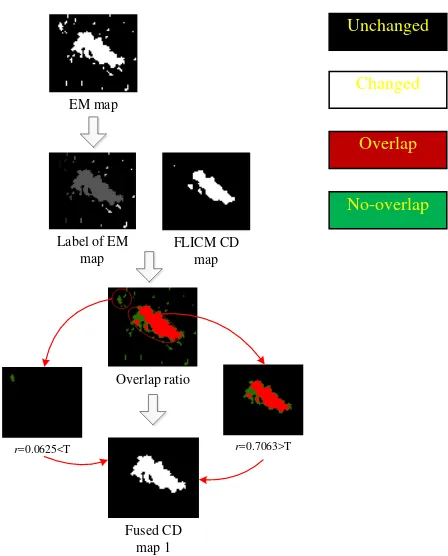
Figure 2. Flowchart of the spatial advantage fusion strategy
In this study, it is supposed that changes usually occur as a region in remote sensing images. For CD methods incorporating contextual information, they usually miss changes around edges because of over-use contextual information, such as FLICM. The EM-based threshold method can detect almost all changes
and remain accurate shapes of changed regions. Therefore, the CD map of FLICM is adopted to refine the one obtained by the EM threshold method. The flowchart of the spatial advantage fusion strategy is shown in Figure 2. The details can be found as follows.
Step 1: Label the EM CD map. For the EM CD map, the independent changed regions are labeled as clusters
i,1
C C i n for the connected components with four
connected pixels, labeled from 1 to n, as shown in Figure 1.
Step 2: Calculate the overlap ratio for each cluster. For the labeled cluster Ci, the overlap ratio ri is calculated referencing
the FLICM CD map using rin n1 2, where n1 is the pixel
number in Ci and n2 is the number of changed pixels in the corresponding region of FLICM CD map.
Step 3: Set a threshold T to the overlap ratio ri. If ri<T, the
cluster Ci remains as changes; in contrary, it is removed as false
alarms.
3. EXPERIMENTS AND DISCUSSION
In order to evaluate the effectiveness of the proposed method, several experiments were carried out on two remotely sensed datasets. Additionally, four common methods were implemented as a comparison, including EM threshold, fusion of EM and Markov random field (EMMRF), multiscale level set (MLS) and FLICM. Four indices are used to assess the results as follows.1) Missed detections Nm that indicate the number of incorrectly classified unchanged pixels in the CD map. The ratio of missed detections Pm is calculated by
m
m 0
100%
P
N
N
, where N0 is the total number of changed pixels counted in the ground reference map; 2) False alarms Nf that indicate the number of the incorrectly classified changed pixels in the CD map. The ratio of false alarms Pf is calculated with the ratioP
f
N N
f 1
100%
, where N1 is the total number of unchanged pixels counted in the ground reference map; 3) Total errors Nt that indicate the total number of detection errors, including both missed and false detections. This total number refers to the sum of missed detections and false alarms. Hence, the ratio of total errors Pt is calculated withm f Figure 3(a) and (b) show the band 4 of 2000 and 2002 images, respectively. A reference map was manually obtained by a detailed visual analysis of both the available multitemporal images and the difference image as shown in Figure 3(c).
(a) (b) (c)
Figure 3. Band 4 of datasets acquired in (a) April 2000 and (b) May 2002, (c) ground reference map
Unchanged
Changed
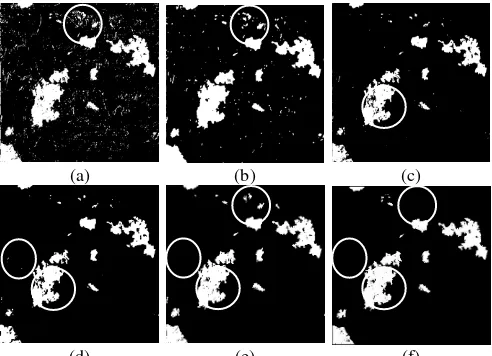
Figure 4 shows the CD maps obtained by EM, MRF, MLS, FCM, FLICM and the proposed method, respectively. The values of the parameter in EMMRF and μ in MLS were set to 1.6 and 0.2, and the overlap threshold T in the proposed method was set to 0.3. As can be seen in Figure 4(a), the change map of EM contains almost all changes, but many false alarms exist at the same time (e.g., circle region). EMMRF gives homogeneous regions by using spatial context, but much detailed information is removed and lots of spots still exist as shown in the circle region of Figure 4(b). This is explained by the factor that it depends on the initial CD map of EM and neglects the fuzzy spatial information. The results of MLS contain lots of spots as presented in Figure 4(c), and the reason is that it clusters without considering spatial information. In contrast, FLICM gives more homogenous CD maps than MLS due to incorporating local information, but it missed some detailed changes due to the overuse of spatial information. However, the proposed method can remove false alarms more efficiently as shown in the circle regions of Figure 4(e) and generates the most similar CD map to the ground reference among all the methods in this study. The reason is that the proposed method reduces the false alarms existing in the EM-based results by taking advantage of the ones of FLICM. In summary, the proposed method supplies an effective method for unsupervised change detection.
(a) (b) (c)
(d) (e) (f)
Figure 4. CD results of datasets obtained by (a) EM, (b) EMMRF, (c) MLS, (d) FLICM, (e) proposed method, and (f) is the ground reference map.
Table 1 presents the accuracy comparisons of missed detections, false alarms, total errors and kappa coefficient among these seven methods. EM results in the maximum false alarms of 9792 pixels, and EMMRF generates the minimum missed detections of 796 pixels and false alarms of 5076 pixels, which reduces missed detections and false alarms compared with EM by incorporating spatial information. MLS produces the missed detections of 4071 pixels, but MLS obtains less false alarms than EM and EMMRF. For FLICM, it reduces many false alarms compared with EM due to the introduction of local information, where the total errors are 4947 pixels. It is worth noting the proposed method obtained the most accurate CD results among all methods used in this study via the total errors and kappa coefficient, and the missed detections, false alarms, and total errors are 1372, 2229 and 3601, respectively. More importantly, it results in fewer missed detections than FLICM and much less false alarms than EM, which indicates the
effectiveness of the proposed method that removes false alarms and preserves detailed changes.
Table 1. Quantitative CD results
Method Missed detections False alarms Total errors No. Pm No. Pf No. Pt
EM 1329 5.19 9792 4.14 11121 4.24 0.7901
EMMRF 796 3.11 5076 2.15 5872 2.24 0.8817
MLS 4071 15.91 992 0.42 5063 1.93 0.8842
FLICM 4109 16.06 838 0.35 4947 1.89 0.8864
Proposed 1372 5.36 2229 0.94 3601 1.37 0.9232
4. CONCLUSION
A framework of fusing advantages of threshold and clustering methods to remove false alarms and preserve detailed changes simultaneously. Experiments were conducted on Landsat EMT+ data sets to demonstrate the performance of proposed method. The total errors and kappa coefficient obtained by the proposed method are 3601 and 0.9232. Compared with some state-of-the-art methods (i.e., EM, EMMRF, MLS, and FLICM), the proposed method achieves improvements in both accuracy and visual interpretation. Results indicate that proposed method not only obtains more homogenous CD maps but preserves more detailed features than other methods in this paper. In total, the proposed method provides an effective unsupervised CD method from remote sensing images.
ACKNOWLEDGEMENTS
The work presented in this paper is supported by the Natural Science Foundation of Jiangsu Province under Grant BK20160248.
REFERENCES
Bazi, Y., Bruzzone, L., Melgani, F., 2005. An unsupervised approach based on the generalized Gaussian model to automatic change detection in multitemporal SAR images. IEEE Transactions on Geoscience and Remote Sensing, 43(4), pp. 874-887.
Bezdek, J.C., 1981. Pattern recognition with fuzzy objective function algorithms. Kluwer Academic Publishers, Norwell, MA, USA.
Bruzzone, L., Prieto, D.F., 2000. Automatic analysis of the difference image for unsupervised change detection. IEEE Transactions on Geoscience and Remote Sensing, 38(3), pp. 1171-1182.
Celik, T., Ma, K.K., 2011. Multitemporal Image Change Detection Using Undecimated Discrete Wavelet Transform and Active Contours. IEEE Transactions on Geoscience and Remote Sensing, 49(2), pp. 706-716.
Dunn, J.C., 1973. A fuzzy relative of the ISODATA process and its use in detecting compact well-separated clusters.
Journal of Cybernetics, 3(3), pp. 32-57.
Fung, T., LeDrew, E., 1988. The determination of optimal threshold levels for change detection using various accuracy indices. Photogrammetric Engineering and Remote Sensing, 54(10), pp. 1449-1454.
Ghosh, A., Mishra, N.S., Ghosh, S., 2011. Fuzzy clustering algorithms for unsupervised change detection in remote sensing images. Information Sciences, 181(4), pp. 699-715.
Fuzzy Clustering. IEEE Transactions on Image Processing, 21(4), pp. 2141-2151.
Gu, W., Lv, Z., Hao, M., 2015. Change detection method for remote sensing images based on an improved Markov random field. Multimedia Tools and Applications, pp. 1-16.
Hao, M., Shi, W.Z., Zhang, H., Li, C., 2014. Unsupervised Change Detection With Expectation-Maximization-Based Level Set. IEEE Geoscience and Remote Sensing Letters, 11(1), pp. 210-214.
Huang, L., Wang, M., 1995. Image thresholding by minimizing the measures of fuzziness. Pattern Recognition, 28(1), pp. 41-51.
Im, J.H., Jensen, J.R., Hodgson, M.E., 2008. Optimizing the binary discriminant function in change detection applications.
Remote Sensing of Environment, 112(6), pp. 2761-2776. Krinidis, S., Chatzis, V., 2010. A Robust Fuzzy Local Information C-Means Clustering Algorithm. IEEE Transactions on Image Processing, 19(5), pp. 1328-1337.
Li, H., Gong, M., Liu, J., 2015. A Local Statistical Fuzzy Active Contour Model for Change Detection. IEEE Geoscience and Remote Sensing Letters, 12(3), pp. 582-586.
Lu, D., Mausel, P., Brondizio, E., Moran, E., 2004. Change detection techniques. International Journal of Remote Sensing, 25(12), pp. 2365-2401.
Mishra, N.S., Ghosh, S., Ghosh, A., 2012. Fuzzy clustering algorithms incorporating local information for change detection in remotely sensed images. Applied Soft Computing, 12(8), pp. 2683-2692.
Moser, G., Angiati, E., Serpico, S.B., 2011. Multiscale Unsupervised Change Detection on Optical Images by Markov Random Fields and Wavelets. IEEE Geoscience and Remote Sensing Letters, 8(4), pp. 725-729.
Nemmour, H., Chibani, Y., 2006. Multiple support vector machines for land cover change detection: An application for mapping urban extensions. ISPRS Journal of Photogrammetry and Remote Sensing, 61(2), pp. 125-133.
Sader, S., Winne, J., 1992. RGB-NDVI colour composites for visualizing forest change dynamics. International Journal of Remote Sensing, 13(16), pp. 3055-3067.
Shi, W., Shao, P., Hao, M., He, P., Wang, J., 2016. Fuzzy topology–based method for unsupervised change detection.
Remote Sensing Letters, 7(1), pp. 81-90.
Singh, A., 1989. Digital change detection techniques using remotely-sensed data. International Journal of Remote Sensing, 10(6), pp. 989-1003.
Subudhi, B.N., Ghosh, S., Nanda, P.K., Ghosh, A., 2016. Moving object detection using spatio-temporal multilayer compound markov random field and histogram thresholding based change detection. Multimedia Tools and Applications, pp. 1-33.
Wang, Q., Shi, W., Atkinson, P.M., Li, Z., 2015. Land cover change detection at subpixel resolution with a Hopfield neural network. IEEE Journal of Selected Topics in Applied Earth Observations and Remote Sensing, 8(3), pp. 1339-1352. Xu, D., Ricci, E., Yan, Y., Song, J., Sebe, N., 2015. Learning deep representations of appearance and motion for anomalous event detection. arXiv preprint arXiv:1510.01553, pp.