OPTIMIZING ENERGY CONSUMPTION IN VEHICULAR SENSOR NETWORKS BY
CLUSTERING USING FUZZY C-MEANS AND FUZZY SUBTRACTIVE ALGORITHMS
Aref Ebrahimi a, Parham Pahlavani b* , Zohreh Masoumi c
a MSc. Student in GIS Division, School of Surveying and Geospatial Eng., College of Eng., University of Tehran, Tehran, Iran - [email protected]
b Assistant Professor, Center of Excellence in Geomatics Eng. in Disaster Management, School of Surveying and Geospatial Eng., College of Eng., University of Tehran, Tehran, Iran - [email protected]
c Assistant Professor, Department of Earth Sciences, Institute for Advanced Studies in Basic Sciences, Zanjan, Iran - [email protected]
KEY WORDS: Wireless Sensor Networks, Traffic Information Systems, Optimization, Clustering, Energy Consumption, Clustering, Fuzzy C-means Algorithm, Fuzzy Subtractive Algorithm
ABSTRACT:
Traffic monitoring and managing in urban intelligent transportation systems (ITS) can be carried out based on vehicular sensor networks. In a vehicular sensor network, vehicles equipped with sensors such as GPS, can act as mobile sensors for sensing the urban trafficand sending the reports to a traffic monitoring center (TMC) for traffic estimation. The energy consumption by the sensor nodes is a main problem in the wireless sensor networks (WSNs); moreover, it is the most important feature in designing these networks. Clustering the sensor nodes is considered as an effective solution to reduce the energy consumption of WSNs. Each cluster should have a Cluster Head (CH), and a number of nodes located within its supervision area. The cluster heads are responsible for gathering and aggregating the information of clusters. Then, it transmits the information to the data collection center. Hence, the use of clustering decreases the volume of transmitting information, and, consequently, reduces the energy consumption of network. In this paper, Fuzzy C-Means (FCM) and Fuzzy Subtractive algorithms are employed to cluster sensors and investigate their performance on the energy consumption of sensors. It can be seen that the FCM algorithm and Fuzzy Subtractive have been reduced energy consumption of vehicle sensors up to 90.68% and 92.18%, respectively. Comparing the performance of the algorithms implies the 1.5 percent improvement in Fuzzy Subtractive algorithm in comparison.
1. INTRODUCTION
Nowadays, transportation is a subject that people are associated with it. In addition, by the development of cities, the need for public services and facilities has been increased. This issue draws attentions to the subjects such as urban transportation (Seredynski and Bouvry, 2011).
Due to the increasing volume of urban traffic and its undesirable effects on economy, environment, and community health, effective management of urban traffic has become a remarkable subject. In recent years, the use of new technologies and techniques in management of urban traffic in most countries
has been considered as the best solution to the metropolises’
traffic volume. One of the newest and most effective techniques of traffic management, which takes the advantages of information technology, is to use intelligent transportation systems. Generally, the goal of design and implementation of a traffic management system is collecting, estimating, and propagating the traffic information. Particularly, in a cooperative traffic management system, this information is collected and transferred between vehicles (Bali et al., 2014). Due to the use of wireless sensor networks to develop traffic information systems, paying attention to the general aspects of these networks is required. One of the most challenging issues of design criteria is resource constraints that as a consequence, leads to traffic volume balancing and energy consumption issues (Bali et al., 2014). Sometimes, some parts of the network have huge volumes of traffic and information. In order to resolve the bandwidth issue in high-volume parts of the network, clustering techniques are useful. Using clustering, cluster heads are responsible for gathering and aggregating the information of clusters. Then, it transmits the information to the
data collection center. The use of clustering decreases the volume of transmitting information, and consequently, it balances the traffic volume in busy parts of the network. Due to this, the amount of energy consumption of sensors to transmit the data is also reduced (Vodopivec et al., 2012; Lee et al., 2016; Abbasi and Younis, 2007; Boyinbode et al., 2011). A lot of researches have been conducted on using wireless sensor networks in traffic management area, using different clustering methods.
Fundamental limitation and problem of wireless sensor networks is extending the life time of sensors provided from batteries. Fundamental solution to extend the life of these networks is optimizing the energy consumption of sensors. Karthikeyan et al. (2013) compared five hierarchical routing protocols for energy efficiency routing, developed by the classical protocol LEACH. The researchers focus was on how to increase lifespan and reduce the power consumption of wireless sensor networks. Wireless sensor networks consist of hundreds of thousands of sensor nodes that are responsible to collect important data including temperature, location, and etc. These networks are used in different fields such as health monitoring, military applications, and etc. Another problem in this area is recharging or replacing the sensor nodes that have limited battery capacity. Therefore, energy efficiency is a key issue in maintaining the network (Park et al., 2013).
Clustering as technique to group adjacent nodes, firms the network (Robust), and makes it scalable. Vodopivec et al. (2012) reviewed clustering techniques and proposed a clustering algorithm for Ad-hoc vehicle networks. They investigate various clustering algorithms, pointed out each one’s goals, characteristics, advantages, and limitations.
Bali et al. (2014) considered clustering mechanism in vehicle sensor networks as a grouping method based on density, speed, and geographical position and due to the above factors, investigated the challenges and solutions in the clustering of vehicle sensor networks.
Khan and Seth (2014) have proposed a clustering technique on the network with less communication to sink nodes and operate network hierarchically. As a result, network costs and energy consumption will be reduced. The techniques used K-means and FCM.
Park et al. (2013) proposed an efficient method to select cluster-heads using the K-means algorithm in their research to maximize energy efficiency of wireless sensor networks. The proposed method is based on minimization of the sum of the distances between cluster-heads and member nodes. The researchers demonstrated that the proposed method outperformed the existing protocols such as LEACH and HEED.
Bandyopadhyay and Coyle (2013) suggested a distributed, randomized clustering algorithm to organize the sensors in a wireless sensor network. They extended this algorithm to generate a hierarchy of cluster heads and observed that the energy savings increase with the number of levels in the hierarchy.
Given the notes above, the goal of this study is to optimize the traffic data transfer in vehicular sensor networks using spatial clustering. This study aims, in particular, at optimizing the traffic data transfer from an energy consumption perspective. The clustering is applied using FCM and Fuzzy Subtractive clustering, energy consumption modelling, and FCM and Fuzzy Subtractive algorithms. In Section 3, the methodology of the research is discussed. Section 4 introduces the dataset and the study area. The results and discussions are provided in Sections 5 and 6, respectively. Finally, Section 6 also concludes the study and provides some suggestions for future works.
2. FUNDAMENTALS OF THE RESEARCH
In literature of sensor networks, clustering is the process of grouping close or similar sensors. Similarity criteria of clustering can be different depending on the research target. In this study, clustering is used as a way to reduce sensors energy consumption. Hence, in following of the paper, fundamental concepts of the employed clustering methods will be discussed.
2.1 Fuzzy C-MEANS Clustering Algorithm
Fuzzy C-MEANS (FCM) is a clustering algorithm for non-crisp data such that similar to hard mode of this algorithm, a cost function of dissimilarity criterion is to be minimized. In clustering using this algorithm (and in general, fuzzy clustering algorithms), each point can be a member of different clusters with different membership degree in the range of zero to one. It is based on minimization of the following (Equation 1) objective function (Chaung et al., 2006).
points (Usually the Euclidean distance function).In fact, fuzzy partitioning is carried out through an iterative
This process is repeated until a stopping criterion is met.
2.2 Fuzzy Subtractive Clustering Algorithm.
Fuzzy Subtractive clustering algorithm considers a set of points as candidates for center of cluster. Initially, it is assumed that all of the points are possible to be chosen as the center of cluster. Then, a competency criterion, termed density measure, is computed for all the points using Equation 3.
2
where ra is a positive constant and refers to the neighbourhood radius, and n is the total number of data points. The more the data points in the vicinity of a point, the more the value of the density measure for that point and consequently, the more the competency of that point to be chosen as the first center of cluster. After computing the density measure for all points, the point corresponding to the highest value of competency will be chosen as the center of cluster. When the first center of cluster is found, the algorithm searches to find the second and, similarly, the other centers of clusters. For this purpose, the density measure values of other points should be first updated using Equation 4, such that the points that are closer to the center of cluster have a lower chance to be chosen.
1 center in which the values of the density measure is decreased. The value of rb is usually set up to 1.5 times of ra. Now, by taking into account the values of density measure for other points, the second center is chosen (Hammouda and Karray, 2000; Pal and Chakraborty, 2000).
3. METHODOLOGY
In this part the methodology of the research and how clustering methods have been structured will be discussed.
3.1 Cost function of the clustering algorithms
Energy consumption in sensor networks is a function of two factors, computation and data transmission. Sending data uses much more energy than computation. The energy consumption
of each sensor during data transmission is a function of sensor’s
hardware features and depends on two factors: size of the data packets and transmission range(Zytoune et al., 2010).
In the energy modelling of this study, distance to destination of each sensor (cluster-head or sink node) is determined and the range of transmission is changing according to that. This would spend less energy to send data to closer destinations. In many papers (Zytoune et al., 2010; Le Borgne et al., 2007), the power consumption of sensors can be defined as Equation 5:
2 0 sensor characteristics such as Modulation, filtering, signal propagation, and so on, 2fsd and 4
mpd are amplifier power depend on the distance between the transmitter and receiver and acceptable bit error value. Also, value of d0 can be calculated
amplifiers in multi-path and open space cases, respectively (Fadaei et al., 2016). hardware characteristics of the sensor. This energy consumption model exactly matches the model of methods used by Heinzelman et al. (2002) and Zytoune et al. (2010).
At the end, clustering algorithms has been run using the mentioned cost function.
3.2 Structure of transmitting packets
As previously mentioned, the power consumption during data transmission depends on the length of the packets. As a result, it is necessary to determine an overall structure for data packets so that the packets length can be achieved. The first hypothesis of this study is that common nodes only pack the sensed data from the environment into the package and send it to the cluster-head. Cluster-heads gather the collected data from the members of the cluster and send them to the sink node (information collection center). For this purpose, the easiest method is to consider equal and constant length for data packets. The major flaw of this method is that advantages and disadvantages of aggregated data in cluster-heads cannot be presented correctly. When it is assumed that cluster-heads are responsible for aggregating the information, it is expected that transmitting packets of a cluster-head are larger than the transmitting packet of a common node. Also a cluster with a greater number of and a data. Cluster-head packets have also a header and include all the data from the cluster members. In summary, the length of each section is as follows:
For variable packet length, each packet header is 24 bytes, and any data sensed by a sensor is 24 bytes (Le Borgne et al., 2007). Also, integration of all the data in cluster-head is considered as all member sensor data plus the header.
3.3 Fuzzy C-means and Fuzzy subtractive algorithms coordination with problem
Considering the dataset and the type of problem, to compare the performances of the algorithms, 5 clusters were determined. To implement the FCM algorithm, the Distance between each sensor (vehicle) and cluster head, is Obtained based on the Euclidean distance function. According to these distances, the amount of energy consumption of data transfer will be calculated. Also, the degree of fuzziness (m) was chosen to be of 2.
The algorithm was applied for 100 times, each time with different initial values and in 100 iterations, on the sensors. Similarly, to implement the fuzzy subtractive algorithm, the Distance between each sensor (vehicle) and cluster head, is Obtained based on the Euclidean distance function. And as mentioned earlier, ra is considered equal to 75 m and the value of rb is set up to 1.5 times of ra.
4. IMPLEMENTATION
The algorithms and mechanisms have been implemented using MATLAB in a computer with a 4 GB RAM and an Intel Core 2 Duo T8100 / 2.1 GHz.
4.1 The study area and dataset
The dataset used in this study involves the passing vehicles’
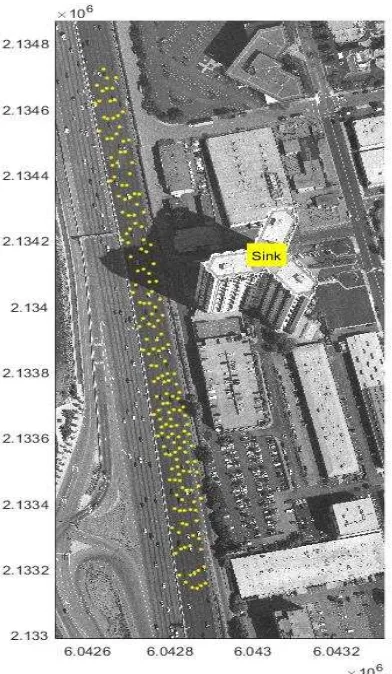
trajectories toward the west via the interstate highway 80 of the Emeryville in the California State. The data have been collected on 13 April 2005 during a 15 minutes period. In this study, the collected data from the hour 16 to 16:15 have been used. This dataset has been gathered via 7 cameras installed on top of a 30-storey building in the vicinity of the study area. The location of the sink is also considered on the top of this building. The trajectory data have been extracted from the video data using a dedicated program. This program automatically recognizes almost all the vehicles and tracks their path. In this way, the
vehicles’ trajectories in the specified range can be obtained.
Those vehicles that are not recognized can be manually tracked, so that their trajectories are obtained. The dataset includes the (x, y) positions of vehicles with the temporal resolution of 0.1 of a second. For each vehicle in any recorded position, information such as the length and the width of the vehicle, instantaneous velocity and acceleration of the vehicle, the ID of the band that the vehicle is passing, the number of leading and pursuing vehicles in the same band, the distance (and time) to the vehicle in front are also recorded. In this study, the positions of 181 vehicles in a frame have been used. The locations of vehicles (sensors) and the sink are shown in Figure 1.
Figure 1. The location of vehicular sensors and the sink
4.2 Definition of the simulation parameters
The parameters used in the simulation are presented in Table 1.
Value Parameter
Description
2
10
pJ bit m
fs Energy consumed bythe amplifier to send to close destinations
4
0.0013
pJ bit m
mp Energy consumed by
the amplifier to send to farther destinations
50nJ
elec TX RX
E E E
Energy consumption in electronic circuits to send or receive
data
5nJ bit
DA
E
Energy consumption for data integration
in the cluster head
Table 1. Energy Consumption Parameters in the Simulation
5. RESULTS
In this study, the FCM and Fuzzy Subtractive algorithms were used to cluster the vehicular sensors and their impact on decreasing the energy consumption of sensors was explored. For this dataset, if no clustering had been made to the sensors and each sensor directly transmits its own information to the
sink, the amount of energy consumed by the whole network would be equal to 20.6 units. The best solution is presented in Table 2. The performance of the FCM algorithm has been enhanced, up to iteration 50, by about 90.68 percent in energy consumption, after that the algorithm has been converged. The clustering obtained by the FCM algorithm applied on the dataset is shown in Figure 2. In addition, the decreasing trend of the cost function (the total amount of energy consumption of sensors) in iterations 1 through 100 has been shown in Figure 3.
Algorithm FCM
The number
of iteration 10 20 50 100
Total energy consumption of Network
2.23 2.00 1.92 1.92
The amount of reduction of
energy consumption
89.17% 90.29% 90.68% 90.68%
Table 2. The performance of the FCM algorithm in decreasing the amount of energy consumption of sensors
Figure 2. The best clustering result obtained by applying the FCM algorithm over 100 iterations
Figure 3. The decrease in the total amount of energy consumed by the network over 100 iterations using the FCM algorithm
The result of the Fuzzy Subtractive algorithm is shown in Figure 4. Moreover, the effect of the neighbourhood radius ra on the Fuzzy Subtractive algorithm has been explored. Figure 5 shows the effect of ra on the total energy consumed by sensors.
Figure 4. The clustering obtained by applying the Fuzzy Subtractive algorithm (with ra=75 m )
Figure 5. Relationship between Neighbourhood radius (ra) in Fuzzy Subtractive clustering and cost function (energy
consumption)
It is clear from the results of this algorithm that choosing a very small or very large ra will result in more energy consumption because if rais chosen very small thedensity function will not take into account the effect of neighbouring data points; while if it is chosen very large, the density function will be affected all the data points in the data space. So, a value between 70 and 100 should be adequate for the radius of neighbourhood. The best clustering, which corresponds to the least amount of energy consumption, has obtained using ra equal to 75 m and is shown in Figure 4. The least amount of energy consumption in this clustering is equal to 1.5 units and results in a decrease by about 92.18 percent in the energy consumption.
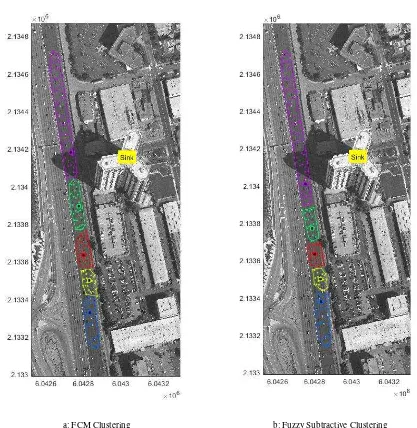
As it was shown, both algorithms have significant effects on the total amount of energy consumption and have reduced the consumption about 90.68% and 92.18%, respectively. Generally, for the dataset used in this study, the Fuzzy Subtractive algorithm provided better results than those achieved by FCM algorithm by about 1.50% progressive. Table 3 and Figure 6 compare the results of two algorithms in a numerical and visual manner. As shown in Table 3, there is no significant different between two algorithms results but any how the results of Fuzzy Subtractive algorithm is better. Also, elapsed time for implementation of the two algorithms, FCM and Fuzzy Subtractive, is 3.36 and 2.22 seconds, respectively. Hence, from run-time point of view, the fuzzy Subtractive algorithmis executedfaster.
Fuzzy Subtractive algorithm has
better performance
than FCM The amount of reduction of energy
consumption
Fuzzy Subtractive FCM
Algorithm
-0.31 1.61
1.92 Total energy
consumption of network
+1.50% 92.18%
90.68% The amount
of reduction of energy consumption
Table 3. Comparison of the best performance of the FCM and Fuzzy Subtractive algorithms in decreasing the amount of
energy consumption of sensors
6. CONCLUSION
Traffic monitoring and management in urban intelligent transportation systems can be well carried out using vehicular sensor networks. In a vehicular sensor network, the vehicles can gather the urban traffic information and transmit them to the traffic management center. One of the most challenging problems in these networks is the amount of energy consumed by the vehicles. Taking the advantages of clustering algorithms in urban intelligent transportation systems leads to a significant decrease in the energy consumption. In this research, Fuzzy C-Means and Fuzzy Subtractive algorithms have been used to solve this problem. Results show that the energy consumption is significantly low in techniques using clustering algorithms. Moreover, the results of Fuzzy Subtractive algorithm is better than Fuzzy C-Means in comparison.
It is suggested, for the future works, that a comparison between the two algorithms for different datasets to be drawn. It is also suggested that the performances of these algorithms be
compared against other algorithms. Moreover, the optimization methods could be applied on the algorithms and their effect on the results could be explored.
REFERENCES
Abbasi, A.A. and Younis, M., 2007. A survey on clustering algorithms for wireless sensor networks. Computer communications, 30(14), pp.2826-2841.
Bali, R.S., Kumar, N. and Rodrigues, J.J., 2014. Clustering in vehicular ad hoc networks: taxonomy, challenges and solutions. Vehicular communications, 1(3), pp.134-152.
Bandyopadhyay, S. and Coyle, E.J., 2003, April. An energy efficient hierarchical clustering algorithm for wireless sensor networks. In INFOCOM 2003. Twenty-Second Annual Joint Conference of the IEEE Computer and Communications. IEEE Societies (Vol. 3, pp. 1713-1723). IEEE.
b: Fuzzy Subtractive Clustering a: FCM Clustering
Figure 6. The clustering obtained by applying the FCM and Fuzzy Subtractive algorithms, clusters are shown by different colors and the cluster-heads are shown by bolded points
Boyinbode, O., Le, H. and Takizawa, M., 2011. A survey on clustering algorithms for wireless sensor networks. International Journal of Space-Based and Situated Computing, 1(2-3), pp.130-136.
Chaung, K.S., Tzeng, H.L., Chen, S., Wu, J., Chen, T.J., 2006. Fuzzy c-means clustering with spatial information for image segmentation, Computerized Medical Imaging and Graphics, Vol. 30, Issue, 1. Pages 9-15.
Fadaei, M., Abdipour, M., Dindar Rostami, M., 2016. Choosing Proper Cluster Heads to Reduce Energy Consumption in Wireless Sensor Networks Using Gravitational Force Algorithm. International Academic Journal of Science and Engineering 3(6), pp. 24-33.
Hammouda, K. and Karray, F., 2000. A comparative study of data clustering techniques. Fakhreddine Karray University of Waterloo, Ontario, Canada.
Heinzelman, W.B., Chandrakasan, A.P. and Balakrishnan, H., 2002. An application-specific protocol architecture for wireless microsensor networks. IEEE Transactions on wireless communications, 1(4), pp.660-670.
Khan, J.M., Seth, A., 2014 “Performance comparison of FCM and K-means clustering technique”, Global Journal of Advanced Engineering Technologies and Sciences, 2, 26-29.
Karthikeyan, A., Sarkar, S., Gupte, A.M. and Srividhya, V., 2013. Selection of cluster head using fuzzy adaptive clustering for energy optimization in wireless sensor network. Journal of Theoretical & Applied Information Technology, 53(1).
Le Borgne, Y.A., Santini, S. and Bontempi, G., 2007. Adaptive model selection for time series prediction in wireless sensor networks. Signal Processing, 87(12), pp.3010-3020.
Lee, W.S., Ahn, T.W. and Song, C., 2016. A Study on Energy Efficiency for Cluster-based Routing Protocol. Journal of the Institute of Electronics and Information Engineers, 53(3), pp.163-169.
Miyamoto, S., Ichihashi, H. and Honda, K., 2008. BasicMethods for c-Means Clustering. In Algorithms for Fuzzy Clustering (pp. 9-42). Springer Berlin Heidelberg.
Pal, N.R. and Chakraborty, D., 2000. Mountain and subtractive clustering method: Improvements and generalizations. International Journal of Intelligent Systems, 15(4), pp. 329-341.
Park, G.Y., Kim, H., Jeong, H.W. and Youn, H.Y., 2013, March. A novel cluster head selection method based on K-means algorithm for energy efficient wireless sensor network. In Advanced Information Networking and Applications Workshops (WAINA), 2013 27th International Conference on (pp. 910-915). IEEE.
Seredynski, M. and Bouvry, P., 2011, October. A survey of vehicular-based cooperative traffic information systems. In 14th International IEEE Conference on Intelligent Transportation Systems (ITSC) (pp. 163-168). IEEE.
Vodopivec, S., Bešter, J. and Kos, A., 2012, July. A survey on
clustering algorithms for vehicular ad-hoc networks. In Telecommunications and Signal Processing (TSP), 2012 35th International Conference on (pp. 52-56). IEEE.
Zytoune, O., Fakhri, Y. and Aboutajdine, D., 2010. A novel energy aware clustering technique for routing in wireless sensor networks. Wireless Sensor Network, 2(3), p.233.