CHAPTER III
RESEARCH METHODOLOGY
In the previous chapter, the related studies supporting the study have been
briefly explained. For this chapter, the research methodology related to the study
will be explained. This chapter covers the research method, research hypothesis,
data collection, research procedure, scoring rubric and analysis which covers
students' writing task analysis on the pretest and data analysis in posttest (t-test).
3.1 Research Method
In order to get empirical data a Quasi - experimental design has chosen. As
Sugiyono (2010 : 107) said that quasi - experimental non-equivalent pre-test post
design is used when study wants to see the effect of a treatment where
experimental and control group are not choose randomly.
This study was aimed at investigating the effect of picture series in
teaching procedural text. Furthermore, decision to use this method is based on the
intention to get an in depth understanding by investigating the process that
occurred in this type of teaching and learning process.
Since the research design was a quasi experimental, there were two groups
taken as investigated groups in this study. The first group was the experimental
group, which was treated by using pictures series, while the second group was the
control group, which received a single picture. Then, the study used a quasi
experimental design which the pretest and posttest non equivalent-groups design
Table 3.1 Experimental Design
Group Pretest Treatment Posttest
Experimental T1E X T2E
Control T1C - T2C
Where
T1E : Students' writing scores of the experimental group on pretest
T1C : Students' writing scores of the control group on the pretest
X : The treatments using pictures series
T2E : Students' writing scores of the experimental group on posttest
T2C : Students' writing scores of the control group on the posttest
The table above shows that both of groups were given pretest and posttest,
but they will receive different treatments. Series of pictures as treatment was only
the control group. The purpose of study was to find out whether the students were
given treatment by pictures series could achieve a higher score than those
students were given a single picture.
There were two variables which were investigated in this Quasi
experimental research namely independent and a dependent variable. An
independent variable is the variable that will affected by independent variable
(coolidge, 2000: 15), Based on the explanation above pictures series will the
independent variable which is the major variable to be investigated. Since it is the
major variable, it is selected, manipulated, and measured by the researcher. On the
other hand, student's procedure text writing ability will be dependent variable (the
variable which is observed and measured to determine the effect of independent
variable.
3.2 Research Hypothesis
In conducting study, hypothesis is one of the important aspects because
hypothesis is defined as prediction or temporary answer of the research problems.
According to Hatch and Farhady (1982:85-86), hypothesis can be considered as
null hypothesis and alternative hypothesis. The null hypothesis states that there is
no significant difference between the posttest mean of control and experimental
group after the treatment. Then, the alternative hypothesis states that there is
significant difference between the posttest mean of control and experimental
group after the treatments. The formula stated below.
H0 : µ control = µ experiment
Ha : µ control ≠ µ experiment
3.3 Data Collection
As initial steps, the data collection of the study starts by having the
seventh graders of 45 junior high school Bandung an achievement test in form of
a pretest. The treatment endure by having English writing procedure lessons with
series picture which given in five sequences of five meetings. At the end of the
learning period, a post- test is given to find out the difference of achievement
scores between the pre-test and post test result. Questioner was also distributed to
investigate the students towards the use of picture in improving students writing
procedure text.
3.3.1 Population
Population is all members of a group about which you want to draw
conclusion (Levine and Stephen, 2005: 5). Based on definition, the population of
this study was the first grade students of Bandung 45 junior high school. The
first grade of 45 junior high school consisted of twelve classes in which the total
population was about 430.
The choice of population was based on the consideration that procedure
text is taught in first grade in junior high school, especially in the second
semester. Besides, the study was conducted in 45 junior high school. The places
was chosen because this school was the place where the researcher did PLP
program. PLP program is a program for students in Indonesia University of
3.3.2 Sample
The number of population was so large that it could not be accessed. In
this case, the study was conducted to a part of the whole population. According
the Coolidge (2000 : 24), sample is smaller group of scores selected from
population of scores. In selecting sample , There are two classes of seventh
graders will involve in this study , both of them consist of 35 students (VIIG) and
(VII H). The total numbers of participants were 70 students. Two classes which
had been chosen based on non- random sampling were labeled into experimental
(VII H) and control group (VIIG).
The reason why these two classes were chosen because some
considerations including the groups were chosen by teacher which PLP is done,
procedural text is taught in seventh grades of junior high school, the two groups
have the same number of students (35 students), The groups were chosen by
teacher's judgment which explain that both groups are homogenous, and sample
has not given any treatment of pictures series in writing procedural text.
3.3.3 Research Instrument
To obtain the data, an instrument was needed to be involved. According to
Fraenkel and Wallen (2007), instrumentation is as the whole process of collecting
data in a research. Then, this study employed an instrument to gain data to be
analyzed which was writing test. Writing test consisted of pretest and posttest
which were given in the form of written test. Pretest was administrated in both
group to describe the similarity in terms of writing ability of experiment and
control groups before conducting the treatments. Then, in the posttest, the test was
carried out to examine whether there was significant difference of students'
writing in the two groups' skill after one of the group was given the treatments.
The posttest was administrated to find out whether the use of pictures series in
teaching writing procedural text was effective or not.
Moreover, the score of students' writing test was used to know the use and
the extent of the pictures series in improving students' writing procedural text.
conducted to both experimental and control groups. To assess the students' writing
the researcher analyzed by using scoring sheet by rose (2007, as citied in Emilia,
2011) which is presented in appendix.
3.4 Research Procedures
The research was conducted for one month. The researcher arranged some
procedures to make the study well organized. The steps of conducting research
were as follow. First was a plan for doing pretest, posttest, and lesson plan.
Second trying out the instrument to test its validity and reliability. Third, giving
pretest to both experimental and control group. fourth, giving the sample
treatment, teaching them writing procedure text through pictures series for
experimental and single picture for control group. The last, giving posttest to both
groups whether both groups got different result or not.
3.4.1 Planning
Planning is one of important works in study because it can be a standard to
do in study. In order for study to run well, there were some procedures which
were applied in planning. First was preparing the instrument for the pretest and
posttest. The written test as instrument for the pretest which are "how to make a
cup of cofee", "How to fry an egg", "how to built a tent" and for the posttest "how
to make a cup of milk tea", "how to make a special fried rice", "how to make a
handmade greeting card" . The reason of choosing those topics because it not too
complicated for seventh grade students and it avoided noisy class after student's
finished their work.
Second, before conducting pretest and posttest, the instrument was tried to
the students' excluding the sample of study. After trying out the instrument, the
validity and reliability of instrument were calculated. Then, the result of
calculation would be a standard topic to make lesson plan. In order to make a well
established experiment, lesson plan was made. The activities in the lesson plan
was made based on the Genre - based Approach which includes building
construction of the text. For detailed explanation about genre based approach, it
can be seen in chapter 2. The example of lesson plan would be shown below and
this is simple lesson plan which is adapted from brown (2000). The following is
an example of lesson plan in example of lesson plan in experimental and control
group.
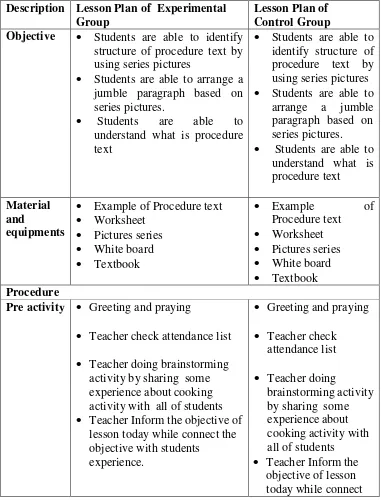
Table 3.2
Lesson Plan of Experimental and Control Group
Description Lesson Plan of Experimental Group
understand what is procedure text
Students are able to identify structure of procedure text by
Example of Procedure text
Worksheet
Pre activity Greeting and praying
Teacher check attendance list
Teacher doing brainstorming activity by sharing some experience about cooking activity with all of students
the objective with
Teacher shows a jumbled series of picture about how to make a cup of coffee, then teacher ask some students to put it in correct order with some help from other students.
Teacher asking some question
based from the pictures series. For example “Look at the picture! Can you guess what we need to make a cup of coffee?.”
Teachers write down students answer on the whiteboard
Teacher gives students example of procedure text that the picture has been shown before and students are asked to read again.
Teacher explains about the generic structure and imperative sentences of procedure text by using pictures series
Teachers show a
single picture a cup of coffee. Then teacher
JCT Teachers ask students to work
in groups of 6 persons and then teacher gives worksheet which contains different pictures series to each group. Students asked to do the assignment based on the worksheet with their group.
After students finished their works teachers invite a member of the group to represent what they have done.
Teacher and students
Teacher gives the assignment for the next meeting.
Evaluation Written test Written test
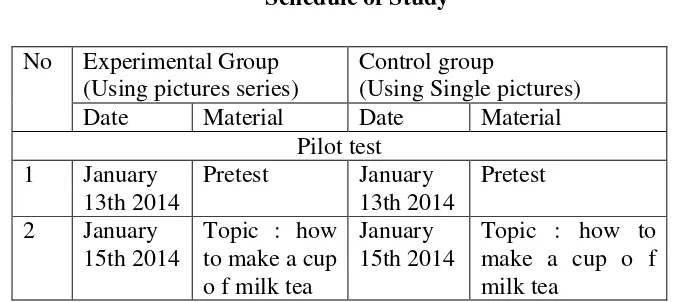
3.4.2 Administrating Pilot Test
Pilot test is a good item to measure validity and reliability of the
instrument before it was used in study. Before administrating pilot test to students,
the instrument was consulted to the supervisor and teachers of one of junior high
schools where the study was conducted to know the appropriateness of the
instrument with students' background knowledge. There were two kinds of
validity and reliability, pilot test was administrated to students excluding the
experimental and control group. It was also conducted on Wednesday, January
11th 2014.
3.4.3 Administrating Pretest
After calculating result of pilot test and finding validity and reliability of
the instrument, the pretest was conducted on January 13th 2014. It was
administrated to the experimental and control groups which each groups consist of
3.4.4 Conducting Treatment
After researcher got the result of pretest and found out that there was no
significant different score mean between experimental and control groups the
researcher gave the treatments to sample of study. The treatments were conducted
five meetings for each group in which meeting lasted for 2x40 minutes.
The first meeting was carried out on January 15th 2014 for both groups.
The first topic given was how to make a cup of milk tea. The main activity
focused on discussing what procedure text was. The teacher explained procedure
text as a text type and characteristics. The other activities were giving examples of
procedure texts and discussing them with the students. Some students raised
several question dealing with procedure text and its differences between
procedure text and descriptive.
The second meeting was conducted on January 16th 2014 for both groups.
The activity of second meeting focused on discussing present tense information
and imperative sentences. Many students made mistakes in using verb in the
sentences for instance, "I thirsty" instead of "I am thirsty".
The third meeting was carried out on January 22th 2014 for both groups.
The topic discussed was how to fried an egg. The main activity is focused on the
way to organize sentences into a good procedure text paragraph. The teacher also
explained temporal connectives and the plural noun as the main discussion of the
third meeting.
The fourth meeting was conducted on January 23th 2014 for both groups.
The theme discussed was how to built a tent. The main activity in this meeting
was discussing simple present tense and imperative sentences, discussing
incorrect sentences that students made, and correcting students' mistakes in
making sentences.
The fifth meeting was carried out on January 28th 2014 for both groups
this was the last meeting before the posttest was given in which the teacher
reviewed the whole four meetings before. The activity on this meeting was
dominated by the teacher to ask the students everything they had not clear yet
and the difficulties that the students faced after they were treated four meeting.
The teacher also gave more procedure text as a examples to be discussed again
lead them to reach a conclusion the procedure text.
Moreover, all cycle of writing process by harmer (2005) including
preparation, drafting, and editing appear in each meeting of teaching and learning
process. Limitation of time and approval of study is the reasons why all cycle of
writing is integrated in each meeting. For example, the teacher prepared students
to make draft by giving vocabulary and making sentences. After that the students
make a text based on the sentences based on the sentences that they have written.
Finally the teacher and students discussed it to know the mistakes. Besides, the
only difference between two groups was media given to students. The treatment
using pictures series as medium was given in the experimental group, while a
single picture was given to control group. Moreover, the researcher employed
four stages in teaching as proposed in GBA the researcher discussed in chapter 2.
The steps were building of knowledge, modeling of text, joint construction of
text, and independent construction text.
3.4.5 Administrating Posttest
Posttest was conducted after whole treatments had been given to both
groups. It was conducted on January 29th 2014 for experimental and control
groups where each groups consisted of 35 students. The text in posttest was same
3 January
analyzed by scoring sheet because test were in form of written test document. The
criteria of scoring sheet in this study were developed by Rose (2007, as cited by
Emilia, 2011, p.151) to measure the results of pretest and posttest. The adapted
scoring sheet consist of five aspects ; those were genre, register, discourse,
grammar and graphic features. for further detail, it can be seen in appendix.
3.6 Data Analysis
The data collected by the means of the test instrument was analyzed based
on specific purposes. In this case, there were three kinds of analyses was carried
out. First is instrument analysis. It was used to know the validity and reliability of
the instrument. Second, pretest and posttest analysis which was used to measure
the normality distribution, homogeneity of variance and t-test. Third, index gain
which was used to know the improvement of the experimental group. From the
detailed explanation it can be seen below.
3.6.1 Test Instrument Analysis
The data obtained in pilot test were analyzed to investigate face validity
and content validity. In the pilot test, the instruction contained in the pretest and
posttest items was found to be understandable and clear enough. Therefore, it was
proven that the test items had face validity. After the pilot test, the students' works
were examined to check whether or not the content validity had been possessed.
3.6.1.2 Reliability
Furthermore, it is also important to investigate the reliability of the test
instrument. Hatch and Farhady (1982:224) define reliability as the extent to which
a test procedures consistent result when administrated under similar condition. A
test can be accepted as reliable test if it can be a consistent test to obtain scores.
Finally, Cronbach's Alpha formula in SPSS 16.0 for windows program is used to
compute reliability of instruments. The criteria for the reliability test can be seen
in the following table
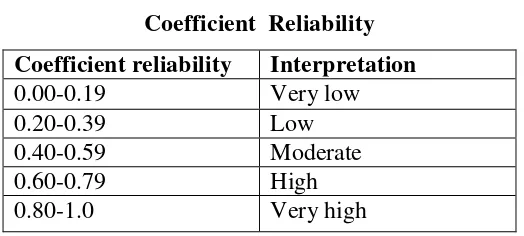
Table 3.4
Coefficient Reliability
Coefficient reliability Interpretation
0.00-0.19 Very low
0.20-0.39 Low
0.40-0.59 Moderate
0.60-0.79 High
0.80-1.0 Very high
(Arikunto, 2006:276)
3.6.2 Pretest and Posttest Data Analysis
After the pretest on both group were held, the next was analyzing the
output data. According to Fraenken and Wallen (2007), the output data were
analyzed using independent t-test to determine whether there was a significant
difference between the means of two independent samples. Before performing in
t-test, the output data of pretest should fulfill the criteria underlying t-test as stated
in Coolidge (2000) as follows.
1. The data should have a normal distribution.
3. The participant must be different in each group
For the reason, normality distribution test, variance homogeneity test, and
independent t-test were performed before calculating the data by using t-test
formula. Moreover, if the data do not fulfill the criteria above. the data is not
normal distribution. So, the Mann-Whitney test will be operated to test the
hypothesis.
3.6.2.1 Normality Distribution Test
One-sample-Kolmogorov-Sminov test in SPPS version 16.0 used to
analyze the normally distributed. In this case, the result of the normality
distribution was also used to find out whether or not the hypothesis that had been
determined was accepted.
The first step in calculating the normality distribution test stated that
hypothesis :
H0 : the scores of the experimental and the control groups are normally
distributed.
H1 : the scores of the experimental and the control groups are not
normally distributed.
The second step in calculating the normality distribution test is to determine the significance level in the level α=0.05. The level significance criterion for normality distribution states that if the probability > 0.05, H0 is
accepted. Whereas if the probability < 0.05, H0 is rejected (Hatch & Farhady,
1982:88). As a result, if the probability is more than the level of significance
(0.05), the null hypothesis is accepted and the score are normally distributed.
3.6.2.2 Variance Homogeneity Test
After knowing that the pretest and posttest were normally distributed, the
next step was to analyze its homogeneity. To examine whether the data are
homogenous or not, test of homogeneity of variance using Levence's test for
equality of variance in SPSS version 16.0 was used.
The first step is calculating the variance homogeneity test stated that
H0: the scores of both experimental and control group are homogenous.
H1: the scores of both experimental and control group are not
homogenous.
The second step is to determine the significance level in the level α=0.05. The level of significance criterion for homogeneity test states that if the
probability > 0.05, then H0 is accepted. Whereas if the probability < 0.05, H0 is
rejected (Hatch & Farhady, 1982:88).
Moreover, if the data do not have normal distribution, the Mann-Whitney
test be operated to test the hypothesis. The writer also used SPSS 16.0 to calculate
the result.
3.6.2.3 T-test Computation
3.6.2.3.1 Independent t-test
Independent t-test is used to analyze a causative relationship between the
variable (treatment) and the dependent variable that measure on both groups
(Coolidge, 2000).
Therefore, after the data had been proven as a normal distribution, the data
were calculated using independent t-test. The independent t-test was analyzed
using SPSS version 16.0 for windows. According to Kranzler & Moursound
(1994 : 94), the level of significance used in independent t-test is 0.05. The
criterion stated to determine t-test is if tobt is lower than tcrit, h0 is accepted and
there is no significance difference between both of groups in the pretest mean.
Whereas, if tobt is higher than tcrit, the result is statistically significant difference in
the pretest means of two group and h0 is rejected.
3.6.2.3.2 Dependent t-test
Dependent t-test was calculated certify that there is significance difference
between the pretest and posttest scores in each groups. According to Coolidge
means in experimental design where in both groups are related to each other in
some way.
In this study, the dependent sample test was analyzed using computation
with SPSS 16.0 for windows by comparing the significance value with the level of
significance to the test hypothesis. If the significance value is more than or equal
to the level of significance (0.05), the null hypothesis is accepted and it will be
concluded that there is no significant differences between the two means. On the
other hand, if the significance value is less than the level of significance (0.05),
the null hypothesis is rejected and it will be concluded that the mean is
significantly different from the other mean.
3.6.2.4 The Calculation of Effect Size
The effect size refers to the effect of independence variable upon the
dependent variable (Coolidge, 2000:151). The calculation of effect size was
conducted to measure how well the treatment worked. For instance, if the
difference between two groups' means is large, there is said to be a large effect
size; if the difference between two groups' mean is small, there is said to be small
effect size.
In order to determine the effect size in the independent t-test, a correlation
coefficient of effect size can be derived as follows:
r = √ 2+2
Where:
r = effect size
t = � or � � from the calculation of independent t-test (post-test score) df = degree of freedom
To interpret the computational result, the following scale was use as
guidance in determining the effect size on dependent variable.
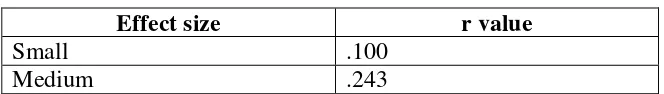
Table 3.5
The Effect Size Scale
Effect size r value
Small .100
Large .371
(Coolidge, 2000)
3.6.2.5 The Calculation of Index Gain
Index gain was calculated to answer the second research question in this
study as to what extent picture series improves students' writing abilities in the
experimental group. It is also used to investigate the improvement of students'
writing score between pretest and posttest. In addition, the gain of each aspect of
writing skills were calculated with the formula below:
= −
����� � −
(Hake, 1999)
Then, the index gain was interpreted by using the following criteria:
(Hake, 1999)
Having calculated index gain, there were two examples of students' hand
writing from experimental and control group. In this part, analysis of texts was
conducted to answer the second research question. The analysis of texts was based
on scoring technique by rose (2007, citied in Emilia, 2011). There were some
aspects of scoring in this text analysis which are genre, register, and discourse,
grammar aspect. By using those aspects, student's hand writing texts were
analyzed whether those text contained all aspects in scoring technique of writing. Index gain <0.3 = low-gain.
0.7 > Index gain > 0.3 = medium-gain.