ANALGESIC EFFECTIVENESS TOWARD
PATIENTS WITH CERVICAL CANCER IN X HOSPITAL SAMARINDA
Adji Prayitno Setiadi1, Hernanda Saputri2
1Centre for Medicines Information and Pharmaceutical Care (CMIPC), Faculty of Pharmacy, Universitas Surabaya, Indonesia
2 Faculty of Pharmacy, Universitas Surabaya, Indonesia
Background:
Cervical cancer is one of the women’s health problems in Indonesia, with 41 new cases and deaths found every day, and with an estimation of 40,000 new cases found every year (Rasjidi, 2007) and belongs to the second highest level in East Kalimantan. WHO states that two of three people with cancer will die because of their illness and along the way, 45.0-100.0% of them would experience light until severe pain intensity. The use of analgesic in overcoming pain intensity of cancer is the most important thing in the therapy of cervical cancer patients. The research aims to analyse the appropriateness of analgesic selection and effectiveness toward patients of cervical cancer undergoing inpatient care facility in X Hospital Samarinda.
Methods:
The data collection is conducted through using the retrospective method from the
patients’ medical records from January 2011 until December 2014 which will be descriptively analysed. The accuracy of analgesic selection is compared with WHO’s 3 stage analgesic ladders. The degree of the pain is measured with the method of Verbal Rating Scale (VRS) and analgesic effectiveness is measured through the reduction degree of pain with the Visual Analogue Scale (VAS).
Results:
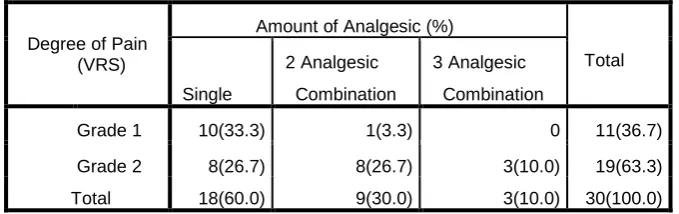
Among 47 data of medical records, there are 30 patients who received analgesic therapy. 36.7% experienced Pain Intensity grade I and the rest were grade II, 60% of patients received single analgesic therapy and the rest were combination (Table 1). 71.2% received NSAID (single and combination) while the rest Opioid (Tabel 2).
Table 1 Degree of Pain (VRS) vs Type of Analgesic
Degree of Pain (VRS)
Amount of Analgesic (%)
Total
Single
2 Analgesic
Combination
3 Analgesic
Combination
Grade 1 10(33.3) 1(3.3) 0 11(36.7)
Grade 2 8(26.7) 8(26.7) 3(10.0) 19(63.3)
Table 2 Degree of Pain (VRS) vs Analgesic Category
Degree of Pain (VRS)
Analgesic Category (%)
Total NSAID Opioid NSAID + Opioid
Grade 1 10 (33.3) 0 1 (3.3) 11 36.7)
Grade 2
8 (26.7)
6 (20.0) 5 (16.7) 19 (63.3)
Total 18 (60.0) 6 (20.0) 6 (20.0) 30 (100.0)
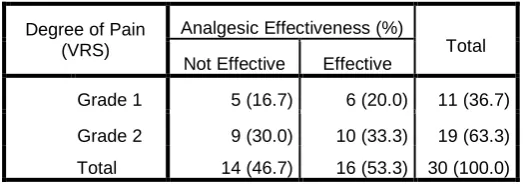
The analgesic appropriateness was 23.3% (Table 3) and the effectiveness was 53.3% of complete remission (Table 4).
Table 3 Degree of Pain (VRS) vs Analgesic Appropriateness
Degree of Pain (VRS)
Analgesic Appropriateness (%)
Total Not Appropriate Appropriate
Grade 1 4 (13,3) 7 (23.3) 11 (36.7)
Grade 2 19 (63.3) 0 19 (63.3)
Total 23 (76.7) 7 (23.3) 30 (100.0)
Table 4 Degree of Pain (VRS) vs Analgesic Effectiveness
Degree of Pain (VRS)
Analgesic Effectiveness (%)
Total Not Effective Effective
Grade 1 5 (16.7) 6 (20.0) 11 (36.7)
Grade 2 9 (30.0) 10 (33.3) 19 (63.3)
Total 14 (46.7) 16 (53.3) 30 (100.0)
Conclusions: