Gains and structural effects of exploiting scale-economies in
Norwegian dairy production
Knut Løyland
∗, Vidar Ringstad
Telemark Research Institute, N-3800 Bøi Telemark, Norway
Received 21 May 1999; received in revised form 10 January 2000; accepted 22 February 2000
Abstract
In this paper, we present calculations of the economic gains in terms of reduced costs by exploiting scale-economies in dairy production in Norway, and the effect this would have had on the number of farms. We also explore whether or not optimal scale and unexploited scale-economies change over time due to scale-augmenting technical change.
The analysis is based on homothetic cost functions estimated by means of data for individual dairy farms for the period 1972–1996. For 1972, we find that, by full exploitation of scale-economies, the costs could have been reduced by almost 40%, while the number of farms would have been reduced by more than 85%. The number of small farms has been substantially reduced in the period considered. This fact, combined with small scale-augmenting technical change, implies that the gains and structural effects of exploiting scale-economies have decreased over time. In 1996, costs could have been reduced by close to 30% by full exploitation of scale-economies, while the number of farms would have been reduced by slightly more than 70%. Thus, both gains and structural effects are substantially less than in 1972. Nevertheless, the calculated gains for 1996 make almost 5 billion NOK. This corresponds almost exactly to the total public support to the dairy farms in 1996.
The unexploited scale-economies are largely due to the agricultural policy. Thus, a substantial share of the same can be considered as part of the ‘price’ the Norwegian society has to pay for this policy. In addition, there are likely to be large hidden costs of this policy due in particular to the quota system and other direct production regulations. They imply that technical innovations and other efficiency-improving investments requiring increased production to be profitable are not carried out. This is the more likely explanation for the extremely poor efficiency development in Norwegian dairy production in the period studied. © 2001 Elsevier Science B.V. All rights reserved.
JEL classification:L11; O33; Q12
Keywords:Dairy production; Economies of scale; Cost functions; Technical change
1. Introduction
Previous studies suggest that there are substantial economies of scale in Norwegian dairy production (Aarseth and Elstrand, 1991; Hatling and Lynum,
∗Corresponding author. Tel.:+47-35-06-15-10;
fax:+47-35-06-15-01.
E-mail address:[email protected] (K. Løyland).
1993; Giæver et al., 1995; Flaten and Giæver, 1998). An explanation for these findings is likely to be the Norwegian agricultural policy, which has a compre-hensive system of economic support and regulations.
This policy allows profitable production even for very small units in spite of disadvantages of a small scale of operation. Thus, the owners have an economic incentive to use the land themselves in-stead of renting it out to others. Moreover, the legal
framework for renting of land is poorly developed. The system for trade of land is quite restrictive, and since 1983, there has been a system of production quotas that regulates the volume of production of each dairy farm. Until 1997, i.e. after the period con-sidered by us, the quotas were non-tradable. Thus, there are legal and institutional restrictions on the exploitation of scale-economies in Norwegian dairy production.
As suggested by studies from countries with widely different topography and agricultural policy, there are also more general explanations for unexploited scale-economies in dairy production, cf. for instance Matulich (1978), Mochini (1988, 1990), and Bailey et al. (1997) for the US, and Dawson and Hub-bart (1987), Mukhtar and Dawson (1990), Burton et al. (1993) and Hubbard (1993) for Great Britain. Analyses of scale-economies of other industries also suggest that a large majority of the firms for some rea-son are of sub-optimal size (Christensen and Greene (1976) for US electricity production, Ringstad (1974, 1979) for Norwegian manufacturing and Ringstad and Løyland (1998) for Norwegian day care centers). Christensen and Greene (1976) and Ringstad and Løyland (1999) strongly suggest that technical change tends to increase scale-economies over time, i.e. that there is scale-augmenting technical change; cf. also Levin (1977) and Kerkvliet et al. (1998). As far as we know, no study has been carried out on this issue for Norwegian dairy production. One piece of evidence, however, which suggests scale-augmenting technical change in this branch of agriculture, is the fact that more recent studies like those of Hatling and Lynum (1993) and Giæver et al. (1995) provide larger esti-mates on the degree of economies of scale than older ones like that of Ringstad (1967). Corresponding ev-idence for the US is found by comparing the results of the studies referred to above with those of older studies, surveyed by Hallam (1993).
The following issues will be explored in this paper:
• Do economies of scale exist in Norwegian dairy
production, and if so,
• is there an optimal scale of operation?
• Does optimal scale change over time, i.e. is there
scale-augmenting technical change?
• What are the potential economic gains, and the
ef-fects on the number of farms of exploiting any scale-economies?
These issues will be explored by means of cost func-tions. The first issue could be analyzed by assuming a Cobb–Douglas specification of the underlying produc-tion funcproduc-tion. This specificaproduc-tion makes it difficult to estimate the gains and structural effects of exploiting scale-economies, however, since it implies a constant scale-elasticity. If this elasticity is below unity, there are diseconomies of scale, while there are infinite scale-economies if the scale-elasticity is above unity. Instead, we use production function specifications which allow for positive but limited economies of scale. Homothetic functions with a scale-elasticity decreasing with production from values above unity to values below unity have this property. They im-ply a cost-optimal scale of operation where the scale-elasticity is exactly unity since this corresponds to the minimum of the average cost function.
The gains of exploiting the scale-economies of a farm of sub-optimal size can be calculated as the dif-ference between the estimated costs of this farm and what it costs to produce the same amount by a farm of optimal size. By ‘transferring’ the production of all sub-optimal farms to optimal ones in this way, we obtain estimates of the total gains of exploiting the scale-economies of dairy production in Norway, and the effects this would have had on the number of farms (Ringstad, 1979; Ringstad and Løyland, 1999).
In Section 2, we present some main elements of the public support system for Norwegian dairy produc-tion. The details of the theoretical framework for the exploration of the main issues are discussed in Sec-tion 3, while the data and the variable definiSec-tions used are presented in Section 4. In Section 5, we discuss the estimated cost functions results, and in Section 6, we present some calculations of the economic gains and the effects on the number of farms of exploiting scale-economies. Section 7 includes a discussion of potential sources of errors and Section 8 contains a brief summary of the main findings of this study.
2. Main elements of the support system of Norwegian dairy production
There are three basic objectives of the Norwegian agricultural policy:1
1. Food security.
2. Prevention of depopulation in remote areas. 3. Environmental aspects: preservation of agricultural
landscape and reduced risk related to the diffusion of human and livestock diseases.
The means used to obtain these objectives consist of a comprehensive system of support, regulation and protection of agricultural production. Related systems are used in most other developed coun-tries, but the total support for Norwegian agriculture is much larger than for most of them. In 1995, it made up about 74% of the total value of produc-tion as compared to 41% for the OECD average (OECD, 1996).
The support of dairy production mainly derives from producer price support, acreage subsidies,
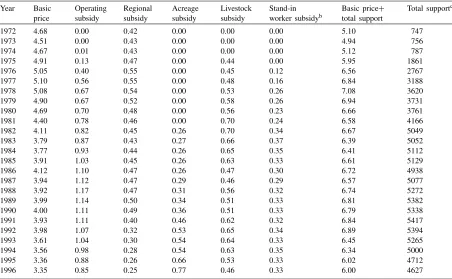
Table 1
The support system of Norwegian dairy production (in 1996-prices)a
Year Basic price
Operating subsidy
Regional subsidy
Acreage subsidy
Livestock subsidy
Stand-in
worker subsidyb Basic pricetotal support+ Total support c
1972 4.68 0.00 0.42 0.00 0.00 0.00 5.10 747
1973 4.51 0.00 0.43 0.00 0.00 0.00 4.94 756
1974 4.67 0.01 0.43 0.00 0.00 0.00 5.12 787
1975 4.91 0.13 0.47 0.00 0.44 0.00 5.95 1861
1976 5.05 0.40 0.55 0.00 0.45 0.12 6.56 2767
1977 5.10 0.56 0.55 0.00 0.48 0.16 6.84 3188
1978 5.08 0.67 0.54 0.00 0.53 0.26 7.08 3620
1979 4.90 0.67 0.52 0.00 0.58 0.26 6.94 3731
1980 4.69 0.70 0.48 0.00 0.56 0.23 6.66 3761
1981 4.40 0.78 0.46 0.00 0.70 0.24 6.58 4166
1982 4.11 0.82 0.45 0.26 0.70 0.34 6.67 5049
1983 3.79 0.87 0.43 0.27 0.66 0.37 6.39 5052
1984 3.77 0.93 0.44 0.26 0.65 0.35 6.41 5112
1985 3.91 1.03 0.45 0.26 0.63 0.33 6.61 5129
1986 4.12 1.10 0.47 0.26 0.47 0.30 6.72 4938
1987 3.94 1.12 0.47 0.29 0.46 0.29 6.57 5077
1988 3.92 1.17 0.47 0.31 0.56 0.32 6.74 5272
1989 3.99 1.14 0.50 0.34 0.51 0.33 6.81 5382
1990 4.00 1.11 0.49 0.36 0.51 0.33 6.79 5338
1991 3.93 1.11 0.40 0.46 0.62 0.32 6.84 5417
1992 3.98 1.07 0.32 0.53 0.65 0.34 6.89 5394
1993 3.61 1.04 0.30 0.54 0.64 0.33 6.45 5265
1994 3.56 0.98 0.28 0.54 0.63 0.35 6.34 5000
1995 3.36 0.88 0.26 0.66 0.53 0.33 6.02 4712
1996 3.35 0.85 0.25 0.77 0.46 0.33 6.00 4627
aSource: Norwegian Agricultural Economics Research Institute (NAERI) and Statistics Norway. Basic price and the various subsidies
are in NOK per kilo. Total support in the final column is in million NOK.
bSupport to cover the costs of labor hired during vacations etc. for the farmers.
cDoes not include the monopoly- or the ordinary production subsidies elements of basic price. In 1996, the ordinary production
subsidies were about 350 million NOK.
livestock subsidies, and support to cover the costs of stand-in workers during vacations etc. The producer price support consists of four elements: a monopoly price element, obtained by means of a legal dairy monopoly owned by the farmers, an ordinary produc-tion subsidy, an operating subsidy to producproduc-tion of up to 30 tonnes, and a production subsidy differen-tiated by region. ‘Basic price’ in Table 1 is the sum of the monopoly price and the ordinary production subsidy. The regional subsidy is differentiated be-tween 11 different regions. It also includes transport subsidies.
production above the quota is much lower, and there are no operating or regional subsidies.2
The various types of support to total dairy produc-tion in Norway in the period covered by our anal-ysis are presented in Table 1. Note that the various subsidies per kilo, and thus, also the sum of basic price and total support, are averages, and vary widely be-tween farms, in particular, by size and region. Acreage subsidies, livestock subsidies and stand-in worker subsidies are for agricultural production in general. Those for dairy production have been estimated, using the share of dairy products (with jointly pro-duced beef) in total agricultural production value as weight for the former, and its share of total livestock production for the other two.
Due to incomplete information, the ordinary production subsidies are not included in total support. In 1996, they made about 350 million NOK, which implies a total support to the dairy farms this year of almost 5 billion NOK.
There are some other types of support as well, such as investment subsidies, and publicly financed crop insurance arrangements. These subsidies are of minor importance, as compared to those included in Table 1.
3. The theoretical framework
3.1. The specification of scale-properties of the production function
Our theoretical point of departure is a single output production function:
Y =f (X) (1)
whereYis output andXa vector of inputs.
The scale-elasticity is defined as
ε(X)=X
i.e. the percentage change inYby a 1% increase in all
inputs.
2In 1983–1984, the above-quota price was 1 NOK per liter
(=0.97 NOK per kilo), in 1985–1987, 0.6 NOK per liter, in
1988–1991, 0.3 NOK per liter and in 1992–1996, 0.15 NOK per liter, all in nominal prices. Taking the increased price level in this period into account, there has obviously been a steep decrease in the above-quota price since this system was introduced.
Homothetic production functions are characterized by a scale-elasticity depending on production only, and not on the input-mix, with a constant elasticity as a special case.3 A sub-class of homothetic
pro-duction functions has a scale-elasticity decreasing monotonically with production, from values above unity to values below unity, which implies a U-shaped average cost function with a minimum where the scale-elasticity is exactly unity.
Focusing on scale-properties, as we do in this study, homothetic production functions offer attractive speci-fications. In contrast to more flexible functional forms, like translog-functions, fewer parameters have to be estimated, and they offer unique estimates of optimal scale as the level of production where the average cost function has its minimum. In this way, we are likely to obtain about the same results as we would have done by estimating a fully specified translog-function and calculating the average cost function and optimal scale for the sample means of the factor-prices.
In this study, we will use two homothetic produc-tion funcproduc-tion specificaproduc-tions of this kind, introduced by Nerlove (1963) and Zellner and Revankar (1969), respectively, both of which have the Cobb–Douglas production function as a special case.4 We also use
a combined version, introduced by Ringstad (1974), that makes it possible to test whether or not one specification is better than the other one. Moreover, the two specifications selected allow us to test if the average cost function actually is U-shaped, with a Cobb–Douglas specification as the null-hypothesis.
The cost function corresponding to a Cobb–Douglas specification is (in logarithms, and ignoring the inter-cept term)
lnC=αlnY +ϕ′Z, (3)
whereC stands for costs and Z is a vector of other
variables like factor-prices and characteristics of the production activities. Production is assumed to be exogenously given, which is quite reasonable since the production of each farm has been regulated by quotas during most of the period studied.
3 Cf. Førsund (1975) for a survey of homothetic production
functions.
4 The analysis could easily be made slightly more general by
In this case, the scale-elasticity is
ε= 1
α. (4)
The cost function corresponding to the Nerlove spec-ification is
lnC =αlnY +β(lnY )2+ϕ′Z, (5)
with the scale-elasticity
ε(Y )= 1
α+2βlnY. (6)
Correspondingly, the Zellner–Revankar specification implies the cost function
lnC =αlnY +γ Y +ϕ′Z, (7)
with the scale-elasticity
ε(Y )= 1
α+γ Y. (8)
By combining the two specifications, we get
lnC =αlnY +β(lnY )2+γ Y +ϕ′Z, (9)
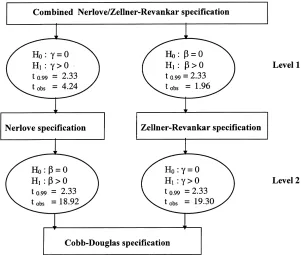
Fig. 1. Test of the form of the production function for dairy production.
which implies
ε(Y )= 1
α+2βlnY +γ Y. (10)
All cost functions are estimated by means of ordinary least squares. By assuming normally and indepen-dently distributed error terms, the specification of scale-properties could be tested by a two-level test procedure; cf. Fig. 1. At Level 1, both the Nerlove specification (γ=0) and the Zellner–Revankar
spec-ification (β=0) serve as null-hypotheses with the
combined specification in (9) as the alternative hy-pothesis in both tests. If both null-hypotheses are rejected, our results suggest that they are both too simple to represent the scale-properties properly. If one null-hypothesis is rejected, but not the other, our results suggest that the non-rejected hypothesis could be a proper specification. In this case, the win-ning specification could be tested at Level 2 with the Cobb–Douglas specification (β=γ=0) as the
3.2. The specification of technical change
The main focus concerning technical change is on its possible interaction with economies of scale, in particular, optimal scale of operation. To explore this issue, we introduce a trend and an interaction term between trend and production in the cost function. Thus, in the more general case in (9), we have
lnC =αlnY +β(lnY )2+γ Y +ηt
+µtlnY+ϕ′Z, (11)
wheretis measured in years.
The trend-modified version of (10) becomes
ε(Y, t )= 1
α+2βlnY +γ Y+µt. (12)
Scale-augmenting technical change as suggested by Christensen and Greene (1976), Levin (1977), Kerkvliet et al. (1998) and Ringstad and Løyland (1999) implies thatµ<0, which is easily tested by an
ordinaryt-test. We note that the constraintsβ=γ=0,
γ=0, and β=0 in the expression in (12) provide
‘technical change-extended’ versions of (4), (6), and (8), respectively.
3.3. Calculation of gains and structural effects of exploiting scale-economies
Since optimal scale impliesε(Y)=1, we obtain
op-timal scale from the Nerlove specification (ignoring technical change) as
For the Zellner–Revankar specification, we obtain cor-respondingly
YZopt–R=1−α
γ (14)
while we cannot get any explicit solution for opti-mal scale from the combined specification. It could be found in various other ways, however, for instance by numerical calculation from
α+2βlnY +γ Y =1. (15)
Ifµ6=0, we can calculate optimal scale for yeart by
substitutingα+µtforα. Thus, for the Nerlove
speci-and correspondingly for the Zellner–Revankar speci-and the combined Nerlove/Zellner–Revankar specification.
Using the same method as in Ringstad (1979), and Ringstad and Løyland (1999), we obtain an estimate of the gains of exploiting scale-economies in dairy production by substituting farms with optimal size for the sub-optimal ones for the same total quantity of milk produced. Thus, we first calculate the number of farms of optimal size needed to produce the same amount of milk as the sub-optimal farms in yeart, i.e.
noptt =
We then obtain an estimate on the relative gain of ex-ploiting scale-economies for Norwegian dairy produc-tion in yeartas
There is an argument for a corresponding ‘transforma-tion’ of the suoptimal units, but we have not per-formed it. Anyway, it turns out to make very little difference in our case due in part to few farms of super-optimal size, and partly due to small differences in unit costs between optimal and super-optimal farms.
4. Data and variable definitions
4.1. The data
part in the survey during the whole period. In addition, we use price data published by Statistics Norway for four types of inputs, specified later.
The total sample consists of about 25 000 observa-tions. Our analyses are limited to farms with milk as the main product. They also have some beef produc-tion, but mostly as a joint product to milk. Thus, our sample is smaller — an unbalanced panel data set of 11 069 observations.5
To calculate the gains and structural effects of ex-ploiting scale-economies, we also use information about the farms of an ‘estimated’ population of dairy farms corresponding roughly to the sample. Thus, our population does not include all milk producers. Information for 1994 suggests that close to 90% are, however, included.
The population data provide information about acreage and number of cows, but no information about production. Thus, production is calculated ad hoc by means of a ‘production function’ estimated by ordinary least squares on the sample data, where pro-duction dataare available. This function is specified
as follows:
lnY =θ+ϕ1ln AC+ϕ2ln CO
+ϕ3t+ω1[ln AC]2+ω2[ln CO]2+ω3t2
+ω4[ln AC][ln CO]+ω5[ln AC]t
+ω6[ln CO]t+u, (19)
where AC is acreage (in hectares), CO the number of cows andta trend, t =0,1, . . . ,24 for the years
1972–1996.
We have data for each year in the period 1972–1996, except 1979, 1989 and 1991. The annual populations are obtained by means of annual surveys carried out by Statistics Norway. For the years 1972–1978, the surveys covered 10% of the farms with 0.5–9.99 ha (1 ha=10 000 m2=2.47 acres), 20% of those between
10 and 49.99 ha, and all of those with 50 ha or more. The population is estimated by letting each farm in the survey sample with 0.5–9.99 ha represent 10 farms, and each of the farms of the middle-sized group rep-resent five farms. By adding the biggest units, we ob-tain an ‘estimated’ population of dairy farms for each year in this period. After 1979, the surveys consist of
5On the average, the share of milk in total production value is
about 76%. Almost all of the rest is joint product-beef.
10% of the farms with 0.5–9.99 ha, 20% of those with 10–19.99 ha, 33% of those with 20–49.99 ha and all of those with 50 ha or more, and the annual populations are ‘estimated’ correspondingly.6
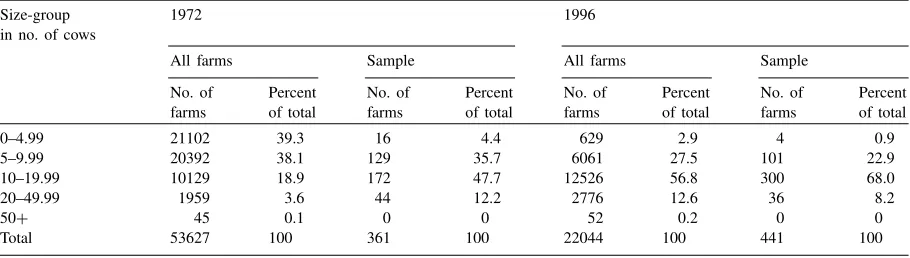
In Table 2, we present the size-distribution of the farms in the population and the ARAF-sample for 1972 and 1996. In Table 3, a corresponding size-distribution by the number of cows is presented.7
We note that the size-distribution has changed sub-stantially, with less of small farms and many more large ones in 1996. In 1972, almost 75% had less than 10 ha, while about 5% had 20 ha or more. In 1996, about 20% had less than 10 ha and almost 28% had 20 ha or more. Table 3 shows a corresponding picture. The sample we use is quite small as compared to the population. Note, however, that we use the data for all years in the cost-function estimation. Since the population is decreasing over time while the sample is increasing slightly, the sample-share of the population increases from less than 0.7% in 1972 to about 2% in 1996.
We also note that small farms are heavily under-represented in our sample in 1972, while the biggest farms are correspondingly over-represented. Due to the substantial reduction in the number of small farms in the population, the size-distribution of our sample corresponds fairly well to the population in 1996. There are a few other problems of represen-tativeness when using this sample for our purpose. We return to these issues when presenting the results obtained.
4.2. Variable definitions
The production variable,Y, is an aggregate of milk
and beef. Both components are measured in kilo units. Milk consists mainly of milk for sale. Thus, own use of milk is not included since it is mostly used as input in beef production which is measured as the weight added to the livestock during the year minus the weight of any lost livestock. It is calculated in milk
6 Some small corrections are made in this ‘estimation’ due,
among other things, to differences in the response percentages for the various size-groups.
7 The number of cows is actually what we, analogous to
Table 2
Size-distribution, by acreage, of dairy farms in Norway
Size-group (ha) 1972 1996
All farms Sample All farms Sample
No. of
5–9.99 21885 40.8 122 33.8 4006 18.2 43 9.8
10–19.99 10809 20.2 189 52.4 11459 52.0 249 56.4
20–49.99 2594 4.8 39 10.8 5927 26.9 146 33.1
50+ 156 0.3 0 0 184 0.8 1 0.2
Total 53627 100 361 100 22044 100 441 100
equivalents by multiplying the beef production by the average relative meat/milk-price for each year. Thus, our production measure is milk production in kilo units plus beef production in milk equivalents.
Variable costs (CV) consist of the costs of four
cat-egories of inputs: 1. Labor input. 2. Fertilizers and lime. 3. Concentrated feed.
4. Other inputs, mainly seeds, veterinary costs and medicines.
The main part of labor input consists of the work of owners and family members. The corresponding labor costs are calculated as the average wage rate (with social costs included) for hired labor in forestry and agriculture, multiplied by the number of hours worked by owners and family members according to the NAERI data. Adding these costs to the costs of hired labor (with social costs included), we get total labor costs.
Table 3
Size-distribution, by number of cows, of dairy farms in Norway Size-group
in no. of cows
1972 1996
All farms Sample All farms Sample
No. of
5–9.99 20392 38.1 129 35.7 6061 27.5 101 22.9
10–19.99 10129 18.9 172 47.7 12526 56.8 300 68.0
20–49.99 1959 3.6 44 12.2 2776 12.6 36 8.2
50+ 45 0.1 0 0 52 0.2 0 0
Total 53627 100 361 100 22044 100 441 100
Total costs (CT) consist of variable costs plus capital
costs, where capital costs are the sum of interest costs on the total capital stock, depreciation costs, mainte-nance costs, and costs of hiring machines and land. For maintenance and hiring costs, we have detailed and reliable information. In the ARAF sample, deprecia-tion costs are calculated as a percentage of historical costs, with a different percentage for different capital assets. At one extreme, we have land, where it is 0, and on the other, we have machines with 10%, i.e. a linear depreciation over 10 years.
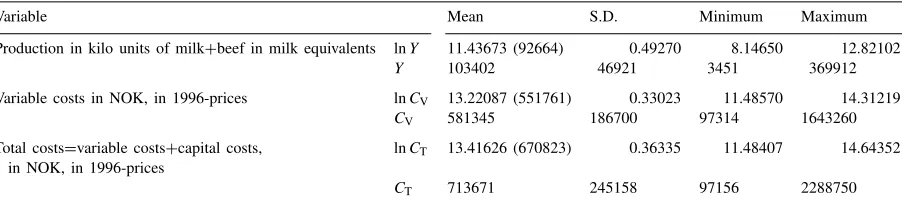
Table 4
Sample statistics for the main variablesa
Variable Mean S.D. Minimum Maximum
Production in kilo units of milk+beef in milk equivalents lnY 11.43673 (92664) 0.49270 8.14650 12.82102
Y 103402 46921 3451 369912
Variable costs in NOK, in 1996-prices lnCV 13.22087 (551761) 0.33023 11.48570 14.31219
CV 581345 186700 97314 1643260
Total costs=variable costs+capital costs,
in NOK, in 1996-prices
lnCT 13.41626 (670823) 0.36335 11.48407 14.64352
CT 713671 245158 97156 2288750
aGeometric means in parentheses.
In Table 4, we present sample statistics for the pro-duction and costs variables used in the calculations. Costs are inflated by the consumer price index and are calculated in 1996-prices. In addition, we use price indices for the four categories of variable inputs ex-plained above. They are obtained from the Statistical Yearbooks of Norway (1973–1997).
5. The cost function results
All relationships estimated are cost functions. Thus, variable costs and total costs, measured as explained in the previous section, are the dependent variables in all calculations presented in this section. All rela-tionships also contain production as an independent variable. In addition, only input prices are included. The results concerning the main issues (cf. Section 1) may be sensitive to how the input prices are treated. Since they vary along the time-dimension only, the results concerning the degree and nature of technical change are likely to be particularly sensitive. We have no proper price for capital. Thus, this issue is explored for variable costs only.
To explore the robustness of the results of the way input prices are treated, five sets of calculations are carried out:
1. No input prices are included.
2. Input prices are included with no restrictions on in-put elasticities. This implies that the scale-elasticity is, however, over-identified.
3. Input prices are included, but a restriction is added to provide a unique estimate on the scale-elasticity. 4. The parameters of input prices are estimated by factor-shares. This method also provides a unique estimate on the scale-elasticity.
5. To allow for non-neutral technical change, the parameters of input prices are estimated by factor-shares for each year. While this allows for systematic (as well as unsystematic) changes in the factor-elasticities over time, their variation with scale of operation is either time-independent or varies in the same way as the scale-elasticity; cf. (12), and corresponding expressions when
β=γ=0,γ=0 andβ=0, respectively.
Each of the five sets of results consists of 12 es-timated relations. In addition, we have one set of results with total costs as dependent variable. Since we do not have any proper price of capital in our data, no factor-prices are included in this set.
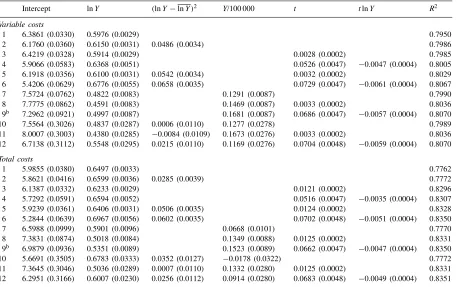
These results allow us to carry out the test proce-dures given in Fig. 1, as well as tests of hypotheses concerning the degree and nature of technical change. In Table 5, we present the results for variable and total costs with no factor-prices included. And in Table 6, the main findings from these calculations, as well as those for variable costs with factor-prices included, are presented.8 They can be summarized in the
fol-lowing way. The results for the Cobb–Douglas spec-ification confirm the results of previous studies about increasing returns to scale in Norwegian dairy pro-duction. According to the Cobb–Douglas results, the scale-elasticity is increasing over time, supporting the hypothesis of scale-augmenting technical change.
The test procedure of functional form explained in Section 3 provides a unique outcome for all sets of results, with the Zellner–Revankar specification as the winner. An illustration of this test procedure is
pre-8 However, the latter sets of cost-function results are not reported
Table 5
Cost-function results for Norwegian dairy productiona
Intercept lnY (lnY−lnY )2 Y/100 000 t tlnY R2
Variable costs
1 6.3861 (0.0330) 0.5976 (0.0029) 0.7950
2 6.1760 (0.0360) 0.6150 (0.0031) 0.0486 (0.0034) 0.7986
3 6.4219 (0.0328) 0.5914 (0.0029) 0.0028 (0.0002) 0.7985
4 5.9066 (0.0583) 0.6368 (0.0051) 0.0526 (0.0047) −0.0047 (0.0004) 0.8005
5 6.1918 (0.0356) 0.6100 (0.0031) 0.0542 (0.0034) 0.0032 (0.0002) 0.8029 6 5.4206 (0.0629) 0.6776 (0.0055) 0.0658 (0.0035) 0.0729 (0.0047) −0.0061 (0.0004) 0.8067
7 7.5724 (0.0762) 0.4822 (0.0083) 0.1291 (0.0087) 0.7990
8 7.7775 (0.0862) 0.4591 (0.0083) 0.1469 (0.0087) 0.0033 (0.0002) 0.8036 9b 7.2962 (0.0921) 0.4997 (0.0087) 0.1681 (0.0087) 0.0686 (0.0047) −0.0057 (0.0004) 0.8070
10 7.5564 (0.3026) 0.4837 (0.0287) 0.0006 (0.0110) 0.1277 (0.0278) 0.7989 11 8.0007 (0.3003) 0.4380 (0.0285) −0.0084 (0.0109) 0.1673 (0.0276) 0.0033 (0.0002) 0.8036
12 6.7138 (0.3112) 0.5548 (0.0295) 0.0215 (0.0110) 0.1169 (0.0276) 0.0704 (0.0048) −0.0059 (0.0004) 0.8070
Total costs
1 5.9855 (0.0380) 0.6497 (0.0033) 0.7762
2 5.8621 (0.0416) 0.6599 (0.0036) 0.0285 (0.0039) 0.7772
3 6.1387 (0.0332) 0.6233 (0.0029) 0.0121 (0.0002) 0.8296
4 5.7292 (0.0591) 0.6594 (0.0052) 0.0516 (0.0047) −0.0035 (0.0004) 0.8307
5 5.9239 (0.0361) 0.6406 (0.0031) 0.0506 (0.0035) 0.0124 (0.0002) 0.8328 6 5.2844 (0.0639) 0.6967 (0.0056) 0.0602 (0.0035) 0.0702 (0.0048) −0.0051 (0.0004) 0.8350
7 6.5988 (0.0999) 0.5901 (0.0096) 0.0668 (0.0101) 0.7770
8 7.3831 (0.0874) 0.5018 (0.0084) 0.1349 (0.0088) 0.0125 (0.0002) 0.8331 9b 6.9879 (0.0936) 0.5351 (0.0089) 0.1523 (0.0089) 0.0662 (0.0047) −0.0047 (0.0004) 0.8350
10 5.6691 (0.3505) 0.6783 (0.0333) 0.0352 (0.0127) −0.0178 (0.0322) 0.7772
11 7.3645 (0.3046) 0.5036 (0.0289) 0.0007 (0.0110) 0.1332 (0.0280) 0.0125 (0.0002) 0.8331 12 6.2951 (0.3166) 0.6007 (0.0230) 0.0256 (0.0112) 0.0914 (0.0280) 0.0683 (0.0048) −0.0049 (0.0004) 0.8351
aStandard deviation in parentheses.
bThe relation selected by the test procedure outlined in Fig. 1.
sented in Fig. 1, based on the results for variable costs in Table 5, and relations (6), (9), and (12). The results imply that the Zellner–Revankar specification is not rejected for the combined Nerlove/Zellner–Revankar specification at the 1% level, while the Nerlove spec-ification is. At the second level, the Cobb–Douglas specification is rejected for both the Nerlove and the Zellner–Revankar specifications. Thus, the Zellner–Revankar specification wins, and so it does for all other cases explored as well.
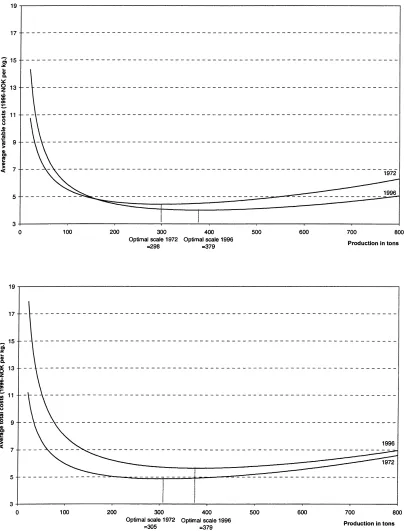
Using variable costs, technical change seems to be positive (implying reduced average costs over time) for medium-sized and big farms only. Using total costs, technical change is actually negative (implying larger average costs over time) for all size-groups; cf. Fig. 2. The exclusion of factor-prices could be an explana-tion for these rather strange results. However, when including factor-prices, technical progress is negative for all units according to the variable costs results also.
This suggests, if anything, that the results reported aboveunder-ratethe degree of reduced efficiency in
Norwegian dairy production in the period studied. Since the interaction term between production and the trend variable has a significantly negative coeffi-cient, optimal scale increases significantly over time. This is the more direct test of scale-augmenting tech-nical change. We note from Table 6 and Fig. 2 that it is, however, quite small. The optimal scale is 10–27% larger in 1996 than in 1972 according to the results reported in Table 6.
of factor-elasticities seems to matter much. This is particularly surprising since there are substantial and systematic movements of the factor-shares over time, suggesting strong non-neutral technical change.
6. Estimated gains and structural effects of exploiting scale-economies
By using the procedure explained at the end of Sec-tion 3 on the producSec-tion data, we get an estimate on the potential gains of exploiting scale-economies in Norwegian dairy production. As explained in Section 4, we then have to use calculated production. This is done by means of the ‘production function’ in (19) estimated on the basis of the sample data:
lnY =8.3897
Gains and structural effects are also calculated on the basis of observed production in thesample, and
pro-duction in the sample computed by means of (20).
This can serve as a basis for evaluating our ad hoc estimated production procedure for thepopulation.
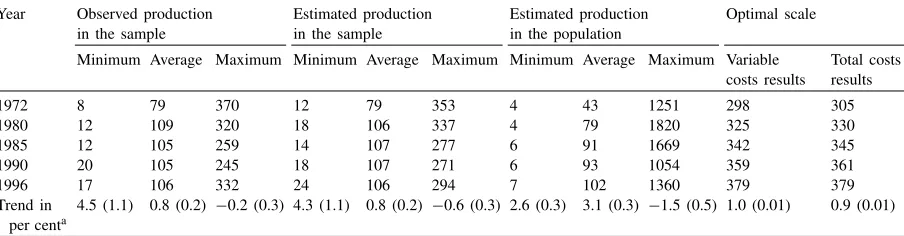
In Table 7, some basic statistics for the three sets of production data, as well as optimal scale are presented
Table 7
Production and optimal scale (ton) for selected years Year Observed production Minimum Average Maximum Minimum Average Maximum Minimum Average Maximum Variable
costs results aStandard deviation in parenthesis.
for selected years. We note from Table 7 that the largest farms in the population are many times larger than the largest farms in the sample. Thus, even if the large farms are over-represented in our sample during most of the period considered (cf. Table 2), the really large ones are not.
We also note that estimated production data in the sample seem to correspond fairly well to observed production. This suggests that the estimated produc-tion procedure used by us is fairly reliable. The differ-ences between the two sample sets on one hand and the set of estimated production for the population on the other are likely to reflect the differences pointed out in Section 3.
In Table 8, we present the estimated average costs for farms of optimal size and the gains of exploiting scale-economies, estimated on the basis of the three sets of production presented in Table 7. In Table 9, we correspondingly have the estimated effect on the num-ber of farms. Tables 8 and 9 tell us several interesting stories.
In 1996, full exploitation of scale-economies would reduce total costs by 27%, or in absolute numbers, slightly less than 5 billion NOK. This corresponds almost exactly to the total public support of dairy farms in 1996; cf. the end of Section 2.
The effect this would have had on the number of farms is, however, dramatic: a reduction of about 73%, or in absolute numbers, from about 22 000 to less than 6000.
Table 8
Estimated minimum average costs and gains by exploiting scale-economies for selected yearsa
Year Estimated minimum average costs Estimated gains in terms of percentage reduction in costs Observed production
in the sample
Estimated production in the sample
Estimated production in the population Variable costs Total costs Variable costs Total costs Variable costs Total costs Variable costs Total costs
1972 4.44 4.86 24 23 25 24 39 37
1980 4.31 5.13 20 19 21 20 29 27
1985 4.22 5.29 24 23 24 22 28 26
1990 4.13 5.46 27 25 26 24 30 27
1996 4.01 5.65 29 27 30 27 30 27
Trendb −0.43 (0.004) 0.63 (0.003) 0.32 (0.05) 0.25 (0.04) 0.32 (0.04) 0.25 (0.04) −0.22 (0.08) −0.24 (0.08) aAverage costs are in NOK per kilo, in 1996-prices, the trend (calculated on the basis of data for all years) is in percent for average
costs and in percentage points for estimated gains.
bStandard deviation in parenthesis.
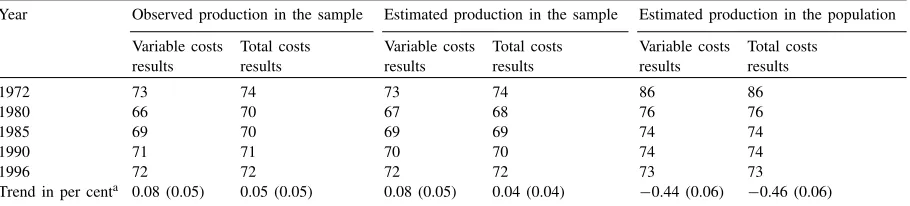
Table 9
Percentage reduction in number of farms by exploiting scale-economies
Year Observed production in the sample Estimated production in the sample Estimated production in the population Variable costs
results
Total costs results
Variable costs results
Total costs results
Variable costs results
Total costs results
1972 73 74 73 74 86 86
1980 66 70 67 68 76 76
1985 69 70 69 69 74 74
1990 71 71 70 70 74 74
1996 72 72 72 72 73 73
Trend in per centa 0.08 (0.05) 0.05 (0.05) 0.08 (0.05) 0.04 (0.04) −0.44 (0.06) −0.46 (0.06) aStandard deviation in parenthesis.
1996, while the average size more than doubled. Since scale-augmenting technical change was weak, this implies that unexploited scale-economies, as well as the structural effects of exploiting them, were sub-stantially reduced in this period. According to our calculations, the unexploited gains measured by the potential reduction in costs are lower by about 10% in 1996 as compared to 1972, while the calculated reduction in the number of farms exploiting this potential is lower by about 13% at the end of the period.
7. Discussion
There are several potential sources of errors in our calculations. Let us first point out that, in one im-portant respect, they could be misleading. The most obvious way to exploit scale-economies is to merge or
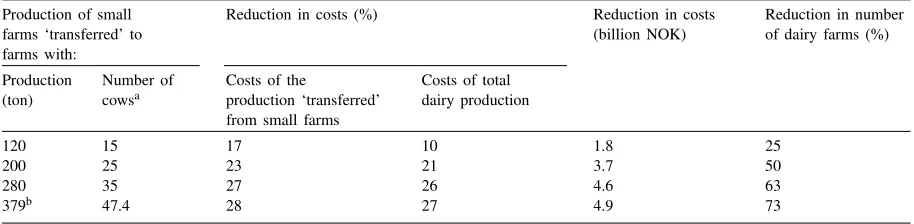
Table 10
Gains and structural changes in 1996 by transferring the production of small dairy farms to larger ones Production of small
farms ‘transferred’ to farms with:
Reduction in costs (%) Reduction in costs (billion NOK)
Reduction in number of dairy farms (%) Production
(ton)
Number of
cowsa Costs of theproduction ‘transferred’
from small farms
aNumber of cows is calculated from production by assuming a production of 8000 kilo of milk and beef (in milk equivalents) which
is close to the average in the sample.
bOptimal size in 1996.
than half the optimal size. Exploiting the remaining scale-economies would imply small gains in relation to the structural changes required.
Second, our results can be affected by usage of calculated instead of observed production. We note that the two sample sets of production data provide quite different results from those obtained on the basis of the population data. They suggest both that gains and effects areincreasingover time in contrast
to the population data results. This is likely to be quite misleading, however, and has to do with the non-representative nature of the sample concerning the ‘dynamics’ of the population in the period studied. The sample does not reflect properly the structural changes taking place in dairy production during this period; cf. Tables 2 and 3. From Tables 2 and 3, we can also see that the size-distributions of the popula-tion and the sample correspond fairly well at the end of the period. Thus, as is shown in Tables 8 and 9, the three sets of production data used provide almost exactly the same results for 1996.
Apart from the problem of representation pointed out, there are surprisingly small differences in the cal-culated gains and structural effects from the three sets of production data. Thus, it seems there are no big and systematic errors in the results referred to above due to the way the calculations are carried out.
Moreover, in an analysis of grain production related closely to the present one, production data are avail-able both for the sample and the population. Using an ad hoc procedure of the same kind as the one ap-plied above, we obtain almost exactly the same results about gains and effects of exploiting scale-economies
on the basis of estimated production as on the basis of observed production.9 This too indicates that our ad
hoc procedure is fairly good for our purpose. Third, the method used is vulnerable to non-homogeneous production. In many industries, small units specialize in small-market/high-price products, while the big ones specialize in mass production. This would lead to positive biases in the estimates of both gains and structural effects of exploiting scale-economies. In manufacturing for instance, this argument could apply, since even within the groups of the more detailed classification, widely different products could be found.10 In dairy production, this
argument cannot, however, be very serious since the output is rather homogenous. Milk is the main product, while most of the beef is a joint product to milk. Actually, a main reason why we selected this branch of agriculture for our exploration was exactly to minimize this source of error.
Fourth, it has been argued that there could be a sys-tematic positive error in the ARAF data on input of labor, overstating the number of hours of work of own-ers and family membown-ers. Even if this could be true, we have found no convincing evidence from Norwegian sources of a substantive error of this kind.
An analysis by Niemi (1983), however, suggests that, for Finland, the actual work done by owners and
9 Cf. Ringstad and Løyland (1999), Tables 8 and 9.
10Cf. Ringstad (1979) where the results, using the same method
family members in agriculture is about 20% less than the work reported in investigations corresponding to those carried out by NAERI for Norway. We do not know if this applies to our data. If it does, calcula-tions carried out, but not reported here, suggest that we have on the average overstated the gains of exploiting scale-economies by about 4 percentage points, and the structural effects by about 2 percentage points.
Fifth, in our calculations, the opportunity cost of labor is the value of the work done by owners and family members in alternative employment outside the farm. Thus, we ignore the fact that the reservation wage for many farmers is likely to be less (cf. Gaasland and Nersten, 1993). This should be taken into account in the interpretation of the results.
Sixth, it has been frequently argued that the ARAF farms are not representative due to a self-selection effect: those willing to take part in a comprehensive reporting of their required activities are likely to be better farmers than the average. In this study, we do not have the information needed to be able say anything about the possible impact this has on our results. It has been explored for specialized grain pro-duction, however, and the results suggested that this self-selection problem does not matter much.11
Finally, analyses carried out previously suggest that there are substantial regional differences in costs in Norwegian dairy production; cf. for instance Giæver et al. (1995). This could have affected our calcula-tions. This is the case, if for instance efficiency is gen-erally better in regions with larger farms than in other regions.
By introducing binary variables for region in our cost functions, regional cost differences are confirmed.12 They have almost no impact on the
calculated gains and structural effects of exploiting scale-economies, however. Taking regional differ-ences in costs into account, both are slightly larger, but the difference is on the average less than 1 per-centage points. Thus, if anything, these calculations
11Cf. Ringstad and Løyland (1999), Section 6.
12We use the same classification as Giæver et al. (1995) with
eight regions. In the calculations, the farms of the central-eastern part of Norway form the basis group. We find that total costs are significantly larger for farms in non-central-eastern part of Norway and for those in northern Norway, while they are significantly smaller for the farms of other regions (in western Norway and middle Norway).
suggest that we have under-rated the gains and struc-tural effects of exploiting scale-economies by the calculations reported previously.
Results obtained for specialized grain production are basically the same as those reported here.13
The most important difference is that, in the tests of the functional form, the Nerlove specification wins in all cases. There is also another striking contrast between dairy and grain production, both concern-ing the development of efficiency and the degree of scale-augmenting technical change during the period 1972–1996. In grain production, there is a substantial improvement in efficiency during this period, at least in terms of reduced average variable costs, and the optimal scale is between two and three times larger in 1996 than in 1972.
We do not have the information available to be able to explain these differences properly. A likely ex-planation, however, comprises the quota system and other quantitative regulations of dairy production not found in grain production. Such regulations imply that efficiency-improving investments that require larger production to be profitable will not be carried out. The livestock subsidy could also have a negative impact on efficiency since it gives the farmers an incentive to keep more cows, with larger feeding and capital costs. Another possible explanation comprises regula-tions due to environmental consideraregula-tions.
8. Main conclusions
In this paper, we have explored four main issues about Norwegian dairy production:
1. Do scale-economies exist in this branch of agricul-tural production, and if so,
2. is there an optimal scale of operation? 3. Is there scale-augmenting technical change? 4. What are the gains of exploiting any scale-economies,
and what would be the structural effects of doing so?
These issues are analyzed by means of data for dairy farms in the period 1972–1996, and even if we have a very small sample in relation to the population, the answers for all of them come out loud and clear from our calculations:
1. There are large unexploited scale-economies in
Norwegian dairy production.
2. Thereisan optimal scale of operation for a given
year.
3. There issomescale-augmenting technical change
since optimal scale increases slightly but signifi-cantly over time.
4. Full exploitation of scale-economies would imply substantial cost reductions. Our calculations sug-gest that, in 1996, costs could have been reduced by about 27%, or slightly less than 5 billion NOK, which is almost exactly the total public support to dairy farms that year. It would imply a dramatic reduction, however, in the number of farms: about 73%.
In 1996, this would have required that the small farms were merged or otherwise transformed into farms with slightly less than 50 cows. This would have implied a reduction in the number of farms from about 22 000 to less than 6000.14 However, most of
the scale-economies can be exploited by transforming small farms to farms substantially below the optimal size. Thus, by transforming farms with less than 25 cows to farms of this size, about three-fourths of the gains could be exploited, with substantially less dramatic structural effects.
The calculated gains and effects of exploiting scale-economies are substantially larger at the start of the period studied than at the end. During this period, almost 60% of the dairy farms, mostly small ones, disappeared. Thus, some of the scale-economies present at the start of the period have been ex-ploited. During the same period, there has been some scale-augmenting technical change which increases the scale-economies over time. These changes have, however, been small, both as compared to the struc-tural changes taking place during the period, and as compared to the scale-augmenting technical change in a different part of Norwegian agriculture, grain production, during the same period (Ringstad and Løyland, 1999).
General cost-saving technology development in Norwegian dairy production is also quite poor in the period studied. This, as well as the small
14Note that only farms with milk as the main product are included
in our analysis. This means that about 10% of farms producing milk are excluded.
scale-augmenting technical change, are likely to be due to the comprehensive quantitative regulations of dairy production, in particular, the quota system, which for instance implies that efficiency-improving investments which require larger production to be profitable are not carried out.
Thus, there seem to be substantial hidden costs of the Norwegian dairy farm policy. Actually, this could be a more serious side effect than the unexploited scale-economies as calculated by us, which are also largely due to this policy.
Acknowledgements
This paper is financed by the Norwegian Re-search Council. We are indebted to Ola Flaten, Har-ald Giæver, Eivind Hoffman, Lars Håkonsen, Sven Kleppa, Tor Jakob Klette, and two anonymous refer-ees for valuable comments on a previous draft.
References
Aarseth, R., Elstrand, H., 1991. Kostnader ved melkeproduksjon på Vestlandet og Østlandets flatbygder ved varierende produksjonsomfang. Master thesis, Department of Economics and Social Sciences, Agricultural University of Norway, Ås. Bailey, K., Hardin, D., Spain, J., Garrett, J., Hoehne, J., Randle,
R., Ricketts, R., Steevens, B., Zulovich, J., 1997. An economic simulation study of large-scale dairy units in the Midwest. J. Dairy Sci. 80 (1), 205–214.
Brunstad, R.J., Gaasland, I., Vaardal, E., 1995. Agriculture as a provider of public goods: a case study for Norway. Agric. Econ. 13, 39–49.
Burton, M., Ozanne, P.A., Collinson, C., 1993. Long-run average cost curves in the England and Wales dairy industry — comment. J. Agric. Econ. 44, 502–506.
Christensen, L.R., Greene, W.H., 1976. Economies of scale in US electric power generation. J. Pol. Econ. 84, 655–676. Dawson, P.J., Hubbart, L.J., 1987. Management and size economics
in the England and Wales dairy sector. J. Agric. Econ. 38, 27–37.
Flaten, O., Giæver, H., 1998. Strukturendringer i norsk mjølkeproduksjon. Report No. 18, Department of Economics and Social Sciences, Agricultural University of Norway, Ås. Førsund, F., 1975. The homothetic production function. Swedish
J. Econ. 77, 234–244.
Gaasland, I., Nersten, N.K., 1993. Jordbruksmodellen. Working Paper No. 44, SNF-Bergen.
Hallam, A., 1993. Empirical studies of size, structure and efficiency in agriculture. In: Hallam, A. (Ed.), Size, Structure and the Changing Face of American Agriculture. Westwiev Press, Boulder, CO, pp. 204–231.
Hatling, R., Lynum, E., 1993. En analyse av kostnadsvariasjon i norsk melkeproduksjon. Master thesis, Department of Economics and Social Sciences, Agricultural University of Norway, Ås.
Hubbard, L.J., 1993. Long run average cost curves in the English and Wales dairy sector. J. Agric. Econ. 44, 144–148. Kerkvliet, J.R., Nebesky, W., Tremblay, C.H., Tremblay, V.J., 1998.
Efficiency and technological change in the US brewing industry. J. Product. Anal. 10, 271–288.
Levin, R.C., 1977. Technical change and optimal scale: some evidence and implications. Southern Econ. J. 44, 208–221. Matulich, S.C., 1978. Efficiency in large-scale farming: incentives
for structural changes. Am. J. Agric. Econ. 60, 642–647. Mochini, G., 1988. The cost structure of Ontario dairy farms: a
microeconometric analysis. Can. J. Agric. Econ. 36, 187–206. Mochini, G., 1990. Nonparametric and semiparametric estimation: an analysis of multiproduct returns to scale. Am. J. Agric. Econ. 72, 589–596.
Mukhtar, S.M., Dawson, P.J., 1990. Herd size and unit costs of production in the England and Wales dairy sector. J. Agric. Econ. 41, 9–20.
Nerlove, M., 1963. Returns to scale in electricity supply. In: Christ, C.F. (Ed.), Measurement in Economics. Stanford University Press, Stanford.
Niemi, I., 1983. Systematic bias in hours worked? Statistisk tidskrift 4, 326–330.
OECD, 1996. Agricultural policies, markets and trade in OECD. Monitoring and evaluation. Main Report, Paris.
Ringstad, V., 1967. Econometric analyses based on a production function with neutrally variable scale-elasticity. Swedish J. Econ. 69, 115–133.
Ringstad, V., 1974. Some empirical evidence of the decreasing scale-elasticity. Econometrica 42, 87–101.
Ringstad, V., 1979. A method of calculating the effects and gains of utilizing scale-economies. Econometrica 47, 789–795.
Ringstad, V., Løyland, K., 1998. Cost-optimal scale of child care institutions. J. Product. Anal. 10, 305–311.
Ringstad, V., Løyland, K., 1999. The Gains and Structural Effects of Exploiting Scale-Economies in Specialized Grain Production in Norway. Working Paper No. 1/99, Telemark Research Institute, Bø.
Statistics Norway (1973–1997), Statistical Yearbook. Oslo. Zellner, A., Revankar, N.S., 1969. Generalized production