Heating system position and vertical microclimate distribution in
chrysanthemum greenhouse
F.L.K. Kempkes
∗, N.J. van de Braak
Department of Greenhouse Engineering, IMAG, Wageningen UR, P.O. Box 43, 6700 AA Wageningen, The Netherlands
Received 4 October 1999; received in revised form 26 March 2000; accepted 6 April 2000
Abstract
In the cultivation of greenhouse chrysanthemums, the main heating system is often positioned overhead. Under unfavourable conditions, this can lead to unacceptable vertical temperature differences or high relative humidity (RH) in the crop and ultimately to increased risk of diseases. Moreover, the overhead heating pipes will result in higher energy loss compared to a heating system at a lower position. Heating circuits at different heights, controlled independently of each other, can help to prevent these problems. To see the effects of the vertical position of independent heating circuits in chrysanthemums, the distribution of air humidity and that of air and leaf temperatures have been measured under a range of ambient conditions, using three combinations of two heating circuits at varying heights. All three configurations provide higher air temperatures above the crop than within, but the air temperature above the crop is decreased under cold outside conditions by about 1.5◦C when the primary heating system is mounted low in the crop. The large vertical temperature differences in the crop when using the traditional heating system with overhead pipes can be avoided by applying a crop heating system instead. Using the lower circuit as a primary heating system increases, on cold nights, the air temperature in the lower layers of the crop by about 3◦C, reduces the RH there by about 7% and decreases more quickly the dew point below the crop temperature after
irrigation. The low positioned heating system had 7–9% lower heating requirement than the traditional system with heating pipes overhead. Between the three compartments, no significant differences occurred in leaf area index (LAI), and length and weight of stems. Nor was any difference found in flower quality. © 2000 Elsevier Science B.V. All rights reserved.
Keywords: Temperature distribution; Relative humidity; Heating system; Heating requirement; Chrysanthemum
1. Introduction
The final target of environmental control in green-houses is the optimisation of crop production. The greenhouse cover and heating system cause a change in the climatic conditions compared to those outside, such as increased temperature and water vapour pres-sure of the air, reduction of radiation and air velocity, and larger fluctuations of the carbon dioxide
concen-∗Corresponding author.
E-mail address: [email protected] (F.L.K. Kempkes)
tration. These changes have an impact on growth, pro-duction and quality of the greenhouse crop (Bakker, 1995). Generally, the control actions in greenhouses are based on temperature and humidity measurements made at a representative location in the greenhouse, either at a fixed height or near the growing point of the crop (Gieling and Schurer, 1995).
In greenhouse cultivation of chrysanthemums, the main heating system is often positioned overhead to facilitate labour. Consequently, the greenhouse climate will not be homogeneous, which under unfavourable conditions can lead to unacceptable high relative
134 F.L.K. Kempkes, N.J. van de Braak / Agricultural and Forest Meteorology 104 (2000) 133–142
humidity (RH) and/or vertical temperature differences in the crop. The combination of these two can cause condensation on the crop, and consequently, increase the risk of diseases. Moreover, compared to pipes at a lower position, the overhead heating pipes will result in an increase in energy loss from the greenhouse due to increased thermal radiation exchange between the heating system and the roof (Bot and Van de Braak, 1995).
Independently controlled heating circuits at differ-ent heights can help to prevdiffer-ent these problems and enable local crop heating to influence crop develop-ment in greenhouses, as the temperature has a direct effect on the sink strength with respect to assimi-lates of the individual parts of the plant (De Koning, 1994; Marcelis and De Koning, 1995). Furthermore, the rate of development (leaf unfolding and flower-ing) in many crops responds, over a wide range of temperatures, linearly to temperature (e.g. Karlsson et al., 1991; De Koning, 1994). Consequently, local crop heating can be used to control the partitioning of assimilates or to enhance crop development (Verkleij, 1985).
Several authors have reported on vertical temper-ature distribution in greenhouses. Winspear (1978) concluded that, when the heating pipes in a tomato crop were mounted below the top of the crop, the air temperature above the crop became lower than that in the crop. Yang (1995) found the same for potted chrysanthemums on air permeable benches. Both Winspear and Yang found that leaf tempera-tures were, in general, below the air temperature in the canopy. Aubinet and Deltour (1993) developed a model to predict the vertical air temperature profile in the plume above a heating pipe. None of these authors considered local leaf temperature effects of the heat-ing pipes. Kempkes et al. (2000) developed a model to predict vertical leaf temperature distribution in a greenhouse tomato crop as a function of the prevailing air temperature. However, no detailed information is available on the temperature distribution in a chrysan-themum crop cultivated in beds. Therefore, to meet the objectives of this study, an experimental approach was chosen in order to determine the effects of the position and use of independently controllable heating circuits on the microclimate and energy efficiency of greenhouse chrysanthemum cultivation. Temperature and humidity distribution were measured under
var-ious night time conditions, using three combinations of two heating circuits at varying heights.
2. Experimental setup
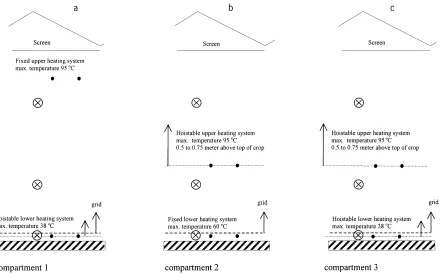
Fig. 1. (a) Compartment 1 ‘traditional heating system’, (b) Compartment 2 ‘fixed low heating system’ and (c) Compartment 3 ‘variable heating system’ with aspirated wet and dry bulb temperature sensors (⊗), two at fixed heights of 0.15 and 2.2 m and one at variable height (on the top of the crop) in each compartment. Solid circles represent the heating pipes.
The treatment and climate control during the test phase are shown in Table 1 and can be characterised as ‘traditional’ in Compartment 1, ‘lower circuit fixed low and upper circuit raised with crop’ in
Compart-Table 1
Overview of the experimental treatments during the test phase
Compartment 1 Compartment 2 Compartment 3
Height of the upper heating circuit Fixed at 2.65 m 0.5–0.75 m above the crop 0.5–0.75 m above the crop Height of the lower heating circuit Up with grida Fixed at 0.1 m Up with grida
Maximum temperature of the upper heating circuit
95◦C 95◦C 95◦C
Maximum temperature of the lower heating circuit
38◦C 60◦C 38◦C
Temperature control in the heating pipes
Lower and upper circuit equal until maximum pipe temper-ature of the lower circuit is reached, then upper circuit
Lower circuit first until the maximum pipe temperature is reached, then upper circuit
Lower and upper circuit equal until the maximum pipe tem-perature of the lower circuit is reached, then upper circuit
aA steel grid (0.1 m×0.1 m) is used to keep the stems upright as they grow. This grid is resting on the lower heating circuit, which is
raised every 2 weeks.
136 F.L.K. Kempkes, N.J. van de Braak / Agricultural and Forest Meteorology 104 (2000) 133–142
and wet bulb temperature sensor sets were installed at heights of 0.15 and 2.2 m for temperature and humidity measurements (Fig. 1). In Compartment 2, leaf tem-peratures were measured by 56 thermocouples, dis-tributed over 3 m of bed length and width, and crop height. Another five thermocouples in Compartment 2 measured soil temperatures at a depth of 0.1 m over half a span width (1.6 m). As a limited amount of equipment was available, only one compartment could be considered for the detailed measurements. Com-partment 2 was chosen because the high maximum temperature of the lower heating circuit in the crop would show the largest influence on the crop tem-perature distribution. An automatic datalogging sys-tem and computer network collected all sys-temperatures. During the experiment, several times leaf area in-dex (LAI) and the length and weight of stems were determined.
3. Results
3.1. Microclimate and crop temperatures
The air temperature and humidity measured in the aspirated boxes showed, averaged over the test phase period, large differences between the compartments (Table 2). In the lower layers of the crop, the air tem-perature of Compartment 2 is almost 3◦C higher than in the other two compartments and the RH in the lower part of the greenhouse is about 7% lower in Compart-ment 2 than in the other two compartCompart-ments. The sen-sors used for climate control in the three compartments (0.75–1.2 m height) with equal temperature set-points show almost equal temperatures (maximum difference 0.5◦C).
Table 2
Averages of greenhouse air temperatures Ta (in◦C) and relative
humidity (RH, in %) during the test phase (26 January 1997–10 March 1998) in Compartments 1–3 at various heights
Height (m) Compartment 1 Compartment 2 Compartment 3
Ta RH Ta RH Ta RH
0.15 17.2 91.6 19.9 84.5 17.0 91.0 0.75–1.2 19.4 77.0 19.9 77.8 19.8 76.5 2.25 20.3 72.8 20.7 78.2 20.7 74.9
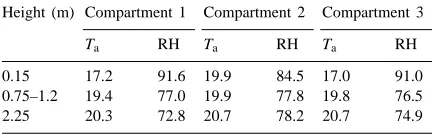
Fig. 2a shows the outside air temperature and the global radiation versus time during 2 days with low temperatures. The first day is sunny, so the artificial lighting in the compartments was switched off be-tween 10:00 a.m. and 4:00 p.m. On the second day, the global radiation was low and the lights were switched on until sunset. Fig. 2b–d show air temperatures (in the aspirated boxes) for these two days at a height of 2.2, 0.9 and 0.15 m, respectively. At a height of 2.2 m (Fig. 2b), Compartment 3 had systematically the high-est temperature during the night, caused by the heating system that was located below the measuring box. In Compartment 2, more heat was supplied in the lower part of the crop just above the ground, while in Com-partment 1, the upper heating system was located at 2.65 m, above the temperature sensors that were at a height of 2.2 m. As a consequence, the vertical tem-perature gradient of about 3.5◦C in the crop of Com-partment 1 reduces to about 0.5◦C in Compartment 2. As during the daytime, air mixing above the crop level was good, air temperatures at equal heights dif-fered less between the compartments than at night when less air mixing occurred. On the first day, the daytime air temperature became high due to the sunny weather. Cloudiness on the second day resulted in a daytime greenhouse air temperature around the set-point of 18.5◦C. At a height of 0.9 m (Fig. 2c), the temperature difference between compartments was small because the climate control was based on the temperature at this height (0.4◦C of the difference was caused by an off set of the control sensor of Compartment 1).
At a height of 0.15 m (Fig. 2d), the differences be-tween the Compartments 1 and 3 were small, but in Compartment 2, where the lower circuit at a height of 0.10 m was the primary heating system, the aver-age air temperature at 0.15 m was about 2.5◦C higher. This also has consequences for the RH at this height, which was 7% lower in Compartment 2 than in Com-partments 1 and 3. The absolute humidity at this height is higher in Compartment 2 (average 11 g kg−1), com-pared to Compartments 1 and 3 (average 10 g kg−1). The low position of the heating pipes in Compartment 2 and its use as the primary heating system increased the soil temperature (about 1.3◦C higher) and the evap-oration of water from the soil.
Fig. 2. On 26 January at 17:00 hours to 28 January at 17:00 hours: (a) outside air temperature (—) and global radiation (···); (b) screen closure and air temperature in three compartments at a height of 2.2 m — Compartment 1 (—), Compartment 2 (–·–·), Compartment 3 (···); (c) screen closure and air temperature in three compartments at a height of 0.9 m — Compartment 1 (—), Compartment 2 (–·–·), Compartment 3 (···); (d) screen closure and air temperature in three compartments at a height of 0.15 m — Compartment 1 (—), Compartment 2 (–·–·), Compartment 3 (···).
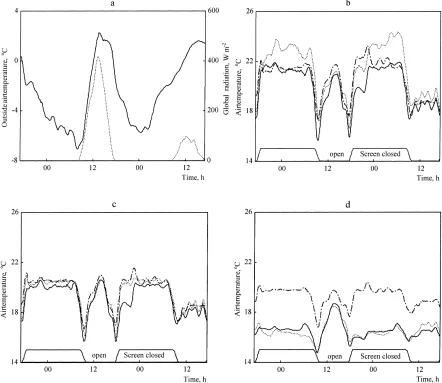
similar to those at low outdoor temperatures (compare Fig. 3c and d with Fig. 2c and d). Due to the lower heating requirement, at a height of 2.2 m, the effect of the upper circuit in Compartment 3 disappeared (Fig. 3b) and the difference between the compart-ments was small (0.1◦C), while at 0.15 m (Fig. 3d), the large differences in temperature between com-partments were similar to those at lower outdoor temperatures. The latter are therefore apparently less
138 F.L.K. Kempkes, N.J. van de Braak / Agricultural and Forest Meteorology 104 (2000) 133–142
Fig. 3. On 1 March at 17:00 hours to 2 March at 17:00 hours: (a) outside air temperature (—) and global radiation (···); (b) screen closure and air temperature in three compartments at a height of 2.2 m — Compartment 1 (—), Compartment 2 (–·–·), Compartment 3 (···); (c) screen closure and air temperature in three compartments at a height of 1.1 m — Compartment 1 (—), Compartment 2 (–·–·), Compartment 3 (···); (d) screen closure and air temperature in three compartments at a height of 0.15 m — Compartment 1 (—), Compartment 2 (–·–·), Compartment 3 (···).
was, however, higher — on an average, 12 g kg−1, against 11 g kg−1 in Compartments 1 and 3. During the second night at 4.00 a.m., an overhead sprinkler irrigation system was switched on (marked point in Fig. 3b). This decreased the air temperature in all compartments by about 1◦C at 2.2 m (Fig. 3b; an effect of evaporative cooling) and by about 0.5◦C in the climate control measuring box (Fig. 3c). In
the vertical direction, the temperature differences in Compartment 2 were about 2◦C and smaller than in Compartments 1 and 3, where these differences reach up to 4◦C. In all compartments, the vertical temperature differences above the crop were small.
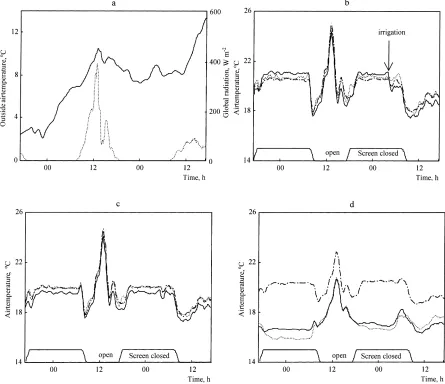
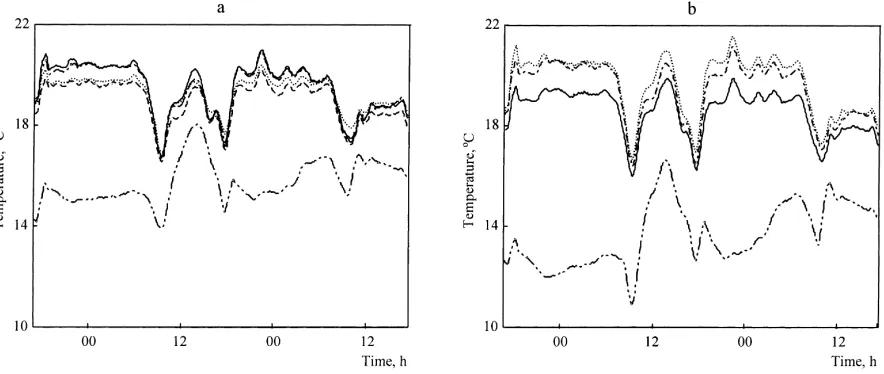
Fig. 4. Dew point, air and crop temperatures at two levels in Compartment 2 on 26 January at 17:00 hours to 28 January at 17:00 hours: (a) lower half — dew point at 0.15 m (–· ·–), dry bulb temperature at 0.15 m (···), plant temperature at 0.06 m (----), plant temperature at 0.24 m (–·–·), plant temperature at 0.36 m (—); (b) upper half — dew point at 0.9 m (–· ·–), dry bulb temperature at 0.9 m (···), plant temperature at 0.55 m (----), plant temperature at 0.64 m (—).
and averaged to obtain vertical temperature profiles for the flower-bed at the end of January. Fig. 4a and b show the dew point, the air and the crop tempera-ture that are, respectively, low and high, in the crop of Compartment 2 for the same cold period as that shown in Fig. 2. In Fig. 4a, the leaf temperatures at heights of 0.06, 0.24 and 0.36 m are presented together with the air temperature and dew point temperature at a height of 0.15 m. The leaf temperatures at 0.24 and 0.36 m were almost equal and above the air temper-ature, while the crop temperature of the lowest layer of leaves (centre at a height of about 0.06 m) was al-ways below the air temperature. During the night, the temperature differences between the leaves and the air were relatively large (up to 2◦C), but during the day-time, these differences were very small.
In Fig. 4b, the leaf temperatures at heights of 0.55 and 0.64 m are presented together with the air tem-perature and dew point temtem-perature at a height of 0.90 m. Fig. 5a and b are similar to Fig. 4 but for the warmer period of 1–3 March. As the crop was higher here, the leaf temperatures are grouped in six layers with centres at 0.06, 0.24, 0.36, 0.54, 0.67 and 0.79 m. The temperature profiles in this period are al-most similar to that during the colder days, but as less heating was required, the temperature differences in
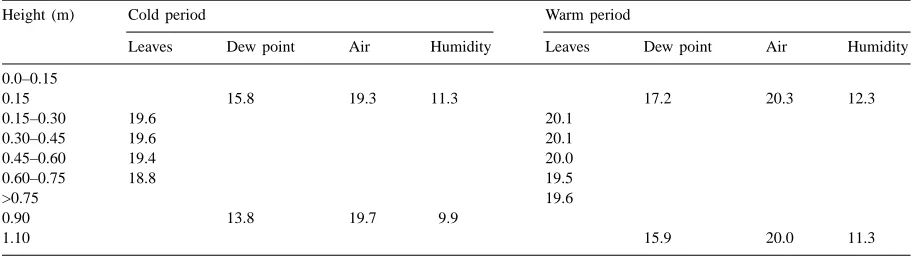
the crop were consequently smaller. The crop tem-perature never dropped below the dew point temper-ature, so no condensation occurred. When irrigation was switched on (second night, about 4.00 a.m.), only a small decrease was observed in the air and plant temperatures, but a significant increase (4◦C) was ob-served in the dew point temperature. Thereafter, it took many hours before the dew point temperature became lower than the leaf temperature again. Con-sequently it took a long time before the crop got the opportunity to dry. In Compartments 1 and 3, this unfavourable situation lasted even longer because the maximum temperature of the lower circuit was limited to 38◦C instead of 60◦C. Table 3 shows the averages of leaf, dew point and air temperature for both periods.
3.2. Heating requirement
To compare the heating requirements of the three compartments, the energy input during the test phase is determined by cumulating the calculated heat transfer from the heating system to the greenhouse air:
140 F.L.K. Kempkes, N.J. van de Braak / Agricultural and Forest Meteorology 104 (2000) 133–142
Fig. 5. Dew point, air and crop temperatures at two levels in Compartment 2 on 1 March at 17:00 hours to 3 March at 17:00 hours: (a) lower half — dew point at 0.15 m (–· ·–), dry bulb temperature at 0.15 m (···), plant temperature at 0.06 m (----), plant temperature at 0.24 m (–·–·), plant temperature at 0.36 m (—); (b) upper half — dew point at 1.1 m (–· ·–), dry bulb temperature at 1.1 m (···), plant temperature at 0.54 m (----), plant temperature at 0.67 m (–·–·), plant temperature at 0.79 m (—).
where Q is the energy supplied per m2greenhouse area in J m−2,αthe heat transfer coefficient of the heating pipe in W m−2K−1, A the surface area of the heating pipe per m2greenhouse area in m2m−2, T the temper-ature in K and where t is the time period in s in which the temperatures occur. Subscript l indicates the lower and u the upper heating system and a the air near the heating pipe. The heating requirement during the test phase (26 January 1997–10 March 1998) for
Com-Table 3
Average temperatures (in◦C) of leaves, dew point and air and the absolute humidity (in g kg−1) in the crop at various heights during a cold period (26 January at 17:00 hours to 28 January at 17:00 hours) and a warm period (1 March at 17:00 hours to 3 March at 03:00 hours) in Compartment 2
Height (m) Cold period Warm period
Leaves Dew point Air Humidity Leaves Dew point Air Humidity
0.0–0.15
0.15 15.8 19.3 11.3 17.2 20.3 12.3
0.15–0.30 19.6 20.1
0.30–0.45 19.6 20.1
0.45–0.60 19.4 20.0
0.60–0.75 18.8 19.5
>0.75 19.6
0.90 13.8 19.7 9.9
1.10 15.9 20.0 11.3
partments 2 and 3 was 89% compared to Compart-ment 1, where the traditional overhead heating system was mounted. As expected, the configurations with the heating systems at a lower position used less energy.
3.3. Crop response
and weight of stems. Nor was any difference found in flower quality. In Compartment 2 with the high maximum temperature (60◦C) of the lower heating circuit, leaf burning occurred to a small extent where the leaves touched the heating pipes. As these were the lowest leaves, they could be removed without loss of quality.
4. Discussion
The results show that, in general, the air tempera-tures above the crop were higher than within the crop, especially in Compartment 1 with the heating system mounted overhead. When the primary heating system is mounted low in the crop, the greenhouse air temper-ature above the crop can be decreased by about 1.5◦C. This is in agreement with the temperature profiles Winspear (1978) reported for overhead and ground level heating pipes. Yang (1995) found that air tem-peratures above a crop of potted chrysanthemums on permeable benches were lower than within the crop in experiments where all of the heating power was sup-plied below the benches. This agrees with our obser-vation in Compartment 2 and the general expectation that the more the heat supplied in the lower part of the crop or below the crop, the greater is increase in the air temperature within the crop with respect to the temperature above the crop.
The leaf temperatures were very close to the air temperatures within the crop. When the heating re-quirement is high (low outside temperatures), the leaves have slightly higher temperatures than the air, and during warmer periods, the leaves are slightly colder than the air. Yang (1995), who used a heating system under benches with potted chrysanthemums, found that leaf temperatures were generally below the air temperature within the crop, and Zhao et al. (1985) measured leaf temperatures that were higher than air temperatures when using infrared heaters and vice versa when using air heaters. This shows that, if sufficient heat is supplied to the crop, either by heating pipes or by infrared radiation, the crop temperature will be at least locally above the air tem-perature. This provides, on the one hand, a means of control to prevent condensation on the crop, and thus, reduce the risk of diseases, and on the other hand, a tool to influence the growth and development of
the crop. In our experiments, however, the latter was not noticeable as no significant difference was found between the crops in the three compartments.
The heat transfer coefficients we used in our cal-culation of the heat consumption are, in general, dependent on the direct environment of the heating pipes. As this environment is similar for the three compartments and the outcome is applied in a com-parative way, this method can be used without intro-ducing larger errors than when using standard flow meters combined with the measured temperature dif-ference over the heating system (Knies et al., 1999). As a result of reducing the air temperature above the crop, the heating requirement during our test phase decreased by about 11%. Accounting for the distri-bution of the energy demand over a year, the energy conservation will be about 7–9% for a whole year. Nijeboer and Van Holsteijn (1981) reported a much larger reduction of 20%; but they examined one cold day only, which is not representative for a longer cultivation period with varying conditions.
5. Conclusions
The following conclusions can be drawn:
• The three configurations of heating systems for chrysanthemums that were investigated provide higher air temperatures above the crop than within, but the air temperature above the crop can be de-creased by a few degrees when the primary heating system is mounted low in the crop.
• With crop heating as the main heating system, the heating requirement will decrease by 7–9% on a yearly basis as a result of the reduced air tempera-ture above the crop.
• The combination of an upper heating circuit at 0.50–0.75 m above the top of the crop, and a lower circuit as the primary heat source will reduce ver-tical temperature difference in the air and in the crop. When the upper circuit is used as a primary heater, the temperature profile is the same as with the traditional system.
142 F.L.K. Kempkes, N.J. van de Braak / Agricultural and Forest Meteorology 104 (2000) 133–142
Acknowledgements
The authors thank C. Bloemhard and K. Bartels-Schouten of the Experiment Station for their co-operation in the experiments. This research was fi-nanced by the Dutch Ministry of Agriculture, Nature management and Fisheries. Both Landbouwschap and NOVEM acted as co-sponsors.
References
Aubinet, M., Deltour, J., 1993. Natural convection above line heat sources in greenhouse canopies. Int. J. Heat Mass Transfer 37 (12), 1795–1806.
Bakker, J.C., 1995. Greenhouse climate control: constraints and limitations. Acta Hortic. 399, 25–37.
Bot, G.P.A., Van de Braak, N.J., 1995. Transport phenomena. In: Bakker, J.C., Bot, G.P.A., Challa, H., Van de Braak, N.J. (Eds.), Greenhouse Climate Control: An Integrated Approach. Wageningen Pers, Wageningen, pp. 125–134.
De Koning, A.N.M., 1994. Development and dry matter distribution in glasshouse tomato: a quantitative approach. Dissertation, Agricultural University, Wageningen, 240 pp. Gieling, Th.H., Schurer, K., 1995. Sensors and measurement. In:
Bakker, J.C., Bot, G.P.A., Challa, H., Van de Braak, N.J. (Eds.), Greenhouse Climate Control: An Integrated Approach. Wageningen Pers, Wageningen, pp. 211–223.
Karlsson, M.G., Heins, R.D., Gerberick, J.O., Hackmann, M.E., 1991. Temperature driven leaf unfolding rate in Hibiscus
rosa-sinensis. Scientia Hortic. 45, 323–331.
Kempkes, F.L.K., Van de Braak, N.J., Bakker, J.C., 2000. Effect of heating system position on vertical distribution of crop temperature and transpiration in greenhouse tomatoes. J. Agric. Eng. Res. 75, 57–64.
Knies, P., Van de Braak, N.J., Kempkes, F.L.K., 1999. Energieonderzoek in kasexperimenten onderzoek naar de nauwkeurigheid van verschillende methoden (Energy research in greenhouse experiments: accuracy of various methods). Nota P99–107. IMAG, Wageningen, 14 pp (in Dutch).
Marcelis, L.F.M., De Koning, A.N.M., 1995. Biomass partitioning in plants. In: Bakker, J.C., Bot, G.P.A., Challa, H., Van de Braak, N.J. (Eds.), Greenhouse Climate Control: An Integrated Approach. Wageningen Pers, Wageningen, pp. 84–92. Nijeboer, D.J., Van Holsteijn, G.P.A., 1981. Perspectief voor
gewasverwarming bij jaarrond chrysanten (Prospects for crop heating in year round chrysanthemums). Vakblad voor de Bloemisterij 35, 28–33 (in Dutch).
Verkleij, F.N., 1985. Short-term effects of vertical temperature gradients on the translocation and distribution of assimilates. Acta Hortic. 174, 277–282.
Winspear, K.W., 1978. Vertical temperature gradients and greenhouse energy economy. Acta Hortic. 76, 97–103. Yang, X., 1995. Greenhouse micrometeorology and estimation of