www.elsevier.comrlocateranireprosci
The effect of dose and route of oestradiol benzoate
administration on plasma concentrations of
oestradiol and FSH in long-term ovariectomised
heifers
M. O’Rourke
a,b, M.G. Diskin
a,), J.M. Sreenan
a, J.F. Roche
ba ( )
Teagasc Agriculture and Food DeÕelopment Authority , Athenry Research Centre, Athenry,
Co. Galway, Ireland
b
Faculty of Veterinary Medicine, UniÕersity College Dublin, Ballsbridge, Dublin 4, Ireland
Received 25 June 1999; received in revised form 3 November 1999; accepted 2 December 1999
Abstract
Ž .
Oestradiol E2 suppresses FSH and affects follicle wave dynamics in cattle. However, neither the optimum dose of ODB required to suppress FSH nor the effect of route of ODB administration on blood concentrations of E are known; hence, the aim of this experiment was to answer these2
Ž .
questions. Ovariectomised heifers received Progesterone Releasing Intravaginal Device PRID for 7 days, and 4 days later heifers received one of eight ODB treatments at second PRID insertion as
Ž . Ž . Ž . Ž . Ž . Ž . Ž . Ž .
follows; 1 0.0 mg Control; ns3 , 2 0.5 mg ns4 , 3 1.0 mg ns4 , 4 2.5 mg ns6 , Ž .5 5.0 mg Žns4 , 6 10.0 mg. Ž . Žns4 , 7 5.0 mg. Ž . Žns4 , and 8 10.0 mg. Ž . Žns5 . For. treatments 2–6 inclusive, ODB was administered intramuscularly in oil, while for treatments 7 and 8, the ODB in powder form was administered topically in the vagina by gelatine capsule attached to the PRID. Blood samples were collected every 6 h for the first 48 h, every 12 h for the next 48 h, and twice daily for a further 6 days. The interval from ODB administration to peak E2
Ž .
concentration was similar P)0.05 for treatments 2–6 where ODB was administered
intra-Ž . Ž .
muscularly mean 13.4"1.24 h , and was longer P-0.05 for the intravaginal capsule
Ž .
treatments mean 25.5"2.84 h . Plasma concentrations of E increased with increasing intramus-2
Ž Ž . Ž .2 2
cular dose of ODB injected, plasma E2s y0.237q16.109 dose y0.74 dose , R s0.75; .
P-0.05 . Peak plasma concentrations of E following the 5- and 10-mg capsules were similar to2
Ž .
each other and to those following the 0.5-mg injection P)0.05 , but were lower than
Ž .
concentrations obtained following injection of 1.0–5.0 mg P-0.05 . Across all treatments, both
)Corresponding author. Tel.:q353-91-845841; Fax:q353-91-845847.
Ž .
E-mail address: [email protected] M.G. Diskin .
0378-4320r00r$ - see front matterq2000 Elsevier Science B.V. All rights reserved. Ž .
( ) M. O’Rourke et al.rAnimal Reproduction Science 59 2000 1–12
2
the maximum percentage decline in FSH and the interval to FSH nadir were related to the peak
Ž Ž .
plasma concentrations of E2 maximum % decline in FSHs11.17q1.564 peak E2 y0.009
Žpeak E .2, R2 . Ž Ž .
s0.75; P-0.01 , hours to FSH nadirs10.628q1.486 hours to peak E y
2 2
Ž .2 2 .
0.0282 hours to peak E2 , R s0.22; P-0.05 . Concentrations of FSH increased as E2 declined from its peak value, irrespective of maximum value achieved. It was concluded that the intramuscular administration of ODB in oil to ovariectomised heifers given a PRID results in higher plasma concentrations of E2 and causes a greater reduction in FSH than administration topically by intravaginal gelatine capsule. E2 transiently suppresses FSH in ovariectomised heifers, and the magnitude of the suppression is dose-dependent; however FSH concentrations begin to increase 1–2 days after ODB administration while concentrations of E were declining2 but still high.q2000 Elsevier Science B.V. All rights reserved.
Keywords: Cattle; Endocrinology; Ovariectomy; Oestradiol; FSH
1. Introduction
Follicle growth in cattle is a highly regulated process under the control of FSH, LH and local intra-follicular growth factors. There are recurrent waves of follicular growth
Ž
throughout the oestrous cycle Savio et al., 1988; Sirois and Fortune, 1988; Ginther et
. Ž .
al., 1989 , most of pregnancy Ginther et al., 1996a , and they resume early in the
Ž .
postpartum period Murphy et al., 1990; Savio et al., 1990; Stagg et al., 1995 . Each wave begins with the emergence of a cohort of oestrogen active follicles of 3–5 mm in
Ž
diameter, preceded by an increase in concentrations of FSH Adams et al., 1992; Bo et .
al., 1993; Sunderland et al., 1994; Stagg et al., 1998 . This is followed by the selection Ž .
of generally one dominant follicle DF , which occurs in association with declining FSH
Ž .
concentrations Sunderland et al., 1994; Mihm et al., 1997 . Finally, the fate of the DF is
Ž .
determined by LH pulse frequency, where infrequent pulses 1 every 3–4 h lead to DF
Ž .
atresia while more frequent pulses 1 per hour leads to ovulation. Thus, each wave has an inherent life span, determined by the interval from wave emergence to dominance and the duration of dominance. The duration of dominance is dependent on the number
Ž .
of waves 2 or 3 during the oestrous cycle, and the influence of nutrition, lactation and
Ž .
suckling during the postpartum period Roche et al., 1999 on wave dynamics.
The factors that regulate the recurrent FSH increases are mainly of ovarian origin,
Ž . Ž .
particularly from the DF Ginther et al., 1996b with oestradiol E2 one of the key intra-follicular components involved. The relationship between systemic E2 and FSH concentrations however, is unclear and the reported effects of E on FSH are inconsis-2
Ž .
tent. Bolt et al., 1990 reported that 10 mg of oestradiol 17b in 5 ml of sterile corn oil administered intramuscularly, either alone or in combination with norgestomet, sup-pressed plasma FSH in ovariectomised heifers for at least 64 h. Kesner and Convey Ž1982 also reported a suppressive effect of 1 mg of E 17. b in 3 ml safflower seed oil
Ž . Ž .
injected intramuscularly on FSH as did Price and Webb 1988 and Barnes et al. 1990 , where E2 was administered in crystalline form in a subcutaneous implant to intact
Ž . Ž
heifers. Wolfe et al., 1992 found a decrease in FSH when high doses subcutaneous .
implants of E17b were administered to ovariectomised heifers but no effect on FSH
Ž .
following lower doses. However, Schoenemann et al., 1985 found little or no effect of
Ž .
The ability to exogenously regulate FSH concentrations in cattle is important to synchronise follicle wave development in both cyclic and anoestrous cattle. Although progress has been made in recent years on improving the efficiency of oestrous synchronisation regimens, variability in oestrous response and pregnancy rates after treatment are still major limitations preventing its greater use in cattle. It is necessary to control follicle wave dynamics as well as luteal function in order to have a ‘healthy’ DF
Ž .
present at the end of treatment Mihm et al., 1994 . When used together, E2 and
Ž .
progesterone can synchronise follicle waves, with variable success Bo et al., 1995 . However, the optimum dose of E necessary to suppress FSH is not clear, neither is the2 effect of route of administration of E on blood concentrations of E known. Hence, the2 2
aim of this experiment was to determine the effect of dose and route of E administra-2
tion at time of progesterone administration on circulating concentrations of FSH, in order to select optimum dose to use in subsequent studies to manipulate follicle waves. In this experiment, ovariectomised animals given progesterone were used to prevent confounding effects of endogenous E production.2
2. Materials and methods
2.1. Animals and treatments
Thirty-four long-term ovariectomised crossbred beef heifers, 18–24 months of age and weighing 350–480 kg were used. All heifers received a Progesterone Releasing
Ž .
Intravaginal Device PRID, Sanofi France for 7 days in order to simulate luteal phase concentrations of progesterone before treatment. Four days after removal of the first PRID, a new PRID was inserted for a further 7 days. Animals were randomly allocated
Ž . Ž .
to receive one of eight oestradiol benzoate ODB treatments at this time; 1 0.0 mg ŽControl; ns3 , 2 0.5 mg n. Ž . Ž s4 , 3 1 mg n. Ž . Ž s4 , 4 2.5 mg n. Ž . Ž s6 , 5 5 mg. Ž . Žns4 , 6 10 mg n. Ž . Ž s4 all administered by intramuscular injection in 2 ml of corn.
Ž . Ž . Ž . Ž .
oil, 7 5 mg ns4 , and 8 10 mg ns5 ODB in powder form administered by gelatine capsule attached to the PRID. The heifers were kept indoors for the duration of the experiment and fed 2 kg of concentrates per day with ad libitum access to grass silage.
2.2. Blood sampling and hormone assays
Blood samples were collected by jugular venipuncture into 10 ml vacutainer tubes containing EDTA K3. The first sample was taken just before treatment administration,
and then at 6-h intervals for the first 48 h after ODB administration, at 12-h intervals for
Ž .
the second 48 h and twice daily 0900 and 1500 h for a further 6 days, which covered the period up to 3 days after PRID removal. Blood samples were placed in ‘iced’ water and then centrifuged immediately at 1000=g at 48C for 15 min. Following separation, the plasma was stored aty208C until assayed for E and FSH.2
Ž .
A previously validated radioimmunoassay Prendiville et al., 1995 was used to measure E . The sensitivity of the E assay was 0.2 pg mly1 and the inter- and
( ) M. O’Rourke et al.rAnimal Reproduction Science 59 2000 1–12
4
Ž . Ž .
intra-assay coefficients of variation were 10.5% ns9 and 8.7% ns4 , respectively.
Ž .
The FSH assay used USDA bFSH B1 as the standard preparation Crowe et al., 1997 . The sensitivity of the assay was 1 ng mly1 and the inter- and intra-assay coefficients of
Ž . Ž .
variation were 14.7% Ns5 and 13.7% ns6 , respectively.
2.3. Statistical analyses
One heifer, receiving 10.0 mg ODB by intramuscular injection, failed to show any increase in plasma concentrations of E2 until 4 days following treatment and her hormonal data was excluded from analyses. The E , and FSH data were subjected to2
Ž .
repeated measures analyses of variance PROC GLM, SAS, 1989 followed by
regres-Ž .
sion analyses SAS, 1989 . Because of the between animal variability, concentrations of FSH were analysed as % changes from pre-treatment concentrations.
3. Results
3.1. Plasma concentrations of E2
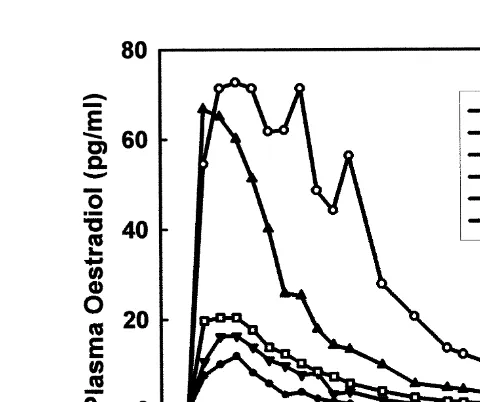
All animals had similar and non-detectable concentrations of E pre-treatment. Peak2 Ž concentrations of E2 following all injection and intravaginal capsule treatments Table
.
1 were significantly higher than pre-treatment concentrations and those in untreated
Ž . Ž .
control animals Fig. 1 . The interval h from administration of ODB to peak E2
Ž . Ž .
concentration Table 1 was similar P)0.1 in heifers given intramuscular injections
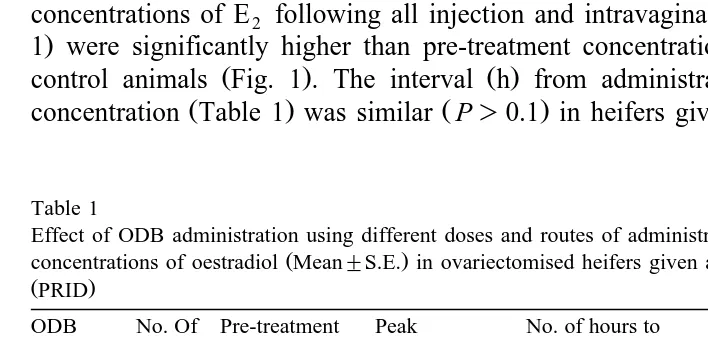
Table 1
Effect of ODB administration using different doses and routes of administration on characteristics of plasma
Ž .
concentrations of oestradiol Mean"S.E. in ovariectomised heifers given a progesterone intravaginal device
ŽPRID.
ODB No. Of Pre-treatment Peak No. of hours to No. of hours No. of hours treatment heifers Concentrations Concentration reach maximum to reach-3 to reach-1
Žmg. Ž .n of E2 of E2Žpgrml. concentration of E2 pgrml of E2 pgrml of E2
Controls
a
0.0 3 0.1 0.1"0.05
Topical administration by intraÕaginal capsule
b ad a a
Ž .
Fig. 1. Effect of different doses 0, 0.5, 1, 2.5, 5, and 10 mg of ODB dissolved in 2 ml of corn oil and administered by intramuscular injection to ovariectomised heifers at the time of PRID insertion on plasma
Ž . Ž .
concentrations of oestradiol pgrml ns3–6 heifers per dose .
Žmean 13.4"1.24 h , and was longer P. Ž -0.05 in heifers given the 5 and 10 mg ODB.
Ž .
by intravaginal capsules mean 25.5"2.84 h . Peak plasma concentration of E2
Ž
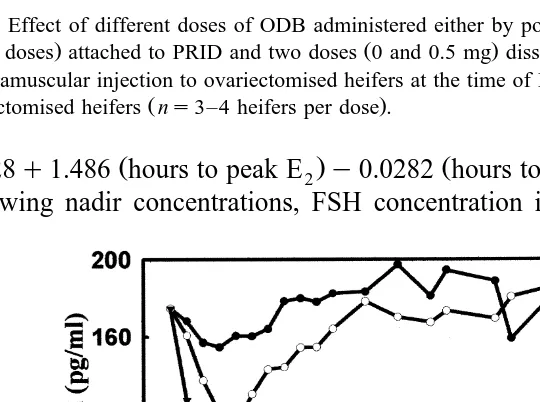
Fig. 2. Effect of different doses of ODB administered either by powdered form in a gelatine capsule 5- and
. Ž .
10-mg doses attached to PRID and two doses 0 and 0.5 mg dissolved in 2 ml of corn oil and administered by intramuscular injection to ovariectomised heifers at the time of PRID insertion on plasma concentrations of
Ž . Ž .
()
M.
O’Rourke
et
al.
r
Animal
Reproduction
Science
59
2000
1
–
12
6
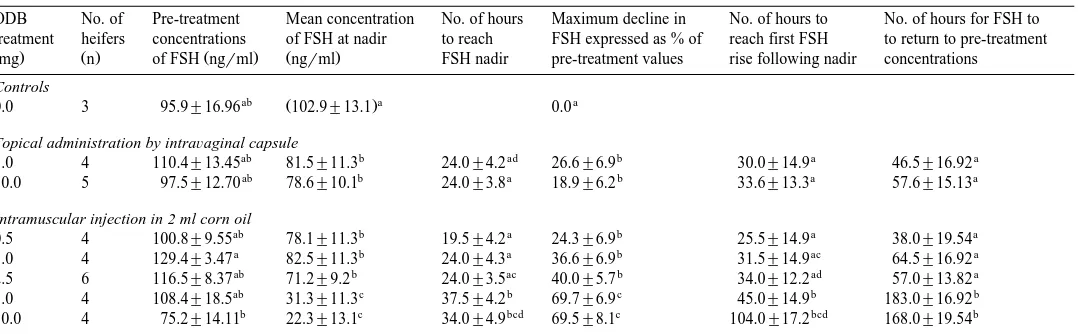
Table 2
Ž .
Effect of ODB administration using different doses and routes of administration on characteristics of FSH concentrations Mean"S.E. in ovariectomised heifers given a PRID
ODB No. of Pre-treatment Mean concentration No. of hours Maximum decline in No. of hours to No. of hours for FSH to treatment heifers concentrations of FSH at nadir to reach FSH expressed as % of reach first FSH to return to pre-treatment
Žmg. Ž .n of FSH ngŽ rml. Žngrml. FSH nadir pre-treatment values rise following nadir concentrations
Controls
ab Ž .a a
0.0 3 95.9"16.96 102.9"13.1 0.0
Topical administration by intraÕaginal capsule
ab b ad b a a
5.0 4 110.4"13.45 81.5"11.3 24.0"4.2 26.6"6.9 30.0"14.9 46.5"16.92
ab b a b a a
10.0 5 97.5"12.70 78.6"10.1 24.0"3.8 18.9"6.2 33.6"13.3 57.6"15.13
Intramuscular injection in 2 ml corn oil
ab b a b a a
0.5 4 100.8"9.55 78.1"11.3 19.5"4.2 24.3"6.9 25.5"14.9 38.0"19.54
a b a b ac a
1.0 4 129.4"3.47 82.5"11.3 24.0"4.3 36.6"6.9 31.5"14.9 64.5"16.92
ab b ac b ad a
2.5 6 116.5"8.37 71.2"9.2 24.0"3.5 40.0"5.7 34.0"12.2 57.0"13.82
ab c b c b b
5.0 4 108.4"18.5 31.3"11.3 37.5"4.2 69.7"6.9 45.0"14.9 183.0"16.92
b c bcd c bcd b
10.0 4 75.2"14.11 22.3"13.1 34.0"4.9 69.5"8.1 104.0"17.2 168.0"19.54
a,b,c,d Ž .
Ž Ž . increased with higher dose of ODB injected, plasma E2s y0.237q16.109 dose y
Ž .2 2 .
0.74 dose , R s0.75; P-0.05 but not when given topically by the intravaginal route using the capsule. The peak plasma concentrations of E in heifers given 5- and2
10-mg injections were similar to each other, but were higher than in heifers assigned to
Ž .
all other treatments P-0.05 . Peak concentrations of E following use of the 5- and2 10-mg intravaginal capsules were similar to each other and to those following the 0.5
Ž .
mg injection P)0.05 , but were lower than concentrations in heifers given 1, 2.5, 5,
Ž . Ž .
and 10 mg ODB intramuscular P-0.05 Fig. 2 . The increase in plasma concentra-tions of E in animals following the 5- and 10-mg injecconcentra-tions were more prolonged and2 were slower to return to pre-treatment concentrations than in animals following all other
Ž .
treatments Table 1 .
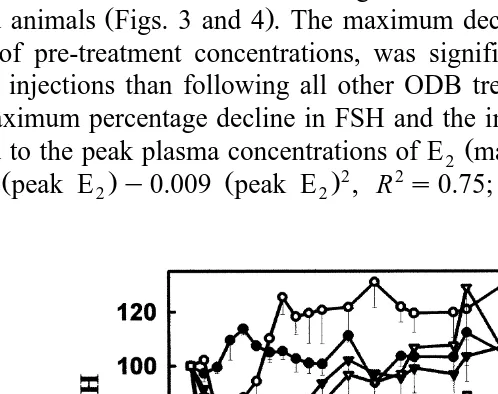
3.2. Plasma concentration of FSH
The effects of ODB administration on plasma concentrations of FSH are presented in Table 2. There was a significant decline in FSH concentrations following all ODB
Ž .
treatments compared with pre-treatment concentrations P-0.05 . The magnitude of the decline in FSH concentration was greater as blood concentration of E increased in2
Ž .
treated animals Figs. 3 and 4 . The maximum decline in FSH concentration expressed as % of pre-treatment concentrations, was significantly greater following the 5- and 10-mg injections than following all other ODB treatments. Across all treatments, both
Ž .
the maximum percentage decline in FSH and the interval h to reach that decline were Ž
related to the peak plasma concentrations of E2 maximum% decline in FSHs11.17q
Ž . Ž .2 2 . Ž
1.564 peak E2 y0.009 peak E2 , R s0.75; P-0.01 , hours to FSH nadirs
Ž .
Fig. 3. Effect of different doses 0, 0.5, 1, 2.5, 5, and 10 mg of ODB dissolved in 2 ml of corn oil and administered by intramuscular injection to ovariectomised heifers at the time of PRID insertion on % changes
Ž .
( ) M. O’Rourke et al.rAnimal Reproduction Science 59 2000 1–12
8
Ž
Fig. 4. Effect of different doses of ODB administered either by powdered form in a gelatine capsule 5- and
. Ž .
10-mg doses attached to PRID and two doses 0 and 0.5 mg dissolved in 2 ml of corn oil and administered by intramuscular injection to ovariectomised heifers at the time of PRID insertion on the % change in FSH in
Ž .
ovariectomised heifers ns3–4 heifers per dose .
Ž . Ž .2 2 .
10.628q1.486 hours to peak E2 y0.0282 hours to peak E2 , R s0.22; P-0.05 . Following nadir concentrations, FSH concentration increased as E2 concentration
de-Ž
Fig. 5. Effect of different doses of ODB administered either by powdered form in a gelatine capsule 10 mg
. Ž .
doses attached to PRID and two doses 1.0 and 10.0 dissolved in 2 ml of corn oil and administered by intramuscular injection to ovariectomised heifers at the time of PRID insertion on mean plasma concentrations
Ž . Ž . Ž .
clined from peak value, irrespective of treatment. However, at the higher injected doses, concentrations of FSH begin to rise again in the face of declining but still elevated
Ž .
plasma concentrations of E2 Fig. 5 . Concentrations of FSH following the 5- and 10-mg injections took significantly longer to return to pre-treatment concentrations than in
Ž .
animals assigned to all other treatments P-0.05 .
4. Discussion
This experiment clearly shows that the route of administration of ODB and the dose injected affect subsequent concentrations of E and FSH in blood. The concentration of2
E in blood was elevated faster following ODB administered via the intramuscular route2
when given in corn oil compared with topical vaginal application using a gelatine capsule attached to the PRID. When pooled, concentrations of E in animals given ODB2
topically on the vaginal epithelium by capsule, took over 10 h longer to reach maximum concentration than in heifers given a similar dose by intramuscular injection in oil. Peak concentrations in heifers were 20 times greater for the 5- and 10-mg injections than similar doses administered in powder form using the intravaginal capsule. While peak plasma concentration of E was not reached for a further 10 h in these heifers, some of2
the E may have been lost before it would have being absorbed, given that the gelatine2 capsule dissolves within 6 h. However, in the human, vaginal absorption of E2 in powder form had reached maximum 1 h following administration and overall declines in
Ž
plasma levels of FSH and LH were observed 5 h following treatment Schiff et al., .
1977 . This experiment demonstrates that there is more efficient absorption following intramuscular injection in oil than following intravaginal capsule administration of ODB
Ž . Ž .
in powder form. Smith and Tervit 1980 and Smith and McGowan 1982 have shown that to give similar oestrus response, a gelatine capsule containing four times more ODB than injection form is required. The rate of absorption of ODB from an oily solvent is slower and less acute than from drugs administered in aqueous solvents, but the rate of absorption is still much faster than that following topical administration by the intravagi-nal route. Hormones in solutions are absorbed more rapidly than when given in solid form, which explains part of the slower uptake following use of the intravaginal capsule, even though absorption occurs readily and rapidly when the intravaginal route is used. Retrograde loss of powdered hormones in vaginal secretions may also be a significant source of loss from the vagina.
The doses of ODB administered resulted in peak E2 concentrations spanning the
Ž . Ž .
range from luteal phase 0.3–1.0 pgrml , follicular phase 5–7 pgrml to the
phar-Ž . Ž .
macological range )10 pgrml Cooke et al., 1997 . Peak E2 increased in a dose-dependent manner with dose injected but not following intravaginal route used in this experiment. The rate of absorption following injection was similar to that reported
Ž .
by Bo et al., 1993 where peak concentrations were achieved within 1 day of administration. Once peak concentrations were reached, the rate of decline of E was2
in-( ) M. O’Rourke et al.rAnimal Reproduction Science 59 2000 1–12
10
Ž
cluded the administration of 10 mg ODB in oil by intramuscular injection, Macmillan .
and Peterson, 1993; Galvin, 1995 , which would elevate concentrations of E2 to pharmacological levels and result in slow return of E to basal cyclical values. While2
there is a dose-dependent elevation of E following intramuscular injection, the same is2
not true following administration by intravaginal capsule.
Concentrations of E2 achieved also depend on the derivative of E2 administered. E17b is the most potent naturally occurring form of E . On absorption, ODB is2
Ž .
immediately converted to E17b Hoffmann, 1984 and therefore is similar in potency. E valerate is a long acting form, which is slowly metabolised and hence is more potent2
than ODB. The peak concentrations of E achieved using ODB intramuscularly in oil2
Ž .
are lower than those achieved by Bo et al., 1993 using E valerate in oil. However, it2
Ž .
must be noted that Bo et al., 1993 used intact animals, which would have higher E2
concentrations than ovariectomised animals.
The data presented here clearly show that varying concentrations of E2 in blood transiently suppress FSH concentration in ovariectomised heifers given a PRID, and that the magnitude of the decline in FSH was affected by the peak concentrations of E2
Ž .
achieved. This agrees with other studies Price and Webb, 1988; Bo et al., 1994 in cattle, where E was administered in crystalline form in a subcutaneous implant to intact2
Ž .
heifers and in sesame oil to intact heifers, respectively. Wolfe et al., 1992 reported that concentrations of FSH were suppressed in a cuboidal manner following administration of E by subcutaneous implant to ovariectomised heifers. However, unlike this study,2
Ž .
lower doses 0.5–1 mg of E2 did not effect mean FSH concentrations. Bolt et al., Ž1990 has shown that 10 mg E17. b administered intramuscularly in 5 ml corn oil to norgestomet-treated ovariectomised heifers suppressed FSH for the entire sampling
Ž .
duration of 64 h. Similarly, Burke et al., 1996 , using ovariectomised cows, recorded maximal suppression of FSH within 24 h of the administration of ODB by intravaginal capsule with concentrations of FSH remaining suppressed for al least a further 4 days. However, this experiment shows that the duration of the suppression is much more transient and also dose-dependent and with E2 blood concentration of 80 pgrml in animals following 10 mg ODB intramuscularly in oil, the FSH suppression lasts considerably longer, viz. up to 150 h. This transient suppression contrasts with the
Ž .
findings of Schoenemann et al., 1985 where no suppression of FSH was found following administration of 17b-oestradiol intramuscularly in 2ml benzyl benzoate to
Ž .
ovariectomised progesterone-treated zebu cows. Di Gregorio and Nett 1995 altered the synthesis of gonadotrophins in the anterior pituitary by administering E and P to ewes.2 4
This is the first report to show an increase in FSH concentrations while concentrations
Ž . Ž
of E are still very high 45 pg2 rml , as shown in heifers given 10 mg ODB in oil Fig. .
5 . This demonstrates that E2 is only one part of the complex negative feedback mechanism involved in the control of FSH. It is clear that E2 is only one of the components produced by DFs that maintains FSH suppressed between successive new
Ž .
wave emergence Cooke et al., 1997; Stagg et al., 1998 . However, the relative roles of other follicular products such as inhibins, activins and follistatin, and that of local anterior pituitary products in the regulation of FSH are yet well delineated.
follicle wave dynamics in cattle at different physiological stages remains to be estab-lished. It was concluded that administration of ODB in oil by intramuscular injection Žbut not by administration topically in powder form results in a dose-dependent increase. in peak E concentrations. Increasing concentrations of E in plasma cause a dose-de-2 2
pendent transient suppression of FSH. Concentrations of FSH begin to increase 1–2 days after ODB administration while concentrations of E2 are declining but still elevated. In the ovariectomised heifer model given progesterone, E has only a transient2 suppressive effect on FSH concentrations.
Acknowledgements
The authors are grateful to Dr. M. Grealy, A. Glynn and N. Hynes for assistance with the hormone assays, J. Nally, P. Joyce, G. Morris and W. Connolly for technical support, G. Burke, G. McHugh, P. Creavan and P. Reilly for care of the animals, Sanofi
Ž .
France for providing the PRIDs. We acknowledge NIDDK Baltimore, MD for Ž
providing oFSH. This study was conducted by Teagasc Agriculture and Food Develop-.
ment Authority and under the Operational Programme for Agriculture, Rural Develop-Ž .
ment and Forestry, 1994–1999. Measure 5 b , Research Stimulus Fund. MO’R was a recipient of a Teagasc Walsh Fellowship.
References
Adams, G.P., Matteri, R.L., Kastelic, J.P., Ko, J.C.H., Ginther, O.J., 1992. Association between surges of follicle-stimulating hormone and the emergence of follicular waves in heifers. J. Reprod. Fertil. 94, 177–188.
Barnes, M.A., Kazmer, G.W., Bierley, S.T., 1990. Gonadotropic and ovarian response in dairy cows treated with norgestomet and estradiol valerate. Theriogenology 16, 13–25.
Bo, G.A., Adams, G.P., Caccia, M., Martinez, M., Pierson, R.A., Mapletoft, R.J., 1995. Ovarian follicular wave emergence after treatment with progestogen and estradiol in cattle. Anim. Reprod. Sci. 39, 193–204. Bo, G.A., Adams, G.P., Nasser, L.F., Pierson, R.A., Mapletoft, R.J., 1993. Effect of estradiol valerate on
ovarian follicular waves and circulating gonadotrophins in heifers. Theriogenology 40, 225–239. Bo, G.A., Adams, G.P., Pierson, R.A., Tribulo, H.E., Caccia, M., Mapletoft, R.J., 1994. Follicular wave
dynamics after estradiol-17btreatment of heifers with or without a progestogen implant. Theriogenology 41, 1555–1569.
Bolt, D.J., Scott, V., Kiracofe, G.H., 1990. Plasma LH and LH after estradiol, norgestomet and Gn-RH treatment in ovariectomized beef heifers. Anim. Reprod. Sci. 23, 263–271.
Burke, C.R., Macmillan, K.L., Boland, M.P., 1996. Oestradiol potentiates a prolonged progesterone-induced suppression of LH release in ovariectomised cows. Anim. Reprod. Sci. 45, 13–28.
Cooke, D.J., Crowe, M.A., Roche, J.F., 1997. Circulating FSH isoform patterns during recurrent increases in FSH throughout the oestrous cycle of heifers. J. Reprod. Fertil. 110, 339–345.
Crowe, M.A., Padmanabhan, V., Hynes, N., Sunderland, S.J., Enright, W.J., Beitins, I.Z., Roche, J.F., 1997. Validation of a sensitive radioimmunoassay to measure serum follicle-stimulating hormone in cattle: correlation with biological activity. Anim. Reprod. Sci. 48, 123–136.
Di Gregorio, G.B., Nett, T.M., 1995. Estradiol and progesterone influence the synthesis of gonadotropins in the absence of gonadotropin-releasing hormone in the ewe. Biol. Reprod. 53, 166–172.
( ) M. O’Rourke et al.rAnimal Reproduction Science 59 2000 1–12
12
Ginther, O.J., Kastelic, J.P., Knopf, L., 1989. Composition and characteristics of follicular waves during the bovine estrous cycle. Anim. Reprod. Sci. 20, 187–200.
Ginther, O.J., Kot, K., Kulick, L.J., Martin, S., Wiltbank, M.C., 1996a. Relationships between FSH and ovarian follicular waves during the last six months of pregnancy in cattle. J. Reprod. Fertil. 108, 271–279. Ginther, O.J., Wiltbank, M.C., Fricke, P.M., Gibbons, J.R., Kot, K., 1996b. Selection of the dominant follicle
in cattle. Biol. Reprod. 55, 1187–1194.
Hoffmann, B., 1984. Aspects on tolerance levels of anabolic agents with sex hormone like activities in edible
Ž .
animal tissue. In: Roche, J.F., O’Callaghan, D. Eds. , Manipulation of Growth in Farm Animals. Martinus Nijhoff Publishers for The Commission of the European Communities, pp. 17–32.
Kesner, J.S., Convey, E.M., 1982. Interaction of estradiol and luteinizing hormone releasing hormone on follicle stimulating hormone in cattle. J. Anim. Sci. 54, 817–821.
Ž .
Macmillan, K.L., Peterson, A.J., 1993. A new intravaginal progesterone releasing device for cattle CIDR-B for oestrous synchronisation, increasing pregnancy rates and the treatment of post-partum anoestrus. Anim. Reprod. Sci. 33, 1–25.
Mihm, M., Baguisi, A., Boland, M.P., Roche, J.F., 1994. Association between the duration of dominance of the ovulatory follicle and pregnancy rate in beef heifers. J. Reprod. Fertil. 10, 201–221.
Mihm, M., Good, T.E.M., Ireland, J.L.H., Ireland, J.J., Knight, P.G., Roche, J.F., 1997. Decline in serum follicle-stimulating hormone concentrations alters key intrafollicular growth factors involved in selection of the dominant follicle in heifers. Biol. Reprod. 57, 1328–1337.
Murphy, M.G., Boland, M.P., Roche, J.F., 1990. Pattern of follicular growth and resumption of ovarian activity in post-partum beef suckler cows. J. Reprod. Fertil. 90, 523–533.
Prendiville, D.J., Enright, W.J., Crowe, M.A., Finnerty, M., Hynes, N., Roche, J.F., 1995. Immunization of heifers against gonadotropin-releasing hormone: antibody titres, ovarian function, body growth and carcass characteristics. J. Anim. Sci. 73, 2382–2389.
Price, C.A., Webb, R., 1988. Steroid control of gonadotropin secretion and ovarian function in heifers. Endocrinology 122, 2222–2231.
Roche, J.F., Austin, E.J, Ryan, M., O’Rourke, M., Diskin, M.G., 1999. Regulation of follicles wave to
Ž .
maximise fertility in cattle. J. Reprod. Fertil., Suppl., in Press . SAS, 1989. 4th edn. SASrSTATw
User’s Guide Vol. 1 SAS institute, Cary NC, Version 6.
Savio, J.D., Boland, M.P., Hynes, N., Roche, J.F., 1990. Resumption of follicular activity in the early post-partum period of dairy cows. J. Reprod. Fertil. 88, 569–579.
Savio, J.D., Keenan, L., Boland, M.P., Roche, J.F., 1988. Pattern of growth of dominant follicles during the oestrous cycle of heifers. J. Reprod. Fertil. 83, 663–671.
Schiff, I., Tulchinsky, D., Ryan, K.J., 1977. Vaginal absorption of oestrone and 17beta-oestradiol. Fertil. Steril. 28, 1063–1066.
Schoenemann, H.M., Humphrey, W.D., Crowder, M.E., Nett, T.M., Reeves, J.J., 1985. Pituitary luteinizing hormone-releasing hormone receptors in ovariectomized cows after challenge with ovarian steroids. Biol. Reprod. 32, 574–583.
Sirois, J., Fortune, J.E., 1988. Ovarian follicular dynamics during the estrous cycle in heifers monitored by real time ultrasonography. Biol. Reprod. 39, 308–317.
Smith, J.F., McGowan, L.T., 1982. Oestrogen and the PRID. Proc. N.Z. Soc. Anim. Prod. 42, 87–89. Smith, J.F., Tervit, H.R., 1980. Successful development of a PRID regimen for oestrous synchronization in
New Zealand beef cattle. Proc. N.Z. Soc. Anim. Prod. 40, 272–279.
Stagg, K., Diskin, M.G., Sreenan, J.M., Roche, J.F., 1995. Follicular development in long-term anoestrous suckler cows fed two levels of energy postpartum. Anim. Reprod. Sci. 38, 49–61.
Stagg, K., Diskin, M.G., Sreenan, J.M., Roche, J.F., 1998. Effect of calf isolation on follicle wave dynamics, gonadotrophin secretion and metabolic hormone changes, interval to first ovulation in beef cows fed either of two energy levels postpartum. Biol. Reprod. 59, 777–783.
Sunderland, S.J., Crowe, M.A., Boland, M.P., Roche, J.F., Ireland, J.J., 1994. Selection, dominance and atresia of follicles during the oestrous cycle of heifers. J. Reprod. Fertil. 101, 547–555.