THE USE OF SAR INTERFEROMETRY FOR LANDSLIDE MAPPING IN THE INDIAN
HIMALAYAS
M. Vöge a, R. Frauenfelder b, *, K. Ekseth c, M.K. Arora d, A. Bhattacharya e, R.K. Bhasin f
a Norwegian Geotechnical Institute, P.O. box 3930 Ullevaal Stadion, 0806 Oslo, Norway – [email protected] b Norwegian Geotechnical Institute, P.O. box 3930 Ullevaal Stadion, 0806 Oslo, Norway – [email protected]
c Norwegian Geotechnical Institute, P.O. box 3930 Ullevaal Stadion, 0806 Oslo, Norway – [email protected] d Indian Institute of Technology, Roorkee-247667, Uttarakhand, India – [email protected]
e Indian Institute of Technology, Roorkee-247667, Uttarakhand, India; now at: Institute for Cartography, TU Dresden, 01069, Germany, AvH Postdoctoral Fellow – [email protected]
f Norwegian Geotechnical Institute, P.O. box 3930 Ullevaal Stadion, 0806 Oslo, Norway – [email protected]
KEY WORDS: Landslide monitoring, Indian Himalayas, InSAR, two-pass differential InSAR, SBAS, PSInSAR
ABSTRACT:
The aim of the here presented research was to investigate the potential of two-pass differential InSAR, and advanced DInSAR techniques, such as Small Baseline Subset (SBAS) and Persistent Scatterers (PS) interferometry, in order to detect and monitor the temporal behaviour of surface deformations in selected areas of the Garhwal and Kumaon Himalaya. We present results from the surroundings of the town of Nainital, from the Mansa Devi Hills area, and the areas around the cities of Chamoli Gopeshwar and Joshimath.
* Corresponding author
1. INTRODUCTION
Landslides are a large threat to the population of the Indian Himalayas and regularly endanger villages and vital transport axes. Landslide incidences have been of serious concern to the societies of the affected regions because of their potential to cause the loss of life, deteriorate natural resources, damage infrastructural facilities, etc. Naithani (1999) has estimated that damages caused by landslides in the Himalayan range cost, on average, more than one billion US dollar per year, besides causing more than 200 deaths every year. In the light of these numbers, it is evident that the monitoring of surface displacements and landslide movements becomes an important task. Traditionally, landslide hazard assessment had to be carried out on-site, relying on ground-based methods. Largely field-based approaches are often handicapped by high risk exposure, as well as observational biases towards objects in easily accessible areas. Observable target areas are local to maximally sub-regional. Due to the large number and extent of the landslide prone areas in the Himalayas ground-based methods are not suited for rapid detection and monitoring of hot-spot areas. Remote sensing approaches, on the other hand, enable objective, safe, and spatial continuous observations at different spatial scales, covering large areas.
In recent years, the availability of Interferometric Synthetic Aperture Radar (InSAR) data from an increasing number of satellite- and air-borne remote sensing sensors has gained momentum as a new technique for the monitoring of terrain deformations. Results from such space- or air-borne data yield displacement information at very high accuracies. A single acquisition geometry can provide displacement mappings for an area of approximately 100 km2. Even though monitoring of slow to very slow deformation rates is only possible if a considerably long time-series of images is available, InSAR derived displacement measurements are still applicable for
this purpose. As compared to many ground-based methods the method is also moderate in its costs, once the needed expertise has been established. With an increasing number of SAR satellites available, the coverage of the Earth's landmasses is improving, especially with ESA's Sentinel satellites, of which the first SAR-satellite (Sentinel-1A) was launched in April 2014 and the next one (Sentinel-1B) is scheduled to be launched in 2016.
The aim of the here presented research was to investigate the potential of DInSAR and especially of advanced DInSAR techniques, such as Small Baseline Subset (SBAS; cf. Berardino et al., 2002) and Persistent Scatterers (PS; cf. Ferretti et al., 2001; Colesanti et al. 2003; Colesanti and Wasowski 2006) interferometry, in order to estimate the temporal behaviour of land deformation due to earthquake and landslides in selected areas of the Garhwal and Kumaon Himalaya.
2. SITES AND DATA
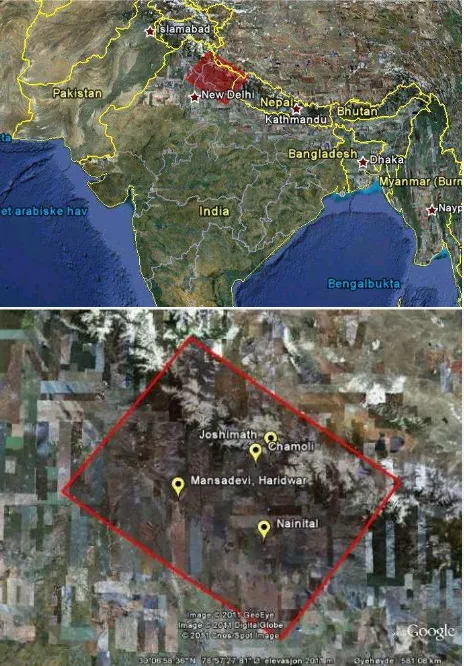
The Himalayan region is geo-dynamically very active. Being the youngest mountain system of the world, it constitutes a fragile ecosystem of unstable slopes giving rise to frequent geo-hazards including landslides. The problem is acute in certain regions of the Garhwal Himalayas in India. The study reported here focused on the following three landslide prone areas. Figure 1 shows the location of the three sites:
- The town of Nainital (Sher-ka-Danda landslide)
- The Mansa Devi Hills area (Haridwar)
Figure 1: Location of target areas. Background data: GoogleEarth.
Besides the monitoring of already identified landslides, such as the Sher-ka Danda and the Kandey landslide, the regional-scale detection and mapping of potentially non-discovered slope instabilities was the main goal of the here presented study. Once detected, newly identified slope instabilities can be investigated in more detail, e.g., by installing ground-based monitoring systems, in order to acquire more information about the geology and the kinematics of the identified landslide(s), thus contributing to the hazard awareness and, subsequently, risk management of an area.
2.1 Nainital Area
2.1.1 Site description: The town of Nainital (Figure 2) is an important regional centre in the lower Himalayas and attracts millions of tourists every year. Of particular interest in this area is the Sher-ka-Danda landslide. This landslide area is located within a highly populated mountain slope just above Nainital Lake. It presents a large threat to the populated areas at and around the lake. The slide area has been active for more than a century (with the earliest illustrated testimony from 1880, cf. Figure 3) and several medium-scale slides have already occurred in the past, some of them causing the loss of lives and severe damages.
The first known landslide had occurred in 1866, and in the year 1879 there was a larger one at the same spot, but "[…] the great slip occurred in the following year, on Saturday 18 September 1880." […] "Two days preceding the slip there was heavy rain,
[…] 20 inches (508 mm) to 35 inches (889 mm) fell during the 40 hours ending on Saturday morning, and the downpour still lasted and continued for hours after the slip. This heavy fall naturally brought down streams of water from the hill side, some endangering the Victoria Hotel, […] (which) was not the only building threatened […] Bell's shop, the Volunteer Orderly Room and the Hindu (Naina Devi) temple were scenes of labor with a view to diverting streams. At a quarter to two the landslip occurred burying those in and around the buildings mentioned above." […] "The total number of dead and missing were 108 Indian and 43 British nationals. The Assembly Rooms and the Naina Devi Temple were both destroyed in the disaster. A recreation area known as 'The Flats' was later built on the site and a new temple was also erected. To prevent further disasters, storm water drains were constructed and building bylaws were made stricter. (Battersby, 1887)
Figure 2: Satellite image showing Nainital Lake and the urbanized areas surrounding the lake. Background data:
GoogleEarth, imagery from 13th December 2010.
Figure 3: Historic photographs of the 1880 Nainital landslide. Source: Downloaded from http://en.wikipedia.org/wiki/
2.1.2 Available SAR-data: There were three image stacks of considerable size available for the Nainital area. For all image stacks, Nainital is located near the center of the footprint, which is ideal in terms of filter application during the interferometry workflows. One EnviSAT plus one ERS image stack were acquired in descending mode (both Track 248). An additional EnviSAT image stack was acquired in ascending mode (Track 12).
An important aspect for the quality of an image stack is the temporal distribution of the acquisitions of the stack. The images should be uniformly distributed in time and, ideally, there should be no large temporal gaps in the stack. For the ERS and EnviSAT satellites the revisit time (for an overpass with the same acquisition geometry) is about one month. As we were using historical/archived data, we could not expect image stacks of suitable length (15-20) with an image every month, however, we tried to avoid stacks with image gaps longer than one year.
The EnviSAT Track 12 stack has a 2-year data gap in 2006/2007. The longer continuous section in the stack is from 2008-2010 containing nine images. For both SBAS and PSInSAR this stack is too short to get reliable results. The ERS Track 248 stack has two data gaps, one in 1994/1995 and one in 1997, respectively. Although the longest continuous section contains 11 images, this was not regarded sufficient for PSInSAR and for SBAS it is considered hardly enough. Yet, this track proved to be the most promising image stack. In the period of 2008-2010, the stack contains 15 images.
2.2 Mansa Devi Hills Area (Haridwar)
2.2.1 Site description: The temple of Mansa Devi is located above the city of Haridwar (Figure 4). The study area has been affected by severe tectonic movement along the Bhimgoda Thrust, Ganga Tear Fault, and several minor faults located in its vicinity (Bartarya et al. 2007). The area is one of several landslide-prone areas in the Uttarakhand. The landslide area became active a decade ago and threatens the larger part of the city of Haridwar and a stretch of about 300 m of the Haridwar bypass road.
Figure 4: Overview over the town of Haridwar with the Mansa Devi temple northeast of the image centre (indicated by a yellow pin marker). Background data: GoogleEarth, imagery
from 19th September 2005.
Earlier studies showed that there are many small, as well as large landslides along the slopes of the Mansa Devi hill (Bhasin, R.K. pers. communication 2012). They pose a danger to the intensively built-up areas that have developed along the foothills and in adjoining areas on and around Mansa Devi hill, specifically along the Bhemgoda road, Haridwar.
2.2.2 Available SAR-data: A survey in the ESA archive showed that three image stacks of considerable size were available for the Mansa Devi hill area. All image stacks have the Mansa Devi hill area located near the centre of the footprint. One ERS and one EnviSAT image stack were acquired in descending mode (both Track 291). An additional ERS image stack was acquired in ascending mode (Track 12). The ERS Track 291 stack contains 28 images; however, it contains three data gaps of more than one year and, thus, its longest continuous section comprises 13 images only. This is slightly below the recommended limit of 15 images for SBAS and well below the min. 20 images required for PSInSAR. The ERS Track 55 stack contains only six images including a data gap in 1997. The EnviSAT Track 291 was the most promising image stack for Mansa Devi Hills. In the period of 2008-2010, the stack contains 22 images. This was regarded as sufficient for both SBAS and PSInSAR.
2.3 Chamoli Gopeshwar and Joshimath Area
2.3.1 Site description: Both the cities of Chamoli Gopeshwar as well as Joshimath are located in the north-eastern part of Uttarakhand state. The geographical extent of the study area is 600 km2. Chamoli is the second largest district of Uttarakhand and is important from a strategic point of view as it shares its northern boundary with Tibet (China). The three major towns within the study area are well connected by roads and are located along the route of frequented tourist destinations such as Badrinath, Joshimath and Kedarnath. The area is highly susceptible to landslides. During the monsoon season, many of these landslides get re-initiated due to heavy rains. Sometimes, the slides cause the loss of life and property, and they frequently lead to the closing of the road network for many days. Among these landslides, a few landslides – such as the Kandey landslide – are big and have a long history.
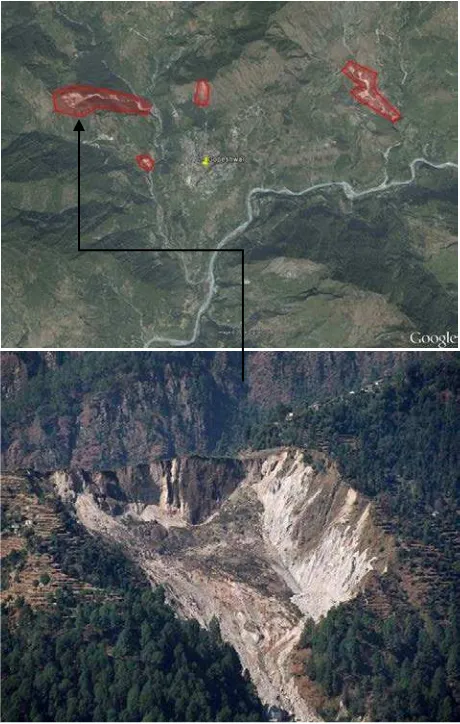
Figure 5 shows the Kandey landslide and some smaller landslides nearby the city of Chamoli Gopeshwar. This landslide has a history of more than 70 years and is reported as active in recently conducted studies (e.g., SafeLand, 2010). The Kandey landslide is mostly active during the monsoon season. It is a debris slide with an extent of approximately 310 x 380 m. The strong topography in this area is not only one of the causes for the frequent occurrence of landslides, it is also very challenging for the use of SAR interferometry, especially since the vegetation reaches all the way up to the mountaintops.
PSInSAR processing. The EnviSAT Track 248 stack contains 27 images, however, has two large gaps. This leaves a longest continuous section of 16 images. The remaining two stacks have both a longest continuous section of 12 images and were thus not processed.
Figure 5: Upper panel: Location of the Kandey landslide and some smaller landslides near Chamoli Gopeshwar highlighted
on GoogleEarth (imagery from 10th May 2006); lower panel: photograph of the release area of the Kandey landslide. Source
of photography: IIT- Roorkee.
3. PROCESSING RESULTS
The interferometric processing was carried out using the SARscape software package (version 5.0); both its SBAS and the PSInSAR workflow were applied.
3.1 Nainital Area
3.1.1 SBAS Processing: The first step in the SBAS (Small BAseline Subset) Algorithm is to identify image pairs with a small temporal and spatial baseline. For the EnviSAT satellite, the critical spatial baseline is approx. 1000 m. In order to only select image pairs that potentially have good coherence, we generally set a spatial normal baseline limit of about 400 m, thus 40% of the critical base line. The temporal baseline was set to 360 days. For the correction of topographic effects, we initially used the Shuttle Radar Topography Mission (SRTM;
cf. http://www2.jpl.nasa.gov/srtm/) digital elevation model with a ground spatial resolution of 3 arc-seconds (i.e., approximately 90 m). Later-on, we also had access to the Cartosat-1 derived "CartoDEM" with 30 x 25 m cell resolution (https://data.gov.in/ key words/cartodem).
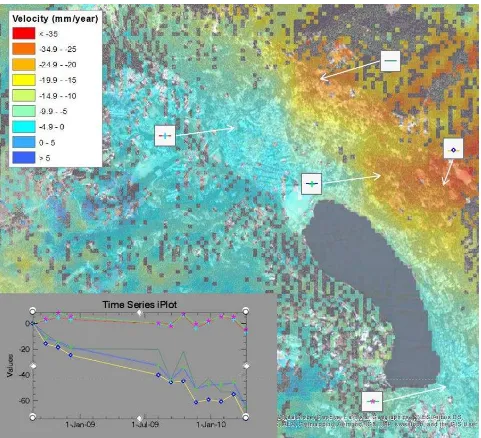
Figure 7 (next page) shows the mean velocity map around Nainital Lake resulting from an SBAS analysis of EnviSAT Track 248 image stack (Aug. 2008 to Aug. 2010). The map shows a good amount of coherent pixels around the lake. Most of the coherent areas show a mean velocity of -2.5 to +1.5 mm/year and are, thus, considered as stable. Along the mountain slopes northeast of the lake, however, we can identify a large area of deformation. Deformation rates reach up to over -35 mm/year.
3.1.2 PS-InSAR Processing: The idea behind PS-InSAR is to discern coherent radar signals from incoherent contributions in order to obtain only those observations which are physically interpretable. Atmospheric phase contributions are spatially correlated within a single SAR scene, but tend to be uncorrelated on time scales of days to weeks. Conversely, surface motion is usually strongly correlated in time. Radar scatterers that are only slightly affected by temporal and geometrical decorrelation are used, allowing exploitation of all available images regardless of imaging geometry. In this sense the scatterers are “permanent”, i.e., persistent over many satellite revolutions (after Ferretti et al., 2001).
The EnviSAT 248 image stack was also processed with the PSInSAR technique. In general, PSInSAR performs better in urban and nearby areas, where the number of small but strong (persistent) scatterers is higher than in natural terrain. Thus, in general, we expected to obtain better results for the city of Nainital as compared to the SBAS algorithm. However, as the EnviSAT 248 image stack only contains 15 images from 2008-2010, there were hardly enough images for a successful PSInSAR processing. Figure 6 shows the mean velocity map of the Nainital area based on PSInSAR processing.
Figure 6: Mean velocity map for the EnviSAT Track 248 image stack for Nainital processed with PSInSAR. Background data:
Esri, DigitalGlobe, GeoEye, i-cubed, USDA, USGS, AEX, Getmapping, Aerogrid, IGN, IGP, swisstopo and the GIS User
Figure 7: Mean velocity map for the EnviSAT Track 248 image stack for Nainital processed with SBAS. Background data: Esri, DigitalGlobe, GeoEye, i-cubed, USDA, USGS, AEX, Getmapping, Aerogrid, IGN, IGP, swisstopo and the GIS User Community.
Insert: Time series from August 2008 to August 2010.
The digital elevation model applied here is the SRTM. As expected, the PS density is higher over the city of Nainital and along the urbanized eastern bank of Nainital Lake. The velocities over the built-up area are relatively consistent and vary between -2.5 and +2.5 mm/year. Outside the urban areas, the PS density is poor and most of the identified PS have to be regarded as noise. Therefore, and in contrast to the SBAS results, no clear deformation pattern is identifiable in the slopes above the cities.
3.2 Mansa Devi Hills (Haridwar) Area
3.2.1 SBAS Processing: Since we were mostly interested in the rural Mansa Devi Hills area, we first applied the SBAS method using the ERS Track 291 image stack. Despite for the large data gap in 1994-1995 we used all 23 images from 1992-1999. The digital elevation model used for reducing topographic effects was the CartoDEM.
Figure 8: Mean velocity map for the Mansa Devi hill area (and the town of Haridwar) using the EnviSAT Track 291 image stack processed with SARscape's SBAS workflow. Background data: Esri, DigitalGlobe, GeoEye, i-cubed, USDA, USGS, AEX,
Getmapping, Aerogrid, IGN, IGP, swisstopo and the GIS User Community.
3.3 Chamoli Gopeshwar and Joshimath Area
3.3.1 SBAS Processing: Processing the data over Chamoli Gopeshwar and Joshimath was challenging. The only suitable image stack was the EnviSAT (Track 12) image stack. At first, the SBAS algorithm was applied, which in principle is optimised for distributed scattering mechanisms where several adjacent cells represent the same physical deformation phenomenon. The algorithm failed to produce reliable results when using the SRTM DEM. In a second step, processing was, therefore, done using the CartoDEM. Yet, even using the better DEM, none of the processing results were satisfactory. Coherence was generally low and coherent areas were small and blotchy. We see the main cause for this in the rough topography of the area and the lush vegetation, which in combination posed too big of a challenge for the algorithm. In addition, the southeast facing slopes were strongly affected by foreshortening effects, thus not yielding any results.
3.3.2 PSInSAR processing: The PSInSAR technique was applied for a focus area at the Kandey landslide. An initial set of persistent scatterer (PS) candidates were identified after normalization of the amplitudes using the amplitude dispersion index (Ferretti et al., 2001). Among those candidates, the final PS were selected using coherence information. This yielded a persistent scatterer density of approximately 45 PS/km2. Figure 9 shows the mean displacement velocity of the persistent scatterers identified at the Kandey landslide. The illustrations shows that persistent scatterers outside the landslide area show no or only small displacements. Persistent scatterers which are located at the main body of the slide area and in its lower part (where it discharges into the debris flow channel) show negative displacements. Maximal displacement values for a period of four years was to -320 mm (which corresponds to 80 mm/year if one assumes a uniformly continuing deformation).
Figure 9: Mean displacement velocity of identified persistent scatterers in LOS direction (in mm/year) superimposed on a GoogleEarth image. Note the inversed colour scale as compared
to Figures 6-8.
4. DISCUSSION
Here we report about attempts to detect and monitor slow moving landslides in three selected regions of the Indian Himalayas using SAR interferometry technique. An extensive amount of SAR imagery had been acquired from the ESA archives and different InSAR processing approaches have been applied. Three factors were most challenging for the interferometric processing: a) the strong topography in the Himalayan mountain range: particularly the PSInSAR workflow had been strongly affected and was generally only able to provide displacement estimates where topography was moderate. b) The strong vegetation: the subtropical climate and the resulting dense vegetation caused decorrelation in most non-urban areas, and c) the available image stacks in the ESA archive were mostly too short. Especially for the PSInSAR workflow most of the stacks did not fulfill the minimum requirement of about 20 images. Additionally, most of the stacks contain rather large data gaps.
Despite these challenges, we were able to achieve conclusive results for the town of Nainital, for the Mansa Devi Hills area, and for the Kandey slide in Chamoli. For the Joshimath area, the processing failed and no coherent results could be obtained.
In Nainital an area with considerable ground deformation could be identified and confined with the help of the SBAS workflow. The results allow displacement estimations along most of the relevant mountain slopes northeast of the Lake, where a clear and rather large deformation area could be identified with an average deformation rate of about 20 mm/year (Figure 7).
For areas further away from the urbanized region a conclusion about the existence of creeping landslides cannot be made, due to the lack of coverage from both techniques.
Using two-pass DInSAR, local displacements could be mapped at the Kandey landslide. The result clearly show the debris continue to settle along the landslide scar. The time series analysis (not shown here) imply an approximately linear displacement curve for three selected persistent scatterers. This suggests that the displacement continued beyond the observation period of 2006.
5. CONCLUSIONS
In order to improve the displacement maps we have to look at the three major challenges pointed out above. While the problem of the strong vegetation cannot be improved or solved for obvious reasons, new data sources will allow to improve the processing with respect to the remaining two challenges. Instead of solely relying on archived data new interferometric SAR image stacks could be acquired. Currently, the best operational satellite for non-military purposes is the German TerraSAR-X satellite. Flying in formation with the identical Tandem-X TerraSAR-X allows a very short revisit time of 11 days. Thus, even for the PSInSAR workflow image stacks of suitable size can be acquired in less than a year. Furthermore, TerraSAR-X provides a spatial resolution of 1 m in its spotlight mode. This resolution will improve the identification of persistent scatterers considerably and will help to improve the coherence in the SBAS workflow.
ACKNOWLEDGEMENTS
We would like to thank the Department of Science and Technology (DST) at the Ministry of Science and Technology, Government of India for supporting this bilateral programme. We would also like to thank the staff at sarmap SA for their support with the SARscape software, as well as for their help with one of the early processing of the Nainital data. The ERS-1/-2 and EnviSAT data has kindly been provided by the European Space Agency.
REFERENCES
Bartarya, S.K., Mazari, R.K., and Virdi, N.S., 2007. Bhimgoda slide of August 24, 1994 in the Siwalik rocks near Haridwar: a success story of landslide control measures. Natural Hazards. Special Publication of Indian Geological Congress, Varma, O.P., Mahajan, A.K., and Vikram Gupta (Eds.), 155–167.
Battersby, H.S., 1899. “Home Lyrics”, Toronto, Hunter, Rose & Co. In the public domain. Available on Project Gutenberg; Cited from URL: http://en.wikipedia.org/ wiki/Nainital)
Berardino, P., Fornaro, G., Lanari, R., and Sansosti E., 2002. A new algorithm for surface deformation monitoring based on small baseline differential SAR interferograms. IEEE Trans. Geosciences and Remote Sensing, 40, 2375– 2383.
Colesanti, C., Ferretti, A., Prati, C., and Rocca, F., 2003. Monitoring landslides and tectonic motions with Permanent Scatterers Technique. Engineering Geology, 68, 3–14.
Colesanti, C. and Wasowski, J., 2006. Investigating landslides with space-borne synthetic aperture radar (SAR) interferometry. Eng. Geology 88: 173–199.
Ferretti, A., Prati, C., and Rocca, F., 2001. Permanent scatterers in SAR interferometry”, IEEE Transactions on Geoscience and Remote Sensing, 39, pp 8–20.
Naithani, A.K., 1999. The Himalayan Landslides. Employment News, XXIII (47), 20-26 Feb., pp. 1–2.