CIRRUS REMOVAL IN MULTISPECTRAL DATA WITHOUT 1.38
µ
M SPECTRAL DATA
Aliaksei Makarau, Rudolf Richter, Viktoria Zekoll, and Peter Reinartz
German Aerospace Center, Earth Observation Center, Oberpfaffenhofen, 82234 Wessling, Germany
{aliaksei.makarau, rudolf.richter, viktoria.zekoll, peter.reinartz}@dlr.de
Commission VII, WG VII/3
KEY WORDS: Cirrus removal, haze removal, multispectral data, Landsat 8 OLI, Sentinel-2
ABSTRACT:
Cirrus is one of the most common artifacts in the remotely sensed optical data. Contrary to the low altitude (1-3 km) cloud the cirrus cloud (8-20 km) is semitransparent and the extinction (cirrus influence) of the upward reflected solar radiance can be compensated. The widely employed and almost ’de-facto’ method for cirrus compensation is based on the 1.38µm spectral channel measuring the upwelling radiance reflected by the cirrus cloud. The knowledge on the cirrus spatial distribution allows to estimate the per spectral channel cirrus attenuation and to compensate the spectral channels. A wide range of existing and expected sensors have no 1.38µm spectral channel. These sensors data can be corrected by the recently developed haze/cirrus removal method. The additive model of the estimated cirrus thickness map (CTM) is applicable for cirrus-conditioned extinction compensation. Numeric and statistic evaluation of the CTM-based cirrus removal on more than 80 Landsat-8 OLI and 30 Sentinel-2 scenes demonstrates a close agreement with the 1.38µm channel based cirrus removal.
1. INTRODUCTION
The mean estimate of the global cirrus distribution is 16.7% (Sassen et al., 2008) and the maximum value obtained is over 50% (Hei-dinger and Pavolonis, 2005, Chepfer et al., 2000). Such a high ex-pectation rate of cirrus in the atmosphere defines a relatively high probability of cirrus in remotely sensed optical data. The radi-ance extinction conditioned by cirrus has an important property: the surface reflected solar radiance is partly attenuated leaving an opportunity to be restored. The 1.38µm spectral channel in a mul-tispectral instrument design gives an opportunity to estimate the thickness distribution of cirrus cloud and to restore the upwelling reflected radiance for semitransparent cirrus. The state-of-the art methods for cirrus correction employ the 1.38µm spectral chan-nel for the restoration (B. C. Gao et al., 2002, Gao et al., 2004, Richter et al., 2011).
The absence of the 1.38µm cirrus channel in a huge set of ex-isting and planned multi/hyperspectral sensors requires a correc-tion method independent of the cirrus channel. In this paper we demonstrate cirrus removal by the method for haze/cirrus com-pensation (Makarau et al., 2014). Instead of the haze thickness map (HTM) the Cirrus Thickness Map (CTM) can be calculated for semi-transparent cirrus cloud and spatially varying cirrus thick-ness. The spatial and spectral cirrus distribution is estimated and the multispectral data are restored with the use of the additive model. Cirrus map and cirrus corrected (decirrus) data are em-ployed as the reference. The accuracy of cirrus correction is nu-merically and statistically evaluated.
2. METHOD
We use an additive model to calculate the cirrus influence:
Lsensor=L0+CR, (1)
whereLsensoris the acquired radiance,L
0is the sum of path ra-diance and surface reflected rara-diance, andCRis the cirrus con-tribution. In terms of a sensor acquired digital number (DN) (a
linear model of the DN to radiance conversion) Eq.1 can be writ-ten as
DNsensor
i (x, y) =DNi(x, y) +CR′i(x, y), (2)
where(x, y)are the pixel coordinates in an image,iis the spec-tral channel number,DNsensor
i (x, y)is the acquired DN, and
DNi(x, y)is the DN without the attenuation by cirrus. The term
CR′
i(x, y)is dependent on the cirrus thickness and defined as cir-rus thickness mapCT Mi(x, y). In this paper the cirrus thickness is defined in the range of the spectral channel radiance or the DN. The subtraction of theCT Mallows to restore the data.
2.1 Spatial Cirrus Thickness
TheCT Mthickness is estimated by searching for (non-overlapping windoww×w) dark pixels in a channel with a minimal ground reflectance and a maximal attenuation by cirrus. A blue band in the region 0.37-0.49µm is most suitable. TheCT M estimate given a single channel leads to an overcorrection of this channel. This is overcome by a new synthetic spectral channel creation (linear extrapolation is used):
Bex(x, y) =EXT RAP OL(Bm(x, y), Bn(x, y)), (3)
whereBex(x, y)is the extrapolated spectral channel,Bm(x, y) andBn(x, y)are two blue/green spectral channels from the data. TheCT M(x, y)estimate given a lower wavelengthBexis more precise since surface reflectance is less and cirrus thickness is higher. Large surface areas with a high albedo make the selection of dark pixels difficult using a small window. This area is labeled by a segmentation method and excluded from the search.
2.2 Spectral Cirrus Thickness
Cirrus thickness in terms of sensor measured radiance usually de-creases from the shortest to the longest wavelength. Subtraction ISPRS Annals of the Photogrammetry, Remote Sensing and Spatial Information Sciences, Volume III-7, 2016
XXIII ISPRS Congress, 12–19 July 2016, Prague, Czech Republic
This contribution has been peer-reviewed. The double-blind peer-review was conducted on the basis of the full paper.
of a constantCT M(x, y)from all the channels leads to a loss of spectral consistency. A channel-specificCT Mi(x, y)is calcu-lated and the slope (ki) of the linear regression with the dependent
CT Mi(x, y)versus the independentCT M(x, y)(calculated us-ing theBex) is stored inki. Thekicoefficient is used to scale the CTM. The regression is calculated using the pixel values in the cirrus regions:
ki=SLOP E(CT M(x, y), CT Mi(x, y)), (4)
wherekiis the slope of the fitted line for bandi,Kis the array of the coefficients (ki∈K).
2.3 Cirrus correction and Clear Scene Aerosol Compensa-tion
A subtraction of theCT M(x, y)∗kifrom the bandDNisensor(x, y) recovers the decirrus band:
DNi(x, y) =DNisensor(x, y)−CT M(x, y)∗ki, ki∈K (5)
The subtraction removes the cirrus along with possibly a fraction of the clear scene aerosol thickness and the data should be com-pensated for the clear scene aerosol fraction.CT M(x, y)pixels outside cirrus contain values of the clear scene aerosol thickness (the aerosol thickness is also calculated in cirrus-free areas). A compensation for the aerosol thickness is performed:
DN′
i =DNi+ABS(M EAN(DNisensor[no cirrus])−
M EAN(DNi[no cirrus])). (6)
where thecirrusandno cirrusare cirrus and non cirrus pixels, respectively.
3. NUMERIC EVALUATION
The data restored by the 1.38µm band decirrus method is em-ployed as the reference. A small error in this restoration always exists originating from the methodology and the extincted ra-diance which can never be restored with 100% accuracy. The same error assumptions are valid for the proposed CTM method. The experiments were carried on a database of Landsat-8 and Sentinel-2 scenes, in total more than 120 scenes. We demonstrate restoration results for one Landsat-8 and one Sentinel-2 scenes.
The numeric evaluation is expected to show a small difference between the 1.38µm band decirrus method and the CTM to prove the hypothesis that the CTM restores the data with a comparable accuracy. The evaluation employs the absolute difference his-togram (the hishis-togram of the 1.38µm method and the CTM de-cirrus results difference), the relative difference histogram (the histogram of the two decirrus results difference divided by the reference result), the restored data histograms, and spectrum pro-file taken in a pixel in a selected cirrus restored area. Cirrus maps and the RGB compositions (subscenes) are presented for a visual interpretation.
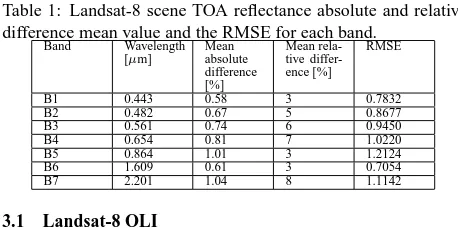
Table 1: Landsat-8 scene TOA reflectance absolute and relative difference mean value and the RMSE for each band.
Band Wavelength
B1 0.443 0.58 3 0.7832
B2 0.482 0.67 5 0.8677
B3 0.561 0.74 6 0.9450
B4 0.654 0.81 7 1.0220
B5 0.864 1.01 3 1.2124
B6 1.609 0.61 3 0.7054
B7 2.201 1.04 8 1.1142
3.1 Landsat-8 OLI
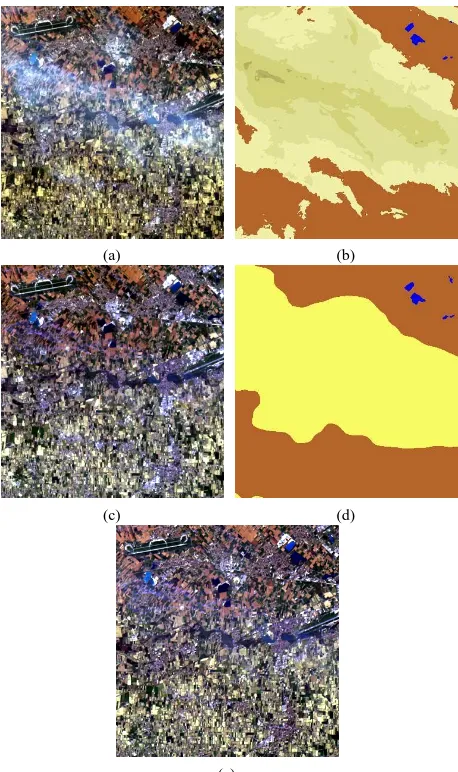
The Landsat-8 scene ID LC81920282014090LGN00 was acquired on the 31 March 2014 at 09:58:35 UTC. Figures 1 b) and d) show cirrus map detected by both methods. Brown color labels clear land, blue - water. The cirrus map (yellow tones) in Figure 1 b) demonstrates four types of cirrus depending on the cirrus thick-ness: thin, medium, thick cirrus, and cirrus cloud. Yellow color in Figure 1 d) labels cirrus detected by the CTM method. The maps of cirrus are very similar. Visual interpretation of the two decirrus methods (Figures 1 c), e)) demonstrates similarity without differ-ences or processing artifacts. Both methods have compensated the cirrus area with no over- or undercorrection.
Figure 2 a) demonstrates histogram agreement of the restored top of atmosphere (TOA) reflectance in Band 3. The histogram shows absolute differences up to approx. 3% (Figure 2 b)) with the mean difference value 0.75% (Table 1). The relative difference peak value is 6% demonstrating a small difference for this mea-sure (Figure 2 c) and Table 1). The spectra collected in the cirrus area (Figure 3) demonstrate spectral consistency for the 1.38µm and the CTM decirrus methods. The CTM method compensates slightly less cirrus in the 1.6 and 2.2µm band. This is an ex-pected behaviour since the extinction in these bands is primarily conditioned by absorption and less by scattering. Generally, the 1.38µm based decirrus method performs with slightly less accu-racy in the atmospheric absorption regions (e.g. in the 0.94 and 1.38µm) compared to the visible and near infrared (Richter et al., 2011) and these bands are omitted. Mean values of the ab-solute and relative difference as well as the root mean squared error (RMSE) calculated for each band are presented in Table 1 demonstrating that only a small difference exists between both methods. The numeric measures as well as the histograms were calculated on the original full size Landsat-8 scene.
3.2 Sentinel-2
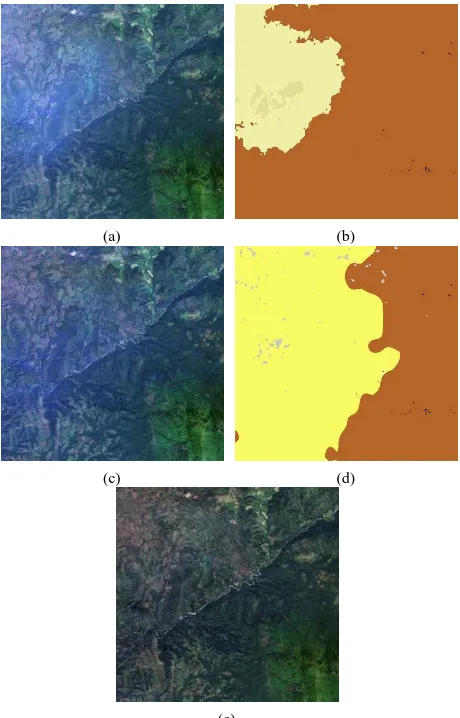
The numeric assessment for the Sentinel-2 scene is in the trend with the results for the Landsat-8 data. The Sentinel-2 scene ID S2A OPER MSI L1C TL MTI 20151112T100721 A002034 T36PZS was acquired on the 12 November 2015 at 10:07:21 UTM. Figures 4 b) and d) illustrate estimated cirrus map (yel-low) with a slight underestimation in the 1.38µm based decir-rus method. A visual analysis of the two decirdecir-rus methods (Fig-ures 4 c), e)) reveals a slight cirrus undercorrection in Figure 4 c) (1.38µm based decirrus) compared to 4 e) (CTM decirrus). This undercorrection can be partly attributed to the underestimation of the cirrus area (compare cirrus maps in Figures 4 b) and d)). The histogram in Figure 5 a) demonstrates the mean shift for the de-cirrus results up to 1% and Table 2 demonstrates the mean shift equal to 0.56%. The peak absolute difference for the two decirrus results is up to 2.5% (Figure 5 b)). The mean relative difference value is 8% (Table 2, also Figure 5 c)) and this value is low. Fig-ure 6 again demonstrates a spectral consistency for the 1.38µm and CTM decirrus. As in the Landsat-8 case the 1.38µm based decirrus compensates slightly more in the shortwave infrared 1.6 and 2.2µm bands which is expected.
ISPRS Annals of the Photogrammetry, Remote Sensing and Spatial Information Sciences, Volume III-7, 2016 XXIII ISPRS Congress, 12–19 July 2016, Prague, Czech Republic
This contribution has been peer-reviewed. The double-blind peer-review was conducted on the basis of the full paper.
(a) (b)
(c) (d)
(e)
Figure 1: Cirrus removal in the Landsat-8 data (subscene): a) the original (RGB composite), b) the 1.38µm based decirrus map, c) the 1.38µm based decirrus, d) the CTM cirrus map, e) the CTM decirrus.
(a) (b)
(c)
Figure 2: The Landsat-8 1.38µm and the CTM decirrus results (Band 3 TOA reflectance): a) histograms, b) difference his-togram, c) relative difference histogram.
Figure 3: Spectra profiles collected in a cirrus area (no symbol: original;+: 1.38µm;⋄: CTM)
Table 2: Sentinel-2 absolute and relative difference TOA re-flectance mean value and the RMSE for each band.
Band Wavelength [µm] Meanabsolute
difference [%]
Mean rela-tive differ-ence [%]
RMSE
B1 0.444 0.49 4 0.6243
B2 0.496 0.54 6 0.6690
B3 0.560 0.56 8 0.6931
B4 0.664 0.56 10 0.6985
B5 0.704 1.15 14 1.1928
B6 0.740 1.29 8 1.3353
B7 0.782 1.30 6 1.3440
B8 0.835 1.30 6 1.3413
B8a 0.865 1.30 5 1.3411
B11 1.614 0.51 3 0.5419
B12 2.202 0.58 7 0.6069
Table 2 demonstrates the Sentinel-2 scene per band evaluation. Low mean absolute and relative difference values together with a low RMSE demonstrate a close agreement for the two decirrus methods.
4. CONCLUDING REMARKS
A new method for cirrus removal without the use of the 1.38µm band data has been developed. The method is based on the cal-culation of the cirrus thickness map and named as the CTM. The method restores the data with spectral consistency and demon-strates a small difference to the standard 1.38µm decirrus method. The developed method is fast, parameter free, and was success-fully tested on a large set of Landsat-8 and Sentinel-2 data. It should be noted that an overcorrection in the 1.38µm based derus method can appear especially in case of moderately thick cir-rus (circir-rus band reflectance higher 2.5%). The presented numeric evaluation demonstrates that there is no over-/under-correction in the CTM method. In case of an absolutely intransparent cirrus none of the decirrus methods can restore the data since only a negligibly small fraction of direct radiance pass throug the in-transparent cirrus cloud. The method is implemented in the AT-COR software (ATAT-COR, Atmospheric / Topographic Correction for Satellite Imagery. ReSe Applications Schl¨apfer, Langeggweg 3, CH-9500 Wil, Switzerland, n.d.) and can run in a fully auto-matic batch mode.
REFERENCES
ATCOR, Atmospheric / Topographic Correction for Satellite Im-agery. ReSe Applications Schl¨apfer, Langeggweg 3, CH-9500 Wil, Switzerland, n.d.
B. C. Gao, P. Y., Han, W., Li, R. and Wiscombe, W., 2002. An algorithm using visible and 1.38µmchannels to retrieve cirrus cloud reflectances from aircraft and satellite data. IEEE TGRS 40(8), pp. 1659–1668.
ISPRS Annals of the Photogrammetry, Remote Sensing and Spatial Information Sciences, Volume III-7, 2016 XXIII ISPRS Congress, 12–19 July 2016, Prague, Czech Republic
This contribution has been peer-reviewed. The double-blind peer-review was conducted on the basis of the full paper.
(a) (b)
(c) (d)
(e)
Figure 4: Cirrus removal in the Sentinel-2 data (subscene): a) the original (RGB composite), b) the 1.38µm based decirrus map, c) the 1.38µm based decirrus, d) the CTM cirrus map, e) the CTM decirrus.
(a) (b)
(c)
Figure 5: The Sentinel-2 1.38µm and the CTM decirrus re-sults (Band 3 TOA reflectance): a) histograms, b) difference his-togram, c) relative difference histogram.
Chepfer, H., Goloub, P., Shinhirne, J., Flamant, P. H., Lavorato, M., Sauvage, L., Brogniez, G., and Pelon, J., 2000. Cirrus cloud properties derived from polder-1/adeos polarized radiances: first
Figure 6: Spectra profiles collected in a cirrus area (no symbol: original;+: 1.38µm;⋄: CTM)
validation using a ground-based lidar network. Journal of Ap-plied Meteorology 39, pp. 154–168.
Gao, B.-C., Montes, M. J. and Davis, C. O., 2004. Refinement of wavelength calibrations of hyperspectral imaging data using a spectrum-matching technique. Remote Sensing of Environment 90, pp. 424–433.
Heidinger, A. and Pavolonis, M., 2005. Global daytime distribu-tion of overlapping cirrus cloud from noaa’s advanced very high resolution radiometer. Climate 18, pp. 4772–4784.
Makarau, A., Richter, R., Muller, R. and Reinartz, P., 2014. Haze detection and removal in remotely sensed multispectral imagery. IEEE Transactions on Geoscience and Remote Sensing 52(9), pp. 5895–5905.
Richter, R., Wang, X., Bachmann, M., and Schl¨apfer, D., 2011. Correction of cirrus effects in sentinel-2 type of imagery. Int. J. Remote Sensing 32(10), pp. 2931–2941.
Sassen, K., Wang, Z. and Liu, D., 2008. Global distribution of cirrus clouds from cloudsat/cloud-aerosol lidar and infrared pathfinder satellite observations (calipso) measurements. Journal of Geophysical Research: Atmospheres 113(D8), pp. n/a–n/a. ISPRS Annals of the Photogrammetry, Remote Sensing and Spatial Information Sciences, Volume III-7, 2016
XXIII ISPRS Congress, 12–19 July 2016, Prague, Czech Republic
This contribution has been peer-reviewed. The double-blind peer-review was conducted on the basis of the full paper.