URBAN TREE CLASSIFICATION USING FULL-WAVEFORM AIRBORNE LASER
SCANNING
Zs. Koma a, K.Koenig b, B. Höfle b
aDepartment of Geophysics and Space Science, Eötvös Loránd University–[email protected]
bInstitute of Geography, GIScience, LiDAR Research Group (LRG), Heidelberg University – (k.koenig, hoefle)@uni-heidelberg.de
Commission III, WG III/2
KEY WORDS: Airborne Laser Scanning, Urban Environment, Classification, Tree, Object-based, Radiometric and Geometric
Features
ABSTRACT:
Vegetation mapping in urban environments plays an important role in biological research and urban management. Airborne laser scanning provides detailed 3D geodata, which allows to classify single trees into different taxa. Until now, research dealing with tree classification focused on forest environments. This study investigates the object-based classification of urban trees at taxonomic family level, using full-waveform airborne laser scanning data captured in the city centre of Vienna (Austria). The data set is characterised by a variety of taxa, including deciduous trees (beeches, mallows, plane trees and soapberries) and the coniferous pine species. A workflow for tree object classification is presented using geometric and radiometric features. The derived features are related to point density, crown shape and radiometric characteristics. For the derivation of crown features, a prior detection of the crown base is performed. The effects of interfering objects (e.g. fences and cars which are typical in urban areas) on the feature characteristics and the subsequent classification accuracy are investigated. The applicability of the features is evaluated by Random Forest classification and exploratory analysis. The most reliable classification is achieved by using the combination of geometric and radiometric features, resulting in 87.5% overall accuracy. By using radiometric features only, a reliable classification with accuracy of 86.3% can be achieved. The influence of interfering objects on feature characteristics is identified, in particular for the radiometric features. The results indicate the potential of using radiometric features in urban tree classification and show its limitations due to anthropogenic influences at the same time.
1. INTRODUCTION
Mapping and characterizing vegetation and in particular single trees is important in forestry and urban management. Research on vegetation is expanding due to an increasing need to quantify vegetation characteristics and to model environmental dynamics (Vanden Borre et al., 2011). Full-waveform airborne laser scanning (FWF ALS) has evolved into a state-of-the-art technology for highly accurate 3D data acquisition. By now several studies indicate a high value of 3D vegetation description, e.g. in forestry (Hyyppä et al., 2012; Næsset, 2007), plantation (Fieber et al., 2013; Görgens et al., 2015) and urban areas (Höfle et al., 2012; Richter et al., 2013; Yan et al., 2015). The estimation of tree characteristics like the structure and canopy profile (Latifi et al., 2015; Leiterer et al., 2012; Lindberg et al., 2012), the leaf area index (Alonzo et al., 2015; Fieber et al., 2014), the volume and above ground biomass (Allouis et al., 2013; Cao et al., 2014; Pirotti et al., 2014)as well as the classification of tree species (Ghosh et al., 2014; GuangCai et al., 2012; Heinzel and Koch, 2011; Hollaus et al., 2009; Holmgren and Persson, 2004; Hovi et al., 2016) have been applied, especially in forested areas. In contrast to closed forest stands, urban trees are characterized by large species diversity within small areas and a complex (typically anthropogenic) shape.
Although the mentioned studies are performed in different fields of application, the usage and type of the derived geometric and radiometric features are comparable. What we call “features” describes a quantity of a single tree object (e.g. height and crown length) or an observation of the returned laser signal (e.g. echo width) and is derived from the point cloud directly or by further processing (e.g. radiometric calibration). In case of tree species
classification, features are deduced from previously detected single tree objects using segmentation methods like raster-based watershed segmentation or 3D point-based segmentation (Eysn et al., 2015; Koch et al., 2014). Based on the object-based features the species are classified using explorative analysis (Hollaus et al., 2009) or applying advanced classifiers such as SVM (GuangCai et al., 2012; Ko et al., 2014), Random Forest (Ko et al., 2012; Yu et al., 2014) and artificial neural network (Höfle et al., 2012).
This paper investigates frequently used geometric and radiometric feature sets for tree family classification in an urban environment. The usage of geometric features is based on the assumption that the point distribution metrics is characteristic of the defined tree object (Holmgren and Persson, 2004). For example, pines tend to have a conical crown shape while maple trees have a round crown shape. Furthermore, the radiometric features depends on the amount, distribution, orientation and reflectance properties of the scattering elements hit by the laser. For example in coniferous trees, height variations of small scatterers like needles and small branches, tend to broaden the echo width. Groups of small scatterers are not separable in the echo waveform (Ducic et al., 2006; Höfle and Hollaus, 2010; Hollaus et al., 2014). Accordingly, a successful separation of different trees with varying structure is expected by using geometric and radiometric features together. Various feature types, which have been successfully applied in classifying trees in forested areas, are used in this study. The features are deduced from previously segmented single tree objects, based on the methodology of Höfle et al. (2012). Due to the 2D-based segmentation method using the digital surface model (DSM), interfering objects, like cars parking beneath tree crown, are
included in the segment’s point cloud. The influence of such interfering objects on object-based feature derivation and subsequently classification accuracy is evaluated. Feature derivation and classification are performed on i) “uncleaned” point cloud and ii) “cleaned” point cloud of the tree segments. The cleaning implies the manual removal of the points caused by the interfering objects.
2. STUDY AREA AND DATA SETS
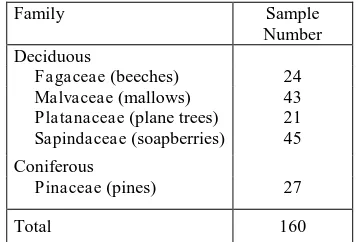
The area of investigation is located in the centre of Vienna, Austria (LVISA, 2015). The study area is characterized by a great variety of planting and tree species. Deciduous trees such as beeches (Fagaceae), mallows (Malvaceae), plane trees (Platanaceae) and soapberries (Sapindaceae) are predominant and sparsely coniferous pine species (Pinaceae) can be found. The study area mainly contains large buildings and artificial objects such as fences, cars and some Christmas market booths. In total, 160 clearly identifiable single trees are considered in this study for classification (Table 1).
The FWF ALS data were obtained in the framework of the city-wide LiDAR acquisition campaign in the winter season 2006/2007 under leaf-off conditions. The Riegl LMS-Q560 system using near-infrared (1550 nm) laser pulse with a pulse width of 4 ns was employed. The relative height values are calculated by subtracting the digital terrain model from the point cloud. Further information regarding sensor settings and pre-processing are given in Höfle et al. (2012).
Family Sample
Number Deciduous
Fagaceae (beeches) 24
Malvaceae (mallows) 43 Platanaceae (plane trees) 21 Sapindaceae (soapberries) 45
Coniferous
Pinaceae (pines) 27
Total 160
Table 1. Number of trees per family used for classification.
3. METHODS
The workflow consists of data pre-processing, the exploration and derivation of features, followed by the classification, feature selection and validation. The main strategy of the classification procedure aims to assess the influence of interfering objects, the difference between the tree families in derived features and the evaluation of the applicability of geometric and radiometric features. The workflow is summarized in Figure 1.
Figure 1. Workflow to classify tree families using derived geometric and radiometric features from FWF point cloud data.
3.1 Pre-processing
In contrast to closed forest stands, urban trees are characterized by large species diversity within small areas, a complex (typically anthropogenic, managed) shape and artificial objects beneath the tree crown. The usage of commonly available 2D-based tree detection methods leads to the presence of points caused by interfering objects in the tree segment’s point cloud. Height threshold (Hthresh) is used to exclude most of the interfering points
lower than 2 m (Hollaus et al., 2010). To evaluate and avoid the influence of further interfering points, the single trees are explored visually and in case of such points a manual cleaning process is achieved (Figure 2). Based on this pre-processing work, two datasets are used for further processing: i) “cleaned” and ii) “uncleaned” data.
Figure 2. Point clouds before height threshold calculation for a Platanaceae tree segment, colored by relative height: “uncleaned” (left) and “cleaned” (right). The left point cloud comprises a Christmas market booth beneath the crown (black box).
To enhance the comparability of the trees, the relative height values in meter are converted to percentage of the tree height (TH), assuming a similar and characteristic shape within each family. The tree height is defined as the relative height (RH) of the highest point in the tree segment.
3.2 Feature Derivation
Trees can be parameterized by several features in order to distinguish different tree families. Full-waveform data offer the possibility to describe trees by using their geometric (e.g. crown length-width-ratio) and radiometric properties (e.g. backscatter cross-section). Based on two types of geometric and radiometric features, seven sets of features (F1-F7) are derived from the single tree segments (dataset 1 and 2). Two feature sets (F1, F2) are of geometric type and are deduced from the XYZ coordinates, whereby F1 considers all points and F2 relates to the metrics of the previously detected crown. The third feature set (F3) comprises the radiometric features echo width (EW), backscatter coefficient (γ), backscatter cross-section (σ) and the ratio of EW and σ (EW-σ-ratio). A distinction is made between the feature classes: "object" and "height layer" (Table 2). The former class features are calculated for the whole segmented tree object. The latter class related to different height layers within the single tree object. Height layers are limited to various extent within the tree object. The F4-F7 feature sets combine F1, F2 and F3 differently (Figure 1). The derived features are set-wise given in Table 2 and explained in detail in the following.
Type Class ‘geometric’ and ‘radiometric’ and by the feature classes ‘object’ for single tree segment and ‘height layer’ within the single tree object. The statistical measures are: minimum, maximum, mean, standard deviation, range and coefficient of variation. The total number of features (#) is given in brackets.
The features in this study were chosen based on a literature research, selecting the most frequently and successfully applied features for tree species classification (Vauhkonen et al., 2014). The derived geometric features are the pulse penetration ratio (PPR), basic statistics of relative tree height (RH), the point density within the different height layers (Hperc) and features related to the crown (Cao et al., 2014; Yu et al., 2014). The PPR is defined as the ratio of number of points between the defined height layer and the remaining layers. At this, four different PPR are derived: i) ground vs. non-ground (PPRground); ii) mean tree
height (PPRmH); iii) Hthresh (PPRHthresh) vs. all tree segment points;
and iv) PPR between ground points and each height percentiles (PPRperc). The amount of points per height layer and their
distribution over tree height is reflected in the height percentiles statistics (Hperc). The statistics measures of relative height
(minimum, maximum, mean, standard deviation, range and coefficient of variation) are calculated for the whole tree segment (RHstat) and for the height percentiles (RHperc). Furthermore, a
differentiation is made between “all” and “only first” returns, which is indicated by the suffix (“_all” and “_f”) in the feature abbreviation.
The different tree species and families show specific characteristics in crown shape (e.g. round, conical, cylindrical or
large spreading crowns) which in turn can be used for classification. The derivation of the crown-based features relies on the prior detection of the crown base height. The crown base (CB) is detected by the method described in detail in Section 3.3. Subsequently, crown length (CL), crown width (CW) and crown volume (CV) are calculated as well as the ratios of CL and CW and of TH and CW. The CL is defined as the height difference between the CB height and TH (Allouis et al., 2013; Holmgren and Persson, 2004). The CW is derived by the convex hull of the tree segment and its maximum diameter (Yu et al., 2014). Three cases can be expected for the ratios: i) ratios tending to zero, representing conical/cylindrical crowns, ii) ratios around 1 for more rounded crowns, and iii) ratios larger than one indicating large spreading crowns. The CV is determined by 3D Delaunay triangulation and defines the total volume of each tetrahedron in relation to the height of the tree (Fernández-Sarría et al., 2013).
Radiometric features comprise the object and height layer statistics of EW, γ, σ and the ratios between σ and EW(Yu et al., 2014). The derived statistical measures are the minimum, maximum, mean, standard deviation, range and coefficient of variation. These statistical measures are calculated for the single trees objects and the height layers within the single trees objects defined as being: i) above CB ii) the upper 20% of tree height, and within the height percentiles of iii) 25th to 50th and iv) 50th to 75th.
3.3 Crown Base Detection
In this study, crown base is defined as the height from the ground to the tree’s crown bottom. The crown bottom is determined by comparing the extent of point distribution (area) per height interval (slice) and detecting the first high increase/decrease in area (Allouis et al., 2013). A distinction is made between trees having a constant decrease with increasing tree height (e.g. more conical crown shape of pines) and trees, having an increase followed by a decrease in area over height (e.g. more rounded crown shapes of maples).
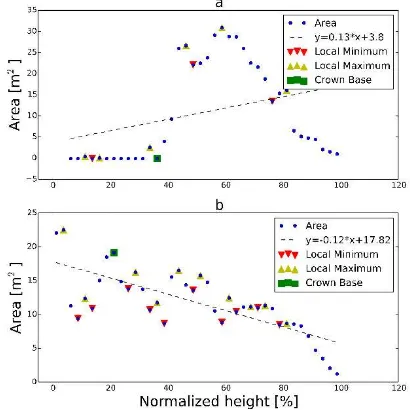
Figure 3. Derivation of the local extrema and the crown base, by differentiating two cases: a.) trees having a more rounded crown shape and b.) trees having a more conical crown shape.
The following steps are applied for the CB determination: i) vertical slicing of the point cloud by intervals of 2.5% of the normalized height values; ii) calculation of the convex hull of all points contained in each slice (i.e. area); iii) linear regression of
the vertical profile of the area values and iv) derivation of local extrema within the vertical profile, depending on the coefficient of linear regression. A local extremum is defined as the maximum or minimum of the profile function within the given range of four neighbouring points. In case of a positive coefficient (m>0), a more rounded tree is given and the minimum is selected prior to the first maximum, when the ratio of both extrema is greater than 2.5 (cf. Figure 3a). This threshold is examined by a first explorative analysis of a subset of trees. A negative coefficient (m<0) represents a more conical tree and the largest maximum is chosen if it is followed by local minima, searching top down of tree height (cf. Figure3b).
3.4 Classification
The classification aims to evaluate the derived features in order to classify the target tree families. The Random Forest (RF) classifier is applied considering the different input features sets (Pedregosa et al., 2011). The approach is selected based on similar applications of RF for tree species classification (Ko et al., 2012; Yu et al., 2014). RF is robust to outliers and gives internal estimates of feature importance (Breiman, 2001). Furthermore, the Recursive Feature Elimination with 10-fold Cross Validation (RFECV) is applied on RF to evaluate the accuracy with respect to the number of selected features (Guyon et al., 2002). The feature subset achieving the best scoring is used as input data set in a second classification step with RF classifier. The accuracy measure is used to score in the RFECV in order to select the best subset for features.
Data classification is performed using the feature sets F1 to F7. The training data is portioned relatively with a ratio of 0.7 by random sampling, based on Gini Index Weighting. 70% of the data is used in the training sub-process (model learning) and 30% in the testing sub-process (model testing).The number of trees in the applied RF is set to 20, having balanced family classes within each tree. This number of trees is chosen with respect to two aspects: i) selection of the optimum model based on a comparison of accuracy-confidence-ratio of a series of RF models with increasing number of trees; and ii) the fact that if the number of trees is greater than the number of features, the RF tends to use every feature in some of the trees and thus often leads to a decrease in accuracy. Furthermore, the minimum number of samples required to split an internal node is set to 5 and the minimum number of samples in newly created leaves to 2.
The accuracy of the resulting models is assessed by calculating the measures of overall accuracy (OA), precision (producer’s accuracy), recall (user’s accuracy) and Cohen Kappa. To explain the feature importance for classification, the Gini Index as a measure of inequality of the features is used.
4. RESULTS AND DISCUSSION
A first exploratory analysis of the derived features is performed on the “uncleaned” and “cleaned” data sets and is discussed in Section 4.2. The discussion of the subsequently applied RF classification on both data sets and usage of the seven feature sets is given in Section 4.3.
4.1 Crown base detection
The crown base detection is evaluated by the calculation of the coefficient of determination (R²) between the manually detected CB and the automatically detected CB. The automatic CB detection worked best for Platanaceae (R2: 0.94), whereas Pinaceae and Sapindaceae revealed low R² of 0.54 and 0.59.
Intermediate R² is reached for Fagaceae (0.70) and Malvaceae (0.69). In particular a lack of points in the lower tree layers due to lower penetration rate hampers the detection of the CB, like it occurs for Pinaceae more often. Furthermore, the visual detection of CB is biased and may reduce the R².
4.2 Feature exploration
The exploration of features comprises the analysis of histograms and box plots of single features, differentiated according to tree family.
The comparison of both data sets for single features points out the influence of interfering objects on feature characteristics, in particular for object-based and radiometric features. The interference in radiometric features is due to the different reflectance properties of e.g. the artificial objects under the tree crown. For example, the distribution of the mean backscatter cross-section is shifted towards higher values and has higher variance (multi peaks) for uncleaned tree point clouds (Figure 4).Furthermore, the derivation of the CB is difficult and failed for a large number of trees in the “uncleaned” data set. Thus, the comparison of the performance of the classification of the two data sets is done for the features sets F1, F3 and F4, whereby F4 comprises F1 and F3. The crown-based feature set F2 and its combination with other feature sets are only applied for classifying the “cleaned” data.
Figure 4. Histogram of mean backscatter cross-section (σmean) of
uncleaned and cleaned data, coloured by tree family.
Comparing the families using the features of the “cleaned” data set reveals on one hand separability between single families for some features, but on the other hand similar characteristics of features as well. For example the pulse penetration ratio seems to be appropriate for differentiating the coniferous family Pinaceae and the deciduous families Malvaceae and Sapindaceae(Figure5). This might be due to the fact, that during leaf-off condition the canopy of the deciduous families is sparser and thus the number of echoes in the lower height layers is higher.
Figure 5. The pulse penetration ratio (PPR) differentiated by tree family and related to the three levels i) ground (PPRGround), ii)
mean tree height (PPRmH) and iii) Hthresh of 2 m (PPRHthresh).
The comparison of the crown length-width-ratio reflects the typical crown shape of the present tree families. The assumed low ratio of conical shapes is given for the Pinaceae, showing values less than 0.6. The family of Fagaceae shows values between 0.6 and 1, whereby values close to 0.6 can be assigned to the species Fagus sylvatica and values close to 1 represent species of Quercus sp.. The ratios of Malvaceae, Sapindaceae, Platanaceae show a high range of values (0.6 to 1.6).
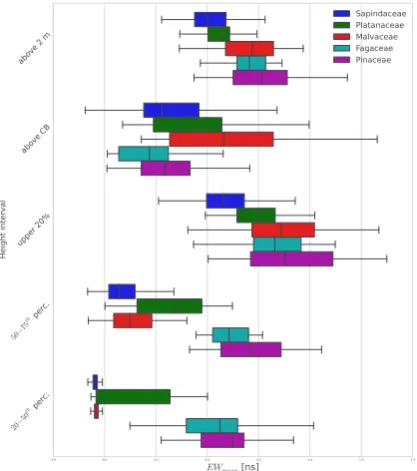
Associated with this issue a higher mean EW of Pinaceae and Fagaceae (>4.4 ns) can be noticed compared to the other families (<4.4 ns) (Figure 6). The small height variations caused by small scatterers like needles or the finer bifurcation of beeches tend to broaden the echo width.
Figure 6. The mean echo width differentiated by tree family and related to different height intervals
4.3 Classification
In order to achieve the best accuracy and to test the power of the derived feature types, the seven subsets of features F1-F7 are
evaluated. Furthermore, the influence of interfering objects on classification is analysed, comparing the results of the used “uncleaned” and “cleaned“ data sets for the sets F1, F3 and F4.
“uncleaned” data set
“cleaned” data set Geometric Features (F1)
Overall Accuracy 73.5% 76.4%
Cohen Kappa 56.9% 61.6%
Radiometric Features (F3)
Overall Accuracy 38.2% 44.1%
Cohen Kappa 11.5% 18.4%
Table 3. Results of the classification (overall accuracy and Cohen Kappa) for the derived geometric (F1) and radiometric (F3) feature sets of the “uncleaned” and “cleaned” data sets of the given tree families.
The effect of interfering objects on classification accuracy is greater for the radiometric features (-5.9 %) than for features considering only the point distribution (-2.9 %) (Table 3). In particular, the different reflectance properties of tree elements and artificial objects have a great influence on object-based statistics. Consequently and in conjunction with the feature exploration, a prior elimination of interfering objects and the application of advanced tree object detection methods are recommended, especially when using radiometric features. Due to varying types and sizes of interfering objects, the usage of a general height threshold for all trees is only possible to a limited extent, whereby more advanced tree detection methods are necessary. However, both data sets achieved higher accuracy when using only geometric features.
[%] Feature Set
F1 F2 F3 F4 F5 F6 F7
Overall
Accuracy 78.4 65.9 86.3 87.5 81.8 84.0 84.0 Precision 78.9 65.6 86.3 88.8 80.9 84.6 84.1
Recall 78.4 65.9 86.4 87.5 81.8 84.1 84.1 Cohen’s
Kappa 60.7 41.1 75.8 78.0 65.0 71.6 71.6
Table 4. Results of classification for the “cleaned” data set, differentiated by the seven feature sets (F1-F7) of the given tree families.
The most reliable classification at tree family level of “cleaned” data is achieved by using the combination of geometric and radiometric features, resulting in a total of 87.5% overall accuracy (Table 4). The higher accuracy when using combined feature sets is comparable with the results of earlier studies, e.g.: Lindberg et al. (2014), who achieved an OA of 71% compared to 60% using solely geometric features. The usage of features related to the crown is only possible to a limited extent. The derived crown shape feature of the single species of one family varied widely. A greater difference in crown shape can only be found between coniferous and deciduous trees, which is reflected in an OA of 95.4% classifying at tree class level. Furthermore, the anthropogenic influence on tree growth is high in urban areas and therefore affects the classification accuracy. For example, Ko et al. (2014) achieved an OA of 91.2% when using geometric crown features when classifying in forested area. Adding geometric features to F3 leads to an increase of 1.2% in overall accuracy. Already the radiometric features enable reliable classification accuracy of 86.3% at tree family level and of 97.7%
at tree class level. This higher accuracy of radiometric features in comparison to solely using geometric features is also shown by Reitberger et al. (2008), who’s study showed a difference in OA up to 10% for the various feature sets.
A detailed analysis of the five families reveals differences in the applicability of the single feature sets for classification (Table 5). The single usage of features related to point distribution or radiometric features classified the Fagaceae with high precision (~100%), whereas the Malvaceae achieved high precision and recall when using the combination of geometric and radiometric features (F4). This higher precision of the Fagaceae compared to the other families is also showed by Heinzel and Koch (2011). In particular, the Pinaceae can be already differentiated from the other (deciduous) tree families with high recall. For example the higher proportion of returns at the top height layers, which is shown by Ko et al. (2014), can be seen for the given pines as well. The Malvaceae reached higher misclassification and is often wrongly classified as Sapindaceae and Platanaceae.
[%] Feature Set
Table 5. Recall and precision differentiated by feature set and tree family. The total number of trees is added in brackets.
4.4 Feature Importance
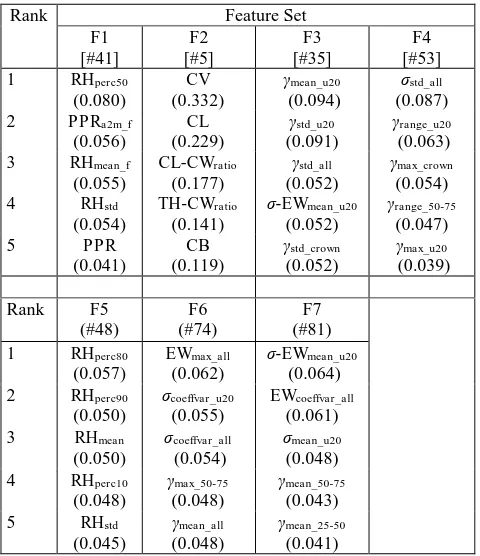
The applied Random Forest is used together with Recursive Feature Elimination with Cross Validation method in order to extract the feature implicit importance and ranking of the features based on Gini Index. Table 6 highlights the top five features of the seven feature sets used for classification. In particular, features of the upper crown parts showed higher importance and are ranked most frequently in the top five. This is associated with the fact that the major structural difference among tree species occurs at the top crown layers (Vauhkonen et al., 2014). For example, Lindberg et al. (2014) show a higher proportion of single returns at the top layers for pines trees compared to deciduous trees under leaf-off condition. However, a direct comparison of the feature importance with other studies and their ranking is possible only to a limited extent, since most studies do not perform a separate feature importance test.
Rank Feature Set coefficient of the single features is given in brackets.
5. CONCLUSION
Our study shows the potential of FWF ALS to classify trees at family level in urban environments (e.g. city centers). The comparison of the derived geometric and radiometric features demonstrates their applicability for taxonomic tree family classification. Possible limitations due to interfering objects are presented by the analysis of uncleaned and cleaned data sets and their influence on the feature characteristics. In particular, the object-based and radiometric features are affected by such artificial objects and require precise detection of the tree in the point cloud using more advanced tree detection methods (Reitberger et al., 2009).
Moreover, our study revealed that radiometric features indicate the potential of classifying different tree families and are less influenced by crown shape differences. The most reliable classification is achieved by using the combination of geometric and radiometric features, resulting in 87.5% overall accuracy. The usage of features related to the crown is only possible to a limited extent due to our approach to detect the crowns, high intra-family variance of crown shape and high anthropogenic influence in urban areas. In order to differentiate between coniferous and deciduous trees, features related to different shapes are applicable. With respect to intra-family variance, investigations on species-specific feature derivation and analysis of the effect of the changing seasons are necessary.
ACKNOWLEDGEMENTS
We would like to thank the MA41-Stadtvermessung, City of Vienna, for their support and for providing the airborne LiDAR data and reference datasets.
Zs. Koma was funded by the Erasmus Internship Scholarship. K. Koenig and B. Höfle were funded by the Federal Ministry of
Science, Research and Arts (MWK), Baden-Wuerttemberg, Germany, in the framework of the project LS-VISA (FKZ 1222 TG 87).
REFERENCES
Allouis, T., Durrieu, S., Vega, C., Couteron, P., 2013. Stem volume and above-ground biomass estimation of individual pine trees from LiDAR data: contribution of full-waveform signals. IEEE Journal of Selected Topics in Applied Earth Observations and Remote Sensing, 6(3), pp. 924-934.
Alonzo, M., Bookhagen, B., McFadden, J.P., Sun, A., Roberts, D.A., 2015. Mapping urban forest leaf area index with airborne lidar using penetration metrics and allometry. Remote Sensing of Environment, 162, pp.141-153.
Breiman, L., 2001. Random Forests. Machine Learning, 45(1),pp. 5-32.
Cao, L., Coops, N., Hermosilla, T., Innes, J., Dai, J., She, G., 2014. Using small-footprint discrete and full-waveform airborne LiDAR metrics to estimate total biomass and biomass components in subtropical forests. Remote Sensing 6, pp.7110-7135.
Ducic, V., Hollaus, M., Ullrich, A., Wagner, W., Melzer, T., 2006. 3D Vegetation mapping and classification using full-waveform laser scanning, In: Proceedings of the Workshop on 3D Remote Sensing in Forestry. EARSeL/ISPRS, Vienna, Austria, 14–15 February 2006, pp. 211–217.
Eysn, L., Hollaus, M., Lindberg, E., Berger, F., Monnet, J.-M., Dalponte, M., Kobal, M., Pellegrini, M., Lingua, E., Mongus, D., Pfeifer, N., 2015. A benchmark of LiDAR-based single tree detection methods using heterogeneous forest data from the Alpine space. Forests, 6(5), pp. 1721-1747.
Fernández-Sarría, A., Martínez, L., Velázquez-Martí, B., Sajdak, M., Estornell, J., Recio, J.A., 2013. Different methodologies for calculating crown volumes of Platanus hispanica trees using terrestrial laser scanner and a comparison with classical dendrometric measurements. Computers and Electronics in Agriculture, 90, pp. 176-185.
Fieber, K.D., Davenport, I.J., Ferryman, J.M., Gurney, R.J., Walker, J.P., Hacker, J.M., 2013. Analysis of full-waveform LiDAR data for classification of an orange orchard scene. ISPRS Journal of Photogrammetry and Remote Sensing, 82, pp. 63-82.
Fieber, K.D., Davenport, I.J., Tanase, M.A., Ferryman, J.M., Gurney, R.J., Walker, J.P., Hacker, J.M., 2014. Effective LAI and CHP of a single tree from small-footprint full-waveform LiDAR. IEEE Geoscience and Remote Sensing Letters, 11(9), pp. 1634-1638.
Ghosh, A., Fassnacht, F.E., Joshi, P.K., Koch, B., 2014. A framework for mapping tree species combining hyperspectral and LiDAR data: Role of selected classifiers and sensor across three spatial scales. International Journal of Applied Earth Observation and Geoinformation, 26, pp. 49-63.
Görgens, E.B., Montaghi, A., Rodriguez, L.C.E., 2015. A performance comparison of machine learning methods to estimate the fast-growing forest plantation yield based on laser scanning metrics. Computers and Electronics in Agriculture, 116, pp. 221-227.
GuangCai, X., Yong, P., Zengyuana, L., Dan, Z., Luxia, L., 2012. Individual trees species classification using relative calibrated full-waveform LiDAR data, In: Proceedings of Silvilaser, Vancouver, BC., pp. 163-174.
Guyon, I., Weston, J., Barnhill, S., Vapnik, V., 2002. Gene selection for cancer classification using support vector machines, Machine Learning, 46, pp. 389–422
Heinzel, J., Koch, B., 2011. Exploring full-waveform LiDAR parameters for tree species classification. International Journal of Applied Earth Observation and Geoinformation, 13(1), pp. 152-160.
Hillen, F., Höfle, B.,2015. Geo-reCAPTCHA: Crowdsourcing large amounts of geographic information from earth observation data. International Journal of Applied Earth Observation and Geoinformation, 40 (0), pp. 29-38.
Höfle, B., Hollaus, M., 2010. Urban vegetation detection using high density full-waveform airborne lidar data-combination of object-based image and point cloud analysis. In: International Archives of Photogrammetry, Remote Sensing and Spatial Information Sciences, XXXVIII, Part 7B, pp. 287-292.
Höfle, B., Hollaus, M., Hagenauer, J., 2012. Urban vegetation detection using radiometrically calibrated small-footprint full-waveform airborne LiDAR data. ISPRS Journal of Photogrammetry and Remote Sensing, 67, pp. 134-147.
Hollaus, M., Mücke, W., Höfle, B., Dorigo, W., Pfeifer, N., Wagner, W., Bauerhansl, C., Regner, B., 2009. Tree species classification based on full-waveform airborne laser scanning data. In: Proceedings of Silvilaser, Texas, USA, pp. 54-62.
Hollaus, M., Mücke, W., Roncat, A., Pfeifer, N., Briese, C., 2014. Full-waveform airborne laser scanning systems and their possibilities in forest applications.In:M. Maltamo, E. Næsset and J. Vauhkonen (eds), Forestry Applications of Airborne Laser Scanning: Concepts and Case Studies, Springer Netherlands, pp. 43-61..
Hollaus, M., Wagner, W., Molnar, G., Mandlburger, G., Nothegger, C., Otepka, J., 2010. Delineation of vegetation and building polygons from full-waveform airborne LIDAR data using OPALS software. In: Proceedings of a Special Joint Symposium of ISPRS Technical Commission IV & AutoCarto in Conjunction with ASPRS/CaGIS 2010 Fall Specialty Conference, Orlando, FL, USA, p. 7.
Holmgren, J., Persson, Å., 2004. Identifying species of individual trees using airborne laser scanner. Remote Sensing of Environment, 90(4), pp. 415-423.
Hovi, A., Korhonen, L., Vauhkonen, J., Korpela, I., 2016. LiDAR waveform features for tree species classification and their sensitivity to tree- and acquisition related parameters. Remote Sensing of Environment, 173, pp. 224-237
Hyyppä, J., Yu, X., Hyyppä, H., Vastaranta, M., Holopainen, M., Kukko, A., Kaartinen, H., Jaakkola, A., Vaaja, M., Koskinen, J., Alho, P., 2012. Advances in forest inventory using airborne laser scanning. Remote Sensing, 4(5), pp. 1190-1207.
Ko, C., Sohn, G., Remmel, T., Miller, J., 2014. Hybrid ensemble classification of tree genera using airborne LiDAR data. Remote Sensing, 6(11), pp. 11225-11243.
Ko, C., Sohn, G., Remmel, T.K., 2012. A comparitive study using geometric and vertical profile features derived from airborne LIDAR for classifying tree genera. ISPRS Annals of Photogrammetry, Remote Sensing and Spatial Information Sciences, 1, pp. 129-134.
Koch, B., Kattenborn, T., Straub, C., Vauhkonen, J., 2014. Segmentation of forest to tree objects, In: Maltamo, M., Næsset, E., Vauhkonen, J. (Eds.), Forestry Applications of Airborne Laser Scanning. Springer Netherlands, pp. 89-112.
Latifi, H., Fassnacht, F.E., Müller, J., Tharani, A., Dech, S., Heurich, M., 2015. Forest inventories by LiDAR data: A comparison of single tree segmentation and metric-based methods for inventories of a heterogeneous temperate forest. International Journal of Applied Earth Observation and Geoinformation, 42, pp. 162-174.
Leiterer, R., Morsdorf, F., Torabzadeh, H., Schaepman, M.E., Mucke, W., Pfeifer, N., Hollaus, M., 2012. A voxel-based approach for canopy structure characterization using full-waveform airborne laser scanning.IEEE International Geoscience and Remote Sensing Symposium (IGARSS), pp. 3399-3402.
Lindberg, E., Eysn, L., Hollaus, M., Holmgren, J., Pfeifer, N., 2014. Delineation of tree crowns and tree species classification from full-waveform airborne laser scanning data using 3-d ellipsoidal clustering. In: IEEE Journal of Selected Topics in Applied Earth Observations and Remote Sensing, 7(7), pp. 3174-3181.
Lindberg, E., Olofsson, K., Holmgren, J., Olsson, H., 2012. Estimation of 3D vegetation structure from waveform and discrete return airborne laser scanning data. Remote Sensing of Environment, 118, pp. 151-161.
LVISA, 2015. Lidar Vegetation Investigation and Signature Analysis System.http://lvisa.geog.uni-heidelberg.de (Accessed 2015-11-19).
Næsset, E., 2007. Airborne laser scanning as a method in operational forest inventory: Status of accuracy assessments accomplished in Scandinavia. Scandinavian Journal of Forest Research, 22(5), pp. 433-442.
Pedregosa, F.,Varoquaux, G.,Gramfort, A.,Michel, V.,Thirion, B.,Grisel, O.,Blondel, M., Prettenhofer, P., Weiss, R., Dubourg, V., Vanderplas, J., Passos, A., Cournapeau, D., Brucher, M., Perrot, M., Duchesnay, E., 2011. Scikit-learn: Machine Learning in Python. Journal of Machine Learning Research, 12, pp. 2825-2830.
Pirotti, F., Laurin, G., Vettore, A., Masiero, A., Valentini, R., 2014. Small footprint full-waveform metrics contribution to the prediction of biomass in tropical forests. Remote Sensing, 6, pp. 9576-9599.
Reitberger, J., Schnörr, C., Krzystek, P., Stilla, U., 2009. 3D segmentation of single trees exploiting full waveform lidar data. ISPRS Journal of Photogrammetry and Remote Sensing, 64(6), pp. 561-574.
Reitberger, J., Krzystek, P., Stilla, U., 2008. Analysis of full waveform lidar data for the classification of deciduous and coniferous trees. International Journal of Remote Sensing, 29(5), 1407-1431.
Richter, R., Behrens, M., Döllner, J., 2013. Object class segmentation of massive 3D point clouds of urban areas using point cloud topology. International Journal of Remote Sensing, 34(23), 8408-8424.
Vauhkonen, J., Ørka, H.O., Holmgren, J., Dalponte, M., Heinzel, J., Koch, B., 2014. Tree Species Recognition Based on Airborne Laser Scanning and Complementary Data Sources. In: Maltamo, M., Nsset, E., Vauhkonen, J.,(Eds.), Forestry Applications of Airborne Laser Scanning, Springer Netherlands, pp. 135-156.
Vanden Borre, J., Paelinckx, D., Mücher, C.A., Kooistra, L., Haest, B., De Blust, G., Schmidt, A.M., 2011. Integrating remote sensing in Natura 2000 habitat monitoring: Prospects on the way forward. Journal for Nature Conservation, 19(2), pp. 116-125.
Yan, W.Y., Shaker, A., El-Ashmawy, N., 2015. Urban land cover classification using airborne LiDAR data: A review. Remote Sensing of Environment, 158, pp. 295-310.
Yu, X., Litkey, P., Hyyppä, J., Holopainen, M., Vastaranta, M., 2014. Assessment of low density full-waveform airborne laser scanning for individual tree detection and tree species classification. Forests, 5(5), pp. 1011-1031.