QUALITY OF 3D POINT CLOUDS FROM HIGHLY OVERLAPPING UAV IMAGERY
Norbert Haala*, Michael Cramer, Mathias Rothermel
Institute for Photogrammetry, University of Stuttgart [firstname.lastname]@ifp.uni-stuttgart.de
Commission I, ICWG I/5
KEY WORDS: Platforms, Point Cloud, Matching, DEM/DTM, Surface, High resolution, Three-dimensional, Performance
ABSTRACT:
UAVs are becoming standard platforms for photogrammetric data capture especially while aiming at large scale aerial mapping for areas of limited extent. Such applications especially benefit from the very reasonable price of a small light UAS including control system and standard consumer grade digital camera, which is some orders of magnitude lower compared to digital photogrammetric systems. Within the paper the capability of UAV-based data collection will be evaluated for two different consumer camera systems and compared to an aerial survey with a state-of-the-art digital airborne camera system. During this evaluation, the quality of 3D point clouds generated by dense multiple image matching will be used as a benchmark. Also due to recent software developments such point clouds can be generated at a resolution similar to the ground sampling distance of the available imagery and are used for an increasing number of applications. Usually, image matching benefits from the good images quality as provided from digital airborne camera systems, which is frequently not available from the low-cost sensor components used for UAV image collection. Within the paper an investigation on UAV-based 3D data capture will be presented. For this purpose dense 3D point clouds are generated for a test area from three different platforms: first a UAV with a light weight compact camera, second a system using a system camera and finally a medium-format airborne digital camera system. Despite the considerable differences in system costs, suitable results can be derived from all data, especially if large redundancy is available such highly overlapping image blocks are not only beneficial during georeferencing, but are especially advantageous while aiming at a dense and accurate image based 3D surface reconstruction.
* Corresponding author.
1. INTRODUCTION
UAVs provide a serious option while aiming at large scale aerial mapping for areas of limited extent. While flight patterns are very flexible, especially if rotary systems are used, many UAV projects are still captured by strip-wise flight patterns. Thus, standard photogrammetric block geometry is available as input for traditional photogrammetric data capture. For such scenarios only minor modifications are required to evaluate the collected imagery by of-the-shelf commercial software products. By these means tasks like Automatic Aerial Triangulation (AAT) and the generation of Digital Surface Models and orthoimages can be solved efficiently. In addition to such standard products, the application of dense image matching for the generation of high quality 3D point clouds has become a task of growing importance. Based on approaches like the Semi-Global Matching (SGM) stereo method Hirschmüller (2008), surface reconstruction is feasible with a resolution at the ground sampling distance of the captured imagery. The potential of SGM for image data from digital airborne camera systems is for example discussed in (Haala & Rothermel, 2012). In these investigations, matching accuracies better than 0.2 pixels allowed the reliable generation dense 3D points even for areas of very limited texture. Furthermore, efficient accuracy analysis was feasible from the combination of stereo matches from multiple image pairs. The available redundancy also allowed for an efficient elimination of erroneous matches and resulted in a considerable reliability of the 3D points at vertical accuracies well at the sub-pixel level.
However, for these tests data from digital aerial cameras were used. These provide airborne imagery of good dynamic range
and signal-to-noise ratio, which is highly beneficial for automatic image matching especially at surfaces with relatively little surface texture. In contrast UAV platforms are frequently equipped with consumer cameras. Due to their comparable small pixel size this usually results in limited radiometric quality if compared to digital aerial cameras. Furthermore, the use of an inexpensive optic and camera body can reduce the stability of image geometry. On the other hand, UAV images can be collected easily at a high overlap due to their low cruising speed. Thus, photogrammetric processing of UAV images can potentially benefit from the resulting redundancy, which would still allow the generation of high quality 3D point clouds from dense multi-image matching. Within the paper this potential quality is investigated using data from two low-cost fixed-wing UAVs, equipped with different consumer grade digital cameras. Data collection was realized at a 1000mx400m size test area with considerable topography. For accuracy evaluations more than 30 signalized reference points were available. Furthermore, a medium-format digital aerial camera was used to provide an additional reference data set. The investigations presented in the paper result from a pilot project for the Landesamt für Geoinformation und Landentwicklung Baden-Württemberg (LGL BW) aiming to evaluate the suitability of UAV-systems for demands of national mapping authorities.
The following section 2 presents the used UAV-platforms and cameras. Section 3 then discusses the flight configurations including some first investigations on the achieved camera resolution. The investigations on geometric accuracy from Automatic Aerial Triangulation (AAT) and 3D point cloud
generation are discussed in section 4. For the generation of dense 3D points from UAV imagery a processing chain was realized for image orientation by a Structure-from-Motion approach (Abdel-Wahab, M. et. al., 2012), while the terrain surface was reconstructed by a dense matching approach, which was developed originally for evaluation of large format digital airborne camera systems (Haala & Rothermel, 2012; Rothermel et al., 2012). As it will be shown elevation accuracies of ½ pixel are feasible for UAV-imagery.
2. UAV-PLATFORMS AND CAMERAS
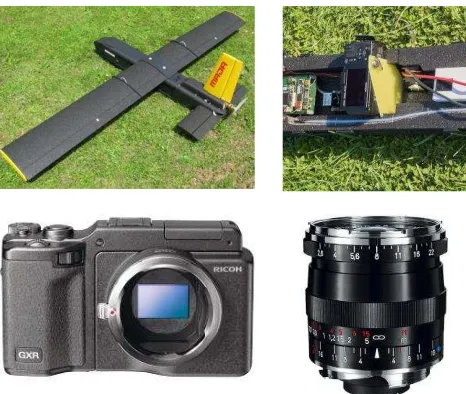
For evaluation of UAV-based photogrammetric data collection, flights from two UAV-platforms with different cameras are examined. The first platform is based on a Multiplex Twinstar II depicted on the top left of Figure 1. It has a wingspan of 1.4 meters and a take-off weight around 1.3 kg. It is able to fly up to 20 minutes on low wind conditions at a cruising speed of about 20 m/s. For image collection, the UAV is equipped with the low-cost consumer-grade compact digital camera Canon IXUS 100 IS, shown in bottom left of Figure 1. The camera has a nominal focal length of 5.90mm and features a 1/2.3” CCD. This corresponds to a CCD sensor size of 4.62x6.16mm with 1.54x1.54µm² pixel size each. Since the camera is small in size and light weight with 180gr it can be mounted easily even to relatively small UAV platforms as shown on the top right of Figure 1.
Figure 1: Platform Twinstar Multiplex (top) and Canon Ixus 100 camera with fixed lens element (bottom).
Similar to other cameras, the Canon IXUS 100 IS features image stabilization to detect and correct camera movement during image acquisition. Within the camera, shake is measured by two piezoelectric gyroscopic sensors. This information is then used to compute drive signals for the electromagnets, which move the IS floating lens element parallel to the image plane. For standard consumer grade applications, the movement of the IS lens group counteracts image shake and maintains a stable picture. However, in an UAV environment the stability of camera calibration as a prerequisite for precise photogrammetric data capture is lost. In former flights (Haala, et.al. 2011) this considerably limited the quality of photogrammetric processing. To avoid movement of the IS lens group due the flight dynamics the moving lens was fixed for the camera used in our tests. For this purpose, as shown on the bottom right of Figure 1, the lens system was demounted and fixed with adhesive.
The Canon Ixus is a typical example for a so-called point-and-shoot or compact camera, which is by far the most common consumer camera type. However, for UAV-based image collection so called mirrorless interchangeable-lens cameras (MILC) can be used, alternatively. Unlike a compact digital camera, a MILC is equipped with an interchangeable lens mount and unlike a digital single-lens reflex camera, a MILC does not have a mirror-based optical viewfinder.
Figure 2: Platform Bormatec Maja (top) with camera Ricoh GXR Mount A12 with Zeiss Biogon 21 mm (bottom).
For our investigations, the Ricoh GXR Mount A12 equipped with a Zeiss Biogon T* 21 mm, depicted in the bottom of Figure 2 was used as an example for such a type of camera. Including optics the weight of this system camera is 650g, which results in higher demands on the maximum payload of the UAV platform. Since these demands could not be fulfilled by the Twinstar Multiplex, the flight platform Bormatec MAJA was used (Bormatec, 2012) for that camera. The plane has a wingspan up to 220cm, a length of 120cm and a take-of weight of 3.5kg. Both UAV systems used in the test were equipped with a custom design on-board computing system by the Institute of Flight Mechanics and Control, University of Stuttgart (Weimer et al., 2010).
Camera Canon Ixus 100 IS Ricoh GXR Mount A12 Image size 4000 × 3000 pix 4288 × 2848 pix
Pixel size 1.54 µm 5.5 µm
Sensor size 6.16 × 4.62 mm² 23.6 × 15.7 mm²
Weight 180 g 650 g
Price 280 € 1950 €
Platform Twinstar Multiplex Bormatec Maja Flight at March, 23, 2013 August, 23,2013 Table 1: Evaluated camera configurations flown at UAV-platforms
The evaluated camera configurations are summarized in Table 1. Both cameras feature a very similar geometric configuration with 3kx4k pixels and an aperture angle of roughly 60°. Thus almost identical block configurations could be flown during our tests.
3. FLIGHT CONFIGURATIONS
For our tests, an area of size 1000m x 400m was captured in a standard photogrammetric block configuration. During data collection, five flight lines provided a comparatively high overlap of approximately 80% in flight and 70% cross flight.
Despite of considerable camera movement due to the relatively high flight dynamics, typical for UAV flights these large overlaps guaranteed sufficient surface coverage. During flights the selected image rate of one shot each 1.5 seconds resulted in a base length of 30m at the assumed cruising speed of 20m/s. The nominal Ground Sampling distance (GSD) varied from 4.5–7.3cm. The relatively large differences in GSD result from a change in terrain height of 100m within the test area.
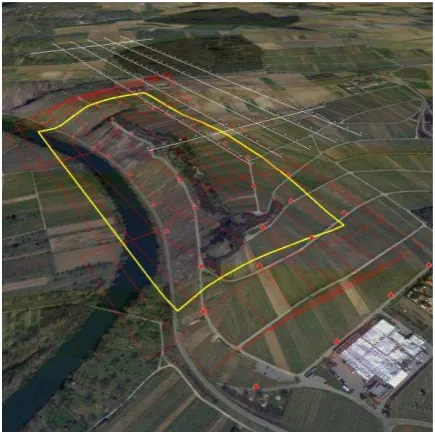
Figure 3: Test-site with planned flight lines, image footprints and signalized points.
Figure 3 visualizes the flight planning for the test site. In addition to flight lines and image footprints, the 33 signalized control points are overlaid to the terrain surface. These points were available at an accuracy of 1cm from terrestrial GPS measurement.
Figure 4: Image sections depicting the Siemen star for Ricoh flown August, 23rd (left) and Canon flown March, 23rd (right) For resolution measurements a Siemens star was signalized, additionally. Exemplary image sections from the performed flights are depicted in Figure 4. These examples additionally show the considerable differences for the state of the vegetation for the performed flights. Vegetation is fully developed for the Ricoh flight on the left, which was captured at August, 23, 2013. In contrast, no leaves are available for the Canon flight on the right, which was captured at March, 23, 2013.
As a first investigation of image quality, the depicted Siemens star was used to measure image blur in terms of the Point Spread Function PSF as for example described by (Becker et.al 2005). For the Canon and the Ricoh cameras these values were 0.57pixel and 0.46pixel, respectively. These values can be used to compute a GSD in object space. This was 7.2cm for the Canon and 5.2cm for the Ricoh camera. For comparison, the
nominal GSD values, as derived from focal length, pixel size and flying height was 5.59cm for Canon and 4.80cm for the Ricoh (Cramer et.al., 2013). These investigations already give a hint for the better image quality of the Ricoh compared to the Canon. In general, the larger pixel size of the Ricoh with 5.5x5.5µm² compared to 1.54x1.54µm² of the Canon IXUS 100 IS should result in a better signal-to-noise-ratio of the captured imagery, which is beneficial for automatic image matching. Finally, fixed focus cameras like the Ricoh should provide more stable geometry than low-cost consumer cameras. Thus an increased quality of photogrammetric processing was expected.
4. BUNDLE BLOCK ADJUSTMENT
Usually Automatic Aerial Triangulation (AAT) is the first step during this processing. While this task is solved for standard aerial image blocks by commercial software systems for more than a decade, however, these tools might fail for the processing of UAV imagery. In such applications high flight dynamics in combination with the relatively small image footprint considerable aggravate the a priori determination of mutual image overlaps. This information is required by a number of tools during automatic tie point generation by image matching. Thus, we reconstruct image connectivity as a prerequisite for the following bundle block adjustment by a so-called Structure and Motion (SaM) approach. For this purpose the SaM implementation by (Abdel-Wahab et.al. 2011) is used. Similar to other SaM approaches feature matching is realized using the SIFT operator (Lowe, 2004). Extracted keypoints are tracked over all images and results are stored in a visibility matrix, which represents the appearance of points in the images. For our investigations, only points visible in at least 3 images were used to increase the reliability of these observations. Since the orientation parameters provided by our SaM approach refers to a local model coordinate system, a transformation to the reference coordinate system based on the GPS measurements of the camera stations is realized as the final step.
Figure 5: Canon image block with automatic tie points from MATCH-AT (August, 23rd 2012).
The resulting parameters are then used to initialize further evaluation with the standard AAT software package MATCH-AT (Sigle & Heuchel, 2001). In addition to an advanced error analysis, this software provides suitable tools for manual measurements of the signalized points, which are then integrated to the further processing. In the presented investigation 22 points were introduced as control points, while the remaining 11 points were used as check points. Tie point
measurements were either provided from the previous SaM approach or were alternatively generated from the least-squares-intensity based matching as available within the MATCH-AT software. Overall, the block from the Canon flight constited of 207 images, while 190 images had to be processed from the Ricoh flight. Maximum deviations from the horizontal line for the Canon flight were -18° and 12° for roll and between -16° and 15° for pitch. The corresponding values for the Ricoh/Zeiss flight were from -15° and 12° for roll and -18° to 30° for pitch. For the Canon flight, approximately 165k points were available from the SaM implementation, while standard settings within MATCH-AT provided 8k points during automatic tie point measurement. These points are also visible in Figure 5. In principle, a large number of tie-points are favorable to increase redundancy for further processing. However, the AAT provided a σ0 of 1.0µm or 0.7pix for the SaM points, while this value was 0.4µm or 0.3pix for automatic tie point measurements from MATCH-AT. These values very well reflect the higher accuracy of tie-point measurement from intensity-based matching in MATCH-AT compared to SIFT keypoints as generated from the SaM approach. Similarly, the RMS error at the measured check points was 5.0cm, 3.7cm and 9.5cm for the East, North and Vertical component for SaM. This accuracy was improved to 3.0cm, 2.3cm and 5.0cm, respectively, while using tie points from MATCH-AT for bundle block adjustment. Compared to earlier investigations of the Canon camera presented in (Haala et.al. 2011) this is a considerable increase in accuracy performance. There, remaining problems in absolute accuracy were documented, which resulted in systematic deviations between the elevations of tie points to a reference DSM. These problems were traced back to geometric instability of the camera geometry.
Figure 6: Ricoh/Zeiss image block with automatic tie points from MATCH-AT (flight August, 23rd, 2012).
The distribution of tie points as extracted from the 190 images of the Ricoh flight are shown in Figure 6. Overall, 27k points were available from the SaM approach, while MATCH-AT generated 1.4k points. Obviously, the presence of vegetation for this flight captured on August 23rd limited the number of tie point measurements compared to the Canon flight. That data set was flown before the growing season on March, 23rd. For the SaM points the AAT provided a σ0 of 4.1µm or 0.7pix while tie-point measurement from MATCH-AT resulted in 1.8µm or 0.7pix. While these values are very similar to the results of the Canon flight, the RMS values at the check points resulted in 3.1cm, 3.7cm and 5.8cm for SaM and 2.9cm, 2.4cm and 4.3cm
for MATCH-AT for the East, North and Vertical component. This gives hint to a slight improvement for the vertical component for the Ricoh flight. Nevertheless, both flights allow for a point determination in the sub-pixel level.
5. DENSE SURFACE RECONSTRUCTION Tools for DSM generation by automatic stereo image matching are available for more than two decades. However, considerable software improvements could be achieved only recently. One example is the success of algorithms like the Semi-Global Matching (SGM) stereo method as proposed by (Hirschmüller, 2008). This approach is used in our investigations to provide a pixel-wise matching. By these means 3D point clouds and DSM can be measured at a resolution, which corresponds to the GSD of the original imagery. The potential of the SGM algorithm was already demonstrated for different applications and data sets. This was our motivation to implement such an approach for dense image matching in the software system SURE (Rothermel et al. 2012), which is used for the following investigations. During investigations on standard aerial imagery (Haala, 2011), this system already showed considerable improvements compared to standard commercial tools. This is especially true while combining multiple image information for surface reconstruction and 3D point cloud generation. The required large image overlap can be provided without any problems from UAV flights due to their low cruising speed.
Figure 7: Amount of overlap for single image.
Figure 7 shows the footprint of an image from the Canon flight represented in light blue. In order to generate a 3D point cloud this so-called base image is matched against all surrounding images. The footprints of these match images are represented in dark blue. Due to the large overlap multiple matches are feasible for each pixel in the base image. As represented by the color coded overlap up to 22 matches are feasible for the given example. As described in more detail in Haala, N. (2011) and (Haala & Rothermel 2012) this redundancy can be used to eliminate mismatches by suitable filter processes. Furthermore, the accuracy of image-based 3D point cloud generation is increased. Thus, these multiple matches enable the generation of an accurate and reliable 3D point cloud. For the base image in Figure 7, the resulting 3D dataset is shown in Figure 8. In principle our pipeline generates a corresponding 3D point for each pixel of the base image. However, to ensure a suitable reliability, a valid 3D point requires at least two successful matches. Thus areas with no valid point measurements occur. For the given example approximately 8 million points are finally computed which corresponds to a success rate of 66%.
However, as it is visible in Figure 8 most mismatches occur at the river area, while for the other regions a higher success rate is reached. Minor problems also result from larger differences in image content of the stereo pairs, which e.g. occur at complex 3D shapes like vegetation or steep object surfaces at the walls and rocks.
Figure 8: Point cloud generated for single match image. The point cloud depicted in Figure 8 just covers a small part of the test area as depicted in a single image. However, each image of the block is used as base image during processing and thus provides an additional 3D point cloud. In order to combine these largely overlapping point clouds, a simple gridding was realized to generate a DSM. There the median values of all
points within a raster cell of 6cm grid width are used to compute the elevation of the corresponding DSM cell.
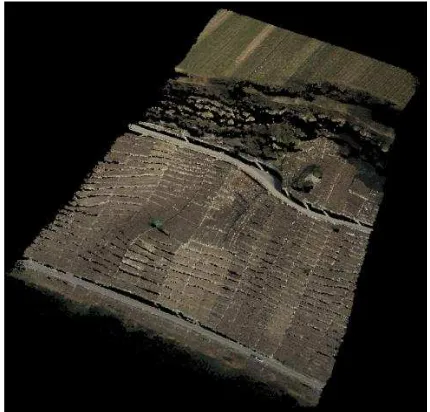
The result of this process for the Ricoh flight is depicted in Figure 9. For each of the 190 available images up to 24 stereo models were generated. This resulted in an overall number of 2003 stereo image pairs to be matched. In order to avoid erroneous measures, a 3D point was only generated if it could be determined consistently from at least 2 stereo measurements. During gridding, usually multiple 3D points were available to determine the elevation of each raster cell. In order to generate a reliable DSM values were only set if at least 3 point measures were available. Thus, for the Ricoh flight elevation values were determined for 95.3% of all raster cells. The complete processing for this data set on a Desktop PC with i7 3.4 GHz processor was finished in 18h 45min. The Canon flight with 207 images resulted in 2170 stereo pairs to be matched. Due to a slightly higher image overlap more stereo partners were available. Including gridding, which generated elevation values for 93.7% of the raster cells, the required processing time was 21h 54min. To obtain an accuracy estimate for the generated DSM surfaces planar areas at two streets were further examined. Overall, 33 surface patches were extracted to use the point-to-plane-distances for computation of a corresponding standard deviation. For the street on top of the slope, the standard deviation of DSM points was 30mm for the Canon and 20mm for the Ricoh flight. In this area the GSD of the original images was 6cm. For the street at the bottom of the slope, which was also investigated the GSD of the captured UAV images was 8cm. Here the standard deviation of DSM points was 42mm for the Canon and 22mm for the Ricoh flight, respectively. Obviously, the 5.5 µm pixel size of the Ricoh provided a better signal-to-noise ratio compared to the 1.54 µm of the Canon camera. This proved to be especially advantageous during matching of low texture areas like street surfaces.
Figure 9: Image textured DSM for the complete test area from Ricoh flight
Figure 10: DSM differences between Ricoh and Canon flight.
The good accuracy for both flights is also visible in Figure 10 which depicts the difference between the DSM from the Ricoh and the Canon flight. Obviously, larger differences are limited to vegetated areas like the vineyards. There, the Canon flight on March 23rd provided more points on the terrain surface, while the Ricoh flight on August 23rd with developed vegetation resulted in more points on that surface. However, for areas without any change of visible surface geometry due to vegetation, the differences are well below 10cm.
As further reference for our investigations on UAV-based photogrammetric data collection, also data from a flight with a medium-format airborne digital camera system was available (Fritsch, et. al. 2013). The used DigiCAM from IGI is system for professional aerial photography and equipped with a 50mm lens and features 50 Mpixels with 8176x6132 across and along pixels at a sensor size of 37x49 mm². Also due to the comparatively great weight of the system a gyrocopter was used as airborne platform. Similar to UAV flights, aerial image collection using such systems benefits from their ability to fly at slow speeds. This is especially useful while aiming at imagery of high resolution and large overlap.
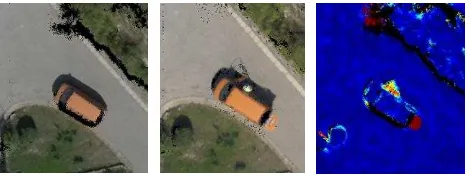
Figure 11: Textured DSM for Ricoh (left) and DigiCam (middle) with DSM differences (right).
Both DigiCAM and Ricoh were flown almost in parallel. Thus DSM differences from these flights as shown in Figure 11 are especially interesting. Figure 11 shows a section of the textured DSM for the Ricoh (left) and the DigiCam (middle), respectively. The differences between both DSM (right) are in the 5cm level, except for changes in surface geometry in the areas of the car. The colour coding of Figure 11 (right) corresponds to the values already given in Figure 10.
6. OUTLOOK AND CONCLUSION
Our investigations clearly demonstrated the feasibility of relatively simple UAV-platforms and cameras for 3D point determination in the sub-pixel level. Absolute elevation accuracies in the order of ½ GSD of the captured imagery could be verified for very complex topographic areas. The available dense image matching proved to be a robust and easy-to-parameterize matching algorithm. Especially the combination of multiple measurements from highly overlapping images increases the accuracy of the generated 3D point clouds. Even more important, the redundancy allows a very efficient elimination of erroneous matches and results in a considerable reliability of the 3D points at vertical accuracies in the centimetre level. Thus, even for aerial imagery of comparatively limited quality a high quality surface reconstruction is feasible. This is especially beneficial for UAV imagery, which is frequently captured using consumer grade digital camera, but can be collected at high resolutions and large overlaps.
7. ACKNOWLEDGEMENTS
The UAV-platforms used for the investigations in the paper were provided from the Institute of Flight Mechanics and
Control, University of Stuttgart. This is gratefully acknowledged. Special thanks to Martin Trittler and Florian Weimer from that institute for their great support during flight performance.
8. REFERENCES
Abdel-Wahab, M., Wenzel, K., & Fritsch, D. (2012) Efficient Reconstruction of Large Unordered Image Datasets for High Accuracy Photogrammetric Applications, ISPRS Ann. Photogramm. Remote Sens. Spatial Inf. Sci., I-3, 1-6,
Becker, S., Haala, N. & Reulke, R. (2005) Determination and Improvement of Spatial Resolution for Digital Aerial Images. Proceedings of ISPRS Hannover Workshop 2005, High-Resolution Earth Imaging for Geospatial Information, unpaginated CD-ROM.
Cramer, M., Haala, N., Rothermel, M., Leinss, B. & Fritsch, D. (2013) UAV-gestützte Datenerfassung für Anwendungen der Landesvermessung – das Hessigheim-Projekt, Publikationen der Deutschen Gesellschaft für Photogrammetrie, Fernerkundung und Geoinformation e.V. Band 22, pp. 450-469
Farenzena, M., Fusiello, A. & Gherardi, R. (2009). Structure and motion pipeline on a hierarchical cluster tree. ICCV Workshop on 3-D Digital Imaging and Modeling, pp. 1489– 1496.
Fritsch, D., Grimm, A. Kremer, J., Rothermel, M & Wenzel, K. (2013) Bilddatenerfassung mit einem GyroCopter – Erste Erfahrungen zur „Photogrammetrie nach Bedarf“, Publikationen der Deutschen Gesellschaft für Photogrammetrie, Fernerkundung und Geoinformation e.V. Band 22, pp. 470-480 Haala, N., & Rothermel, M. (2012) Dense Multi-Stereo Matching for High Quality Digital Elevation Models in PFG Photogrammetrie, Fernerkundung, Geoinformation Jahrgang 2012 Heft 4 (2012), p. 331 – 343
Haala, N., Cramer, M., Weimer, F. & Trittler, M. (2011) Performance Test on UAV-based data collection IAPRS, Volume XXXVIII-1/C22, 6 pages, on CD
Hirschmüller, H., 2008. Stereo Processing by Semi-Global Matching and Mutual Information. IEEE Transactions on Pattern Analysis and Machine Intelligence, 30 (2), pp. 328 - 341.
Lowe, D. 2004: Distinctive Image Features from Scale-Invariant Keypoints. International Journal of Computer Vision. Vol. 60, No. 2, pp. 91-110.
Rothermel, M., Wenzel, K., Fritsch, D., Haala, N. (2012). SURE: Photogrammetric Surface Reconstruction from Imagery. Proceedings LC3D Workshop, Berlin, December 2012
Sigle, M. & Heuchel, T. 2001: MATCH-AT: Recent Developments and performance, Photogrammetric Week 01, pp. 189-194.