QUALITATIVE AND QUANTITATIVE EVALUATION OF THE LUMINANCE OF
LASER SCANNER RADIATION FOR THE CLASSIFICATION OF MATERIALS
Domenica Costantino, Maria Giuseppa Angelini
Department of Science Civil Engineering and Architecture (DICAR), Technical University of Bari Via Orabona, 4 - 70125 Bari, Italy; (d.costantino, mg.angelini)@poliba.it
KEY WORDS: TLS, Reflectance, Materials, Classification, Materic analysis
ABSTRACT:
The main aim of this experimentation is the evaluation of potentialities of terrestrial laser scanner technology to carry-out, beyond topographic and morphological detection, non-invasive materic analysis of the scanned objects, with the prospective to evaluate the conservation of historical landmarks and cultural heritage of which Italy is the world leading country. Coherent lasers in the visible light range may lead to optical diffraction phenomena thus allowing for structural investigation and chemical analysis of the scanned objects. Application of LST in the visible range ( = 585 nm) to a set of solid samples commonly applied in the construction (building) industry, differing in the crystallinity of their respective lattice, led to the following conclusions: a linear correlation has been established between degree of crystallization of solids and returning luminance of lasers after diffraction onto the solids surface; Gauss distribution of luminance data from diffraction onto less crystalline (plastics, glass) materials has been much narrow than more crystalline ones (metals, alloys, plasters). Both findings confirm that laser diffraction methods may be applied for fast materic determinations after simple LST scanning of solid samples. Bragg modeling of data, extensively applied for Xray diffraction methods (XRD), may be truly co-opted to Laser Scanning.
1. INTRODUCTION application fields. One of the main aspects of the TLS survey is the type of data acquired that contain information of 3D coordinate, reflectivity and, in case, RGB information (Pelagotti, 2008).
The resulting data quality depends on both specifications of the instruments of laser scanning and reflectance characteristics of different materials (Pfeifer, 2007).
The intensity measurement is mostly meant to enhance the range determination; therefore, the raw values of the intensity signal may be strongly modified by the instrument, without any information on these (Barazzetti, 2010).
However, the use of TLS intensity data, as well as reflectance information, is increasing, and knowledge on its reliability has become an important topic of study and discussion. TLS intensity values have been used e.g. in registration of different point clouds (Guarnieri, 2011).
The error sources of range measurements, e.g. detection errors of backscattered pulses dependent on the signal level, background illumination or the effects of different heights inside a laser spot, have been given by Thiel and Wehr (2004). It is necessary considered that the errors of range measurements depend on the distance and reflectivity of materials. In fact, for short distances (e.g. 10-60 m) and material with low reflectance or for larger distances (e.g.160 m) and high reflectance offsets are the same. However, the extreme reflections lead to a saturation of the signal into the internal sensor and therefore
lead to the elimination of data as mentioned (Boehler, 2003) e.g. the dark surfaces introduced an increasing range accuracy. Kersten et al. (2008) created also a test field for different laser scanner types. Amongst others the influence of the distance and incidence angle was investigated. Kukko et al. (2008) did a comprehensive study on the effects of different incidence angles on the intensity measurements of laser scanners. Through natural and artificial samples like different types of gravel and sand, brick material and clay aggregate, have been investigated by means of a goniometer to tilt the samples to defined incidence angles (0º to 70º).
The additional investigation of the influence of the wavelength, between 400 - 700 nm, demonstrated that the incidence angle effects are consistent between different wavelengths.
1.2 Aim of research
The idea of carrying out an experimental investigation on the possibility of conducting qualitative analysis of materials used in artistic and architectural constructions scanned by a terrestrial laser scanner (TLS), is the need to get information about the composition of materials investigated in order to assess their state of conservation, as well as the acquisition of topographical and metric data (Costantino, 2007).
This objective is marked by the recent issue of conservation of artistic and architectural heritage that Italy holds in such amount, to be able to consider the entire country as a “museum”.
Bragg’s law states that the phenomenon of diffraction (fig. 1) can be observed by having x-rays hit a crystal lattice which has atomic distance comparable with the wavelength of the hitting beam.
The simplest example of Bragg diffraction is the spectrum of colours that can be seen reflected by a Compact Disc: the short
distance between the tracks on the disc surface constitutes a diffraction grid and each component of the white light is diffracted with different angles , in accordance with the Bragg’s law.
Figure 1 – Bragg’s law
The operating standard procedures have always involved the adoption of invasive tests (destructive) by taking small fragments and subjecting to chemical analysis, or by using X-ray diffractometric techniques, based on the above-mentioned law.
The diffractometer is a device that generates X-rays which, striking the sample, are diffracted and conveyed to a controller to be processed. The detector collects diffraction effects and transforms them into measurable signals, the result is a graph or “diffractogram” containing, in function of the angles, the pulses that the detector reads every time the beam hit the substance. . On the diffractogram is performed an operation of indexing; we proceed to the identification of the mineralogical composition of the sample on the basis of the intensity of reflections and angles according to which they have occurred.
The X-ray diffraction trace obtained from the processing is compared with the libraries (database) of the JCPDS Power Diffraction File (about 80000 data) to define the mineralogical composition of the samples.
The aim has been to study the potential of TLS technique, which is completely non-invasive for the investigated and which allows to detect the inner crystalline structure of the material tested without removing or samples, with the ultimate aim to assess its state of conservation.
2. THE INVESTIGATED SAMPLES
Were carried out laboratory tests on samples of materials of a different kind and origin, in order to verify the possible albedo variation of the reflected laser beam coming from terrestrial laser instrumentation. In particular, using the TLS HDS 3000 Leica characterized by visible laser light in the region of the green, with a wavelength equal to 530 µm, and a continuous power output less 5 mW (Costantino, 2013). By literature it is already known that laser radiation in the visible frequency may cause optical interference as a response to interaction with solids crystalline materials and consequently, may establish luminous diffraction phenomenos that are characteristic of the crystalline structure of the material itself.
For the experiments conducted were selected, therefore, eight samples of materials characterized by a different degree of crystallinity as shown in the Table 1
For the experiments conducted were selected, therefore, eight samples of materials characterized by a different degree of crystallinity and shown in the Table 1.
Smooth glass opaque - white film plastic - (300x300x4 mm)
Hammered glass (300x300x4 mm)
Rough cement plaster (200x200x4 mm)
Smooth cement plaster (200x200x4 mm)
Polished Brass lapped (300x100x8 mm)
Polished steel lapped (300x200x8 mm)
Plain white lime plaster (300x300x5 mm)
Lime plaster colored rough (350x300x4 mm)
Table 1 - Samples investigated
In the following table (fig. 2) some crystallinity percent values for commonly used in building materials are shown by way of example.
Figure 2 – Crystallinity of materials
2.1 Acquisition of experimental data
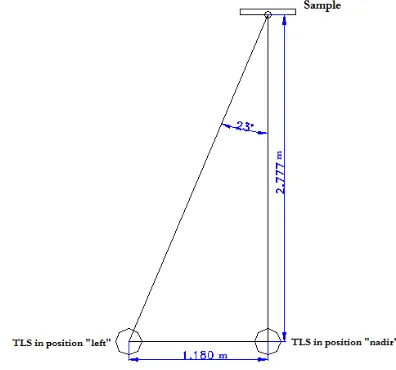
Figure 3 gives a schematic diagram of recovery of the scans with the system TLS compared to the samples in two different positions of acquisition. It may be noted that the data were acquired from a position almost nadir and from another angle of 23° to the nadir, referred to below as the nadir and left position . The distance between position left and nadir has been 1.180 mm, besides the distance of laser and sample in nadir position has been 2.777 mm.
Figure 3 - Relative positions of the sample compared to the system LST
The following Table 2 show some sample of material scans, displayed in environment Cyclone in mode Intensity Map where they show the variation of the intensity of the albedo with different colors.
Smooth glass
Polished Brass lapped
Polished steel lapped
Table 2 – e.g. scanning recovery nadir (left) and left (right) for some samples analyzed
2.2 Data acquisitions
The parameters acquired during scans were: the albedo (R), that represents the intensity of the electromagnetic wave incident return divided by the interval of wavelength (function: laser-object distance, the reflectivity of the material, angle of incidence on the scanned surface, the colour of the scanned surface, degree of surface roughness, object geometry, physical and chemical nature in relation to its molecular structure), the Cartesian coordinates relative to the center of the instrument expressed in mm and the RGB information.
As outset, the RGB information has been excluded by the analysis as it has been acquired with low resolution digital camera, characteristic of the laser used.
The values of these parameters have been extrapolated from the collection data in relation to the line corresponding to the position with 90° zenith and azimuth between ± 5° to the positions nadir (N) and left (L) (fig. 4).
Figure 4 - Layout for the data analysed
In Table 3 are reported the values of the albedo as a function of the geometric data of survey. For processing the data of the table relative to sixteen scans (8 samples for two shooting) were processed about 60000 points out of a total of 960000 ones detected.
!
" "
# $ " " "
# $ "
% ""
# $ % " "
#& ' $ (
!
" "
# $
# $ "
% " " " "
# $ % ""
#& ' $ ( "
"
! " "
# $
# $
% " "
# $ % "
#& ' $ ( " " "
" !
# $ "
# $ "
%
# $ % " "
#& ' $ ( "
Table 3 - Albedo as a function of the geometric data of survey for each sample
The calculation algorithm which considers the values found along the azimuthal range of about 10°, equal zenith angle of 90° has been used for accurate analysis.
In the following image the result of investigation (figg. 5-6).
Figure 5 - Albedo whit azimuth range of 10 °, nadir shooting
Figure 6 - Albedo whit azimuth range of 10 °, left shooting
2.3 Relationship between albedo and degree of crystallinity of materials
The albedo values, expressed in function of the variation of the angle of incidence and considering while the same value the other experimental parameters, change only in according to the degree of crystallinity of the materials scanned. An arbitrary scale of materials starting from more crystalline, such as steel, until you get to the less crystalline such glass has been adopted, therefore.
All other materials have been distributed between steel and glass in congruous position as reported in literature.
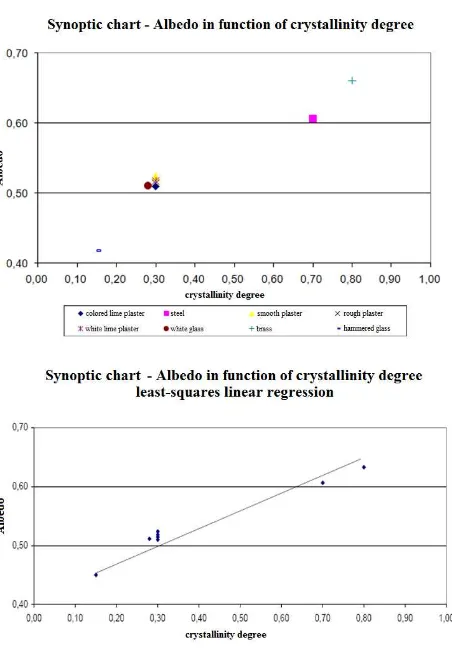
The following diagram (fig. 7) show almost linear trend between the value of the average albedo (R) and the degree of crystallinity of the materials investigated.
Figure 7 – Albedo in function of the degree of crystallinity of the materials
By the least squares regression of the albedo data in function of the crystallinity degree it can deduce a linear trend, in spite of the simplifications made on the degree of crystallinity. The regression line obtained confirm, then, the good correlation between parameters; this allows to state that the most crystalline materials have, higher albedo compared to amorphous ones. Therefore, in addition to the model assumed reflectivity (dependent on colour, roughness, distance, incident angle, as well as other minority parameters) are considered also the additional effects related to the interaction of the laser pulse with the crystalline planes, corresponding to the external plans of the atomic lattice of the material scanned, like on optical diffraction phenomenon suffered by the incident laser beam after its interaction with the materials.
2.4 Analysis of the experimental data considering the diffraction optical laser
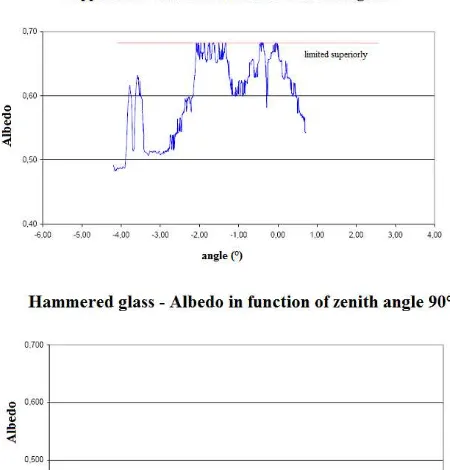
The limit of albedo values of crystallinity already shown in Table 3 and highlighted for some materials in the following diagrams are a confirmation of result described in previous chapters (fig. 8).
The result interpretation can be explained in function of the different interference luminous phenomena coherent laser radiation are incident on different materials scanned.
Figure 8 - Minimum values of albedo in correspondence of non-crystalline glassy materials
This phenomenon allows the identification both of the geometrical aspects of the scanned object, but of its qualitative chemical composition in according to criteria previously described in the crystallographic area with diffraction analysis techniques RX.
3. CONCLUSIONS
Based on the phenomena of optical diffraction, the coherent laser beams (appropriate frequency and energy in the visible, enable it to interpret) enable it to interpret the external lattice planes of crystalline solids.
As is known, these phenomena affect the crystalline planes deeper when they are used in high-energy electromagnetic radiation, which for more than half a century, are applied in the techniques of diffractometers structural analysis.
The experiment made it possible to highlight the results described below. The albedo is linearly related to the degree of crystallinity of the material scanned, at the same other conditions of survey (brightness, distance between the source object, the environmental conditions of humidity and temperature, roughness and surface colour). The degree of roughness of the surface assumes importance in the present context, only when the magnitude of this is comparable to the wavelength of the incident radiation.
The Gaussian distributions of the values of albedo have higher variance for samples of higher crystallinity, instead, the less crystalline distributions have a lower variance (fig. 9).
This result is further confirmation of the phenomena of optical diffraction of the laser beams coherent operations TLS. The incident light beam is refracted with greater magnitude for materials with highest degree of crystallinity, giving rise to phenomena of optical dispersion with a wider distribution of the albedo data (e.g. metals, steel, brass). For materials with less
crystalline or amorphous it have phenomena of localized optical dispersion.
Figure 9 - Gaussian distribution of the albedo data for the various materials investigated
4. FUTURE PROSPECTS
Even though it is preliminary, this study has showed some correlations between the values of luminance and the degree of crystallinity of the investigated materials. In accordance with the application of methods based on Bragg’s law, those correlations might lead to a unambiguous identification of the qualitative-quantitative nature of those materials scanned by a terrestrial laser scanner. The capability to assess the crystalline nature of materials and consequently to identify their chemical and mineralogical composition opens new horizons for expeditious survey in range of architectural and artistic works and of civil engineering in the general meaning. Some more detailed studies are scheduled to be conducted on additional materials with different crystallographic characteristics; specifically, they are to investigate some materials with crystal metallic structures different for nature and composition (e.g., non-ferrous materials, different alloys), structures with various degrees of crystallinity such as commercial plastics (e.g., polyethylene derivatives, PE; polyvinyl chloride, PVC; polimetitil methacrylic, PMMA, polyesters, PET), amorphous structures such as glassy ones different in nature and origin. In the meantime, some experiments have started in order to compare their own results with results obtained previously by the phase-measurement TLS method.
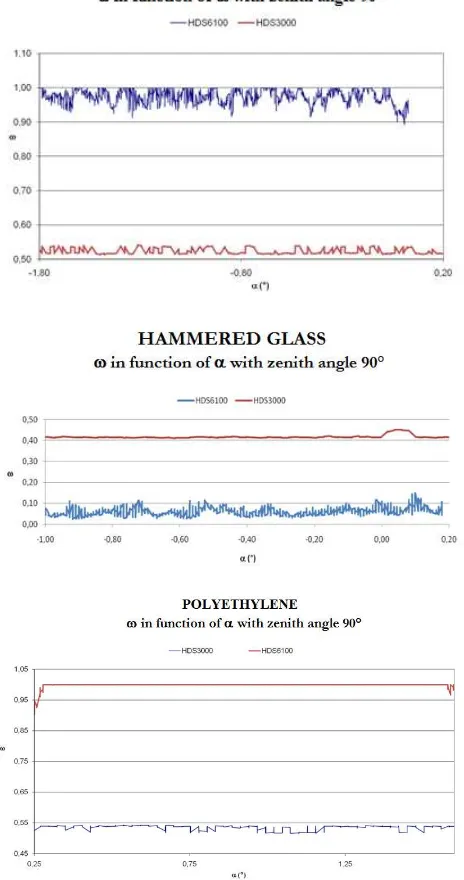
In particular, the Leica HDS 6100 device has been used on the same samples observing that (fig. 10):
• the HDS 6100 is more efficient at detecting the degree of crystallinity of the material scanned; in particular it detects, maximum values of albedo (on the order of 1) such as polyethylene; moreover it detects crystalline materials constituting the composite of plaster with high values of albedo (>0.80), whether or not they are smooth, rough, lime;
• glass, material known to be amorphous (non-crystalline), is detected with very low albedo values; in particular those values are on the order of 0.05 for frosted glass and even higher for smooth glass;
• since metallic materials (steel and brass) have a very high crystallinity (the highest in the range of the investigated materials), the corresponding values of albedo are so high
that they cannot be detected by the instrument (see data related to the overflow polyethylene) (Voegtle, 2008); • the HDS 3000 detects all above-mentioned materials (with
higher and lower crystallinity) with values of albedo significantly lower (on the order of about 0.50); the detection of crystallinity is less sensitive even if it is more versatile since its spectrum of detection (reading range) of albedo is wider than HDS 6100 one;
• in prospect, it would be worth understanding whether it is possible to extend the maximum reading’s scale of HDS 6100 device in order to avoid the assumed overflow that prevents from reading the values of materials with higher crystallinity (Kaasalainen, 2009);
• finally it is necessary to arrange a working plan that covers materials fully characterized in terms of crystallinity (crystallinity-controlled polymeric materials) to investigate the their behaviour by HDS 6100 device.
Figure 10 – Comparison between HDS 3000 and HDS 6100
5. BIBLIOGRAPHY References from Journals:
Barazzetti, L., Remondino, F., Scaioni, M., Lo Brutto, M., Rizzi, A., Brumana R., 2010. Geometric and radiometric analysis of paintings. International Archives of Photogrammetry, Remote Sensing and Spatial Information Sciences, XXXVIII (5), pp. 62-67.
Boehler, W., Heinz, G., Marbs, A., 2001. The potential of non-contact close range laser scanners for cultural heritage recording. International Archives of Photogrammetry, Remote Sensing and Spatial Information Sciences, XXXIV (5/C7), pp. 430-436.
Thiel, K.-H., Wehr, A., 2004. Performance Capabilities of laser scanners – an overview and measurement principle analysis. International Archives of Photogrammetry, Remote Sensing and Spatial Information Sciences, 36 (8), pp. 14-18.
Kukko, A., Kaasalainen, S., Litkey, P., 2008. Effect of incidence angle on laser scanner intensity and surface data. Applied Optics, 47 (7), pp. 986-992.
Kaasalainen, S., Krooks, A., Kukko, A., Kaartinen, H., 2009. Radiometric calibration of terrestrial laser scanner with external reference targets. Remote Sensing, 1(3), pp. 144-158.
Guarnieri, A., Vettore, A., Camarda, M., Costantino, D., 2011. Automatic Registration of Large Range Datasets with Spin-Images. Journal Of Cultural Heritage, 12, pp. 476-484.
Costantino, D., Angelini, M. G., 2013. Integrated survey to extract date for structural investigations. Journal of Heritage in the Digital Era, 2 (1), pp. 49-74.
References from Other Literature:
Pelagotti, A., Del Mastio A., De Rosa, A., Piva, A., 2008. Multispectral imaging of paintings – A way to material identification, IEEE Signal Processing Magazine, 25(4), pp. 27-36.
Pfeifer, N., Dorninger, P., Haring, A., Fan, H., 2007. Investigating terrestrial laser scanning intensity data: quality and functional relations. International Conference on Optical 3-D Measurement Techniques, VIII, pp. 328 – 337.
Costantino, D., Angelini, M. G., Caprino, G., 2007. Rapid approach of integrated survey for the conservative analysis of pictures. The CIPA International Archives for Documentation of Cultural Heritage, XXI-2007 (I), pp. 247-252.
Boehler, W., Bordas V., M., Marbs, A., 2004. Investigating Laser Scanner Accuracy. Proceedings of XIXth CIPA WG 6, International Symposium, Antalya, Turkey, pp. 696 -702.
Kersten, T., Mechelke, K., Lindstaedt, M., Sternberg, H., 2008. Geometric accuracy investigations of the latest terrestrial laser scanning systems. FIG Working Week 2008 – Integrated Generations, Stockholm.
Voegtle, T., Wakaluk, S., 2009. Effects on the measurements of the terrestrial laser scanner HDS 6000 (Leica) caused by different object materials. ISPRS Congress Laserscanning09, Paris, France.