URBAN BUILDING COLLAPSE DETECTION USING
VERY HIGH RESOLUTION IMAGERY AND AIRBORNE LIDAR DATA
XueWang *, Peijun Li
Institute of Remote Sensing and GIS, Peking University, Beijing 100871, PR China - [email protected],[email protected]
KEY WORDS: urban building collapse detection, very high resolution image, airborne LiDAR data, multi-level, One-Class Support Vector Machines (OCSVM), image segmentation
ABSTRACT:
The increasing availability of very high resolution (VHR) remotely sensed images makes it possible to detect and assess urban building damages in the aftermath of earthquake disasters by using these data. However, the accuracy obtained using spectral features from VHR data alone is comparatively low, since both undamaged and collapsed buildings are spectrally similar. The height information provided by airborne LiDAR (Light Detection And Ranging) data is complementary to VHR imagery. Thus, combination of these two datasets will be beneficial to the automatic and accurate extraction of building collapse. In this study, a hierarchical multi-level method of building collapse detection using bi-temporal (pre- and earthquake) VHR images and post-event airborne LiDAR data was proposed. First, buildings, bare ground, vegetation and shadows were extracted using post-post-event image and LiDAR data and masked out. Then building collapse was extracted using the bi-temporal VHR images of the remaining area with a one-class classifier. The proposed method was evaluated using bi-temporal VHR images and LiDAR data of Port au Prince, Haiti, which was heavily hit by an earthquake in January 2010. The method was also compared with some existing methods. The results showed that the method proposed in this study significantly outperformed the existing methods, with improvement range of 47.6% in kappa coefficient. The proposed method provided a fast and reliable way of detecting urban building collapse, which can also be applied to relevant applications.
1. INTRODUCTION
Timely and accurate post-earthquake damage information is of great importance to disaster assessment and management. With the development of remote sensing technology, the availability of very high resolution (VHR) satellite imagery makes it possible to detect and assess building damage in the aftermath of earthquakes.
Many studies have been focused on building damage detection these years. The fundamental principle of building damage detection is to automatically detect changes between bi-temporal (pre- and post- earthquake) images of the quaked region. Therefore, traditional change detection methods can be applied directly (e.g. Al-Khudhairy et al. 2005, Huyck et al. 2002, Matsumoto et al. 2006, Pagot and Pesaresi 2008). However, existing methods have some defects. There is much spectral similarity between damaged and undamaged (intact) buildings, as well as buildings and other man-made structures with impervious surface. As a consequence, accuracy of the detection is relatively low when using spectral bands alone. Aimed at solving the problem discussed above, other than using spectral bands, some researchers use texture to improve the detection accuracy (Coburn and Roberts 2004) and some use landscape Metrics to aid the detection (Eva. S. M. 2011). In these years, many studies have used LiDAR data and VHR images to extract building (e.g. Vu, etal. 2009) and have had many good results. But few studies have used LiDAR data and VHR images to detect building collapse. So, in this study, we used Light Detection And Ranging (LiDAR) data to distinguish collapsed buildings, undamaged buildings and bare ground which have spectral similarities, as they have different heights.
2. METHODS
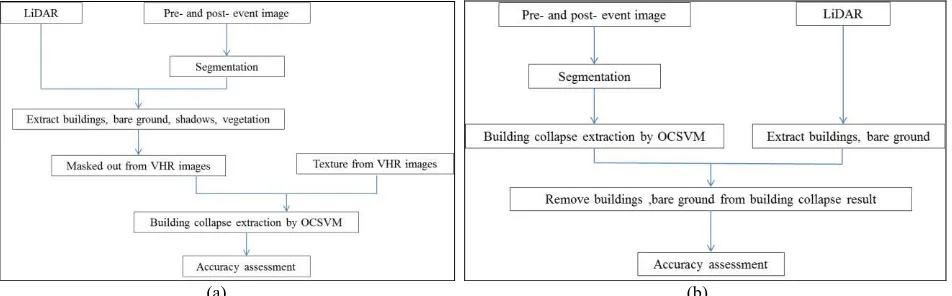
In this study, a hierarchical multi-level method of building collapse detection using bi-temporal (pre- and post-earthquake) VHR images and post-event airborne LiDAR data was proposed. Since there are many types and extents of building damage, with building collapse being the most severe one, this study mainly focused on detection of building collapse. As the object-based analysis methods generally showed better performance than pixel-based methods (e.g. Al-Khudhairy et al. 2005, Matsumoto et al. 2006), all the classifications in this study were implemented after image segmentation. After the segmentation, buildings, bare ground, vegetation and shadow were extracted using post-event image and LiDAR data and masked out in order to diminish the spectral confusion among different ground features. Then In order to improve the accuracy, we created a new image by adding texture bands which were calculated from VHR images to the remaining area of the bi-temporal VHR images. Lastly, we extracted building collapse from the new image with the One-Class Support Vector Machine (OCSVM) classifier. We also used a comparative method to extract building collapse. First, building collapse was extracted using the bi-temporal VHR images with the OCSVM classifier. Secondly, buildings, bare ground were extracted using LiDAR data. Thirdly, buildings, bare ground were removed from building collapse result. The proposed method and comparative method were showed in Figure 1. The whole procedure adopted in this study is described in detail in the following section.
2.1 Image segmentation
Image segmentation was applied to bitemporal data using Fractal Net Evolution Approach (FNEA) (Yu et al., 2006) algorithm in the eCognition software package. By comparing
(a) (b)
Figure 1. (a)Building collapse detection method proposed in this paper (b) Comparative method
detection results produced by using different levels of segmentation, it was indicated that a compact and dense segmentation at a relatively low level of segmentation tends to produce higher accuracy. As earthquake resulted in deformation from original shapes as well as dense and irregular edges, smaller segments could better delineate post-event features of land cover.
2.2 Multiband texture by Multivariate Variogram
In order to improve the accuracy of bitemporal classification, image texture was also included. A multiband texture measured using Multivariate Variogram was used. Multivariate Variogram (MV) is a geostatistic tool, which is derived from the Univariate Variogram (UV) function defined in equation (1).
1
2 increments between the pixel pair, x and x+ h .The experimental UV can be computed as:
2where N (h) is the number of pixel pairs with a certain distance vector h, dn(.) is the digital numbers of pixel xi and xi+ h. Therefore, γexp(h) is the semivariance of digital values between the pixel pairs, measuring the spatial variability of radiometric data within a single band.
As for multispectral images, MV is derived to quantify the joint spatial variability of two or more bands. For an image of p bands, MV is defined as:
2
2G h AVGDN x DN x + h I DN x DN x + h TAVG d h (3)
where DN(x) is the p-dimension row vector, I is a p× p identity matrix, T is the transpose of the matrix. AVG[.] is the arithmetic average of the Euclidean distance in the p-dimension space. G(h) characterizes the joint autocorrelation of the p bands of a multispectral images. In this study, MV was used as a multiband texture measure derived from spectral bands of multispectral images. If the spectral signatures within a certain region share much similarity, a low MV value will be produced, and vice versa.
The experimental MV (equation 3) can be used to calculate multiband texture and multitemporal texture. An appropriate window size and a lag distance h are first determined. For a specific lag distance h, the average of the function values, considered as the multiband texture, is assigned to the central pixel of the moving window. Thus, two crucial parameters
should be carefully considered: window size and lag distance h (including size and direction).
As for window size, a large window might contain several adjacent land cover types, thus reducing the classification accuracy. On the other hand, a small window might fail to correctly characterize the spatial structures. In this study, the selection of window size was done by trial and error. The size that could maximize the classification accuracy was chosen as the optimal window size.
The size of lag distance can be from 1 up to half of the window size. However, the value of the lag distance of multiband texture was assigned as 1 in this study, for it has been proved to be the best distance to describe the spatial correlation of the adjacent pixels (Chica-Olmo and Arbarca-Hernandez 2000).
Since collapsed buildings usually have unsmooth surfaces, the pixels located in each building tend to have low spatial correlation spectrally, which leads to a high MV value. Yet MV values are also high on boundaries of adjacent land covers, regardless of the earthquake. That will reduce the effectiveness of multiband texture on the detection of damaged buildings. In order to minimize the effects of edges and boundaries, we calculated MV values on all directions and chose the minimum one as the final MV value. In this way, MV values of pixels on edges and boundaries became relatively low, for their values usually had a big change only in a certain direction, while MV values of pixels in damaged buildings remained high in all directions. Suppose the directions of lag distance h1, h2, h3 and h4 are east-west (E-W), south-north (S-N), southeast-northwest (SE-NW) and southwest-northeast (SW-NE) in turn, then the MV value for multiband texture used in this study is:
2 2 2 2
2.3 Removal of Vegetation, building, bare ground
In order to remove vegetation, building and bare ground, we first extracted them from post-event image and LiDAR data and then masked out. After image segmentation, average values of uncollapsed buildings. So, two height thresholds h1 and h2 were set to separate objects into 3 height levels (h<h1, h1≤h≤h2, h>h2).
Bare ground was identified as the segments with the heights lower than h1 and the NDVI values lower than the specified
threshold (i.e. non-vegetation). And buildings were identified as the segments with the heights higher than h2 and the NDVI values lower than the specified threshold (i.e. non-vegetation). After detection, vegetation, building, bare ground were removed from VHR bi-temporal images.
2.4 Removal of shadows
In order to remove shadows, we first extracted them from post-event image then masked out.
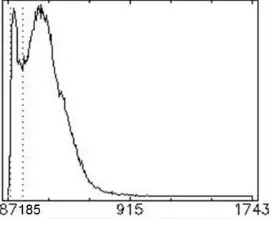
We applied a histogram thresholding method for shadow detection, which has been successfully used in many previous studies (e.g., Shu & Freeman, 1990; Shettigara & Sumerling, 1998; Dare, 2005; Chen et al., 2007). The principle of a histogram thresholding method is based on the intensity difference of shaded and non-shaded areas. It assumes the statistical units. A bimodal histogram splitting method was used to determine the optimum threshold value of 185 for separation of shaded pixels from non-shaded pixels.
In this study, we used the brightness, which was defined as the mean of the three bands–NIR, red, and green–to determine the threshold value for shadows and non-shadows. Figure 2 shows the histogram of brightness for the study site, using pixels as statistical units. The optimum threshold value of 185 was determined by a bimodal histogram splitting method, which provides a simple, but robust way for threshold level selection by identifying the value at the valley between the two peaks in the histogram as the threshold for shadows and non-shadows (Dare, 2005; Chen et al., 2007).
We also examined the histogram of brightness based on objects generated from image segmentation, as opposed to pixels, and did not find an obvious threshold value between shaded and non-shaded objects. Therefore, we applied the threshold value of 185, as determined from the pixel-based histogram for segmented objects, and compared it with other threshold values. Finding that the threshold value of 185 provided the optimum threshold for the segmented objects, we chose to use a threshold value of 185 to distinguish shaded objects from non-shaded objects. A comparison of the pixel-based and object-based shadow detection was conducted. The overall accuracy of results for shadow detection from the object-based method was slightly higher than that of the pixel-based one.
After detection, shadows were removed from VHR bi-temporal images.
2.5 Bitemporal classification using One Class Support Vector Machine
In this study, direct bi-temporal classification was adopted and One Class Support Vector Machine (OCSVM) was selected as the classifier to effectively detect the building damage using combined spectral and texture information. As a recently developed one-class classifier, OCSVM has two main attractions: first, it requires training samples from one class only, which is called the target class or the class of interest. Second, it produces results that extract only the target class, rather than all classes extracted by conventional classifiers.
Li et al. (2010) used OCSVM for change detection of one specific land cover class and validated its effectiveness for change detection. Therefore, it was used in this study to detect post-earthquake building collapse. After the removal of vegetation, buildings, bare ground, shadows, the remaining areas of bi-temporal images acquired before and after earthquake and texture bands calculated from the bi-temporal images were used in classification. The only target class was the collapsed building class. Since inclusion of samples from the outlier class (non-target class) could improve the classification accuracy (Li et al, 2010), besides training samples from the target class, some outlier samples, mainly from non-damage class, were also selected and used for classification.
3. STUDY AREA AND DATA
The study area is Port au Prince, Haiti (Figure 3), a densely populated urban area. The area was heavily hit by the earthquake that occurred on 12 January 2010. A large number of buildings in the urban area were damaged and collapsed.
Figure 3. Location map of the study area
The dataset used in this study includes pre-event Worldview-2 data acquired on 09 January 2010 and post-event QuickBird data acquired on 15 January 2010. The Worldview-2 data consist of eight multispectral bands with 2.0 m resolution and a panchromatic band with 0.5 m resolution. The QuickBird data consist of four multispectral bands with 2.4 m resolution and a panchromatic band with 0.6 m resolution.
The parameters of the data acquisition are shown in Table 1. The multispectral and panchromatic images of both datasets were fused to produce pan-sharpened multispectral images with a pixel size of 0.6 m and 0.5 m, respectively, using the Gram-Schmidt pan-sharpening transformation procedure (Laben and Brower, 2000) implemented in the ENVI software package. The two-date images were then co-registered with a root mean square error of less than 0.5 pixels and were resampled to a common pixel size of 0.5 m.
A portion of the pan-sharpened image of 3,100 × 2,800 pixels was finally used in the study (Figure 4).
Table 1. DATA CHARACTERISTICS AND SATELLITE POSITION INFORMATION FOR BOTH DATASETS
WV: WorldView; QB: QuickBird; MS: multispectral; PAN: panchromatic.
(a) (b) (c)
Figure 4. (a) Pre- and (b) post event pan-sharpened multispectral VHR images of the study area. The image size is 3,100 × 2,800 pixel of 0.5 × 0.5m each. (c) post event nDSM of study area
For building damage detection, 12,085 pixels from the building damage were selected for training the classifier (i.e., OCSVM) through visual interpretation.
For accuracy assessment, 12469 pixels were directly selected as test samples for target class (building damage class) through visual interpretation, while 40170 pixels were randomly generated as test samples for outlier class. The real classes of all test samples were ensured after check.
LiDAR data was acquired on January 21st, with a height accuracy of 1m. The normalized Digital Surface Model (nDSM) was first generated. The obtained nDSM was then co-registered with pan-sharpened Quickbird image. Like the VHR images, 3,100 × 2,800 pixels of nDSM were finally used in the study (Figure4. (c)).
4. RESULTS AND DISCUSSION
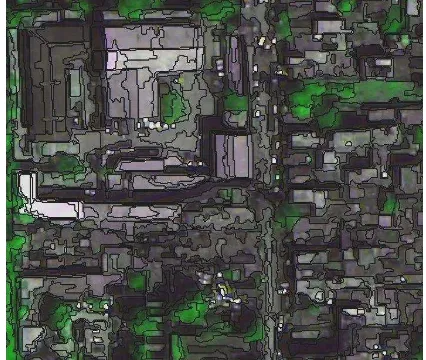
Figure 5 shows the selected segmentation result overlapped on pre-event imagery. Most buildings and vegetation areas were over segmented on purpose. The mean value of each band of pixels within each segment was computed and then used as spectral and textural features of the segment in direct multitemporal classification by the OCSVM.
The results of building collapse detection by different methods are listed in table 2. From the table, using comparative method only obtained an overall accuracy of 46.11% and a kappa coefficient of 14.56%. The kappa coefficient was particularly low, which indicated the indiscernibility of the use of this method.
By using hierarchical multi-level method proposed in this study, both overall accuracy and kappa coefficient were largely improved. Overall accuracy increased 38% and kappa coefficient increased 47.6%, which indicated that commission
and omission errors for the collapse class were significantly
reduced. The producer’s accuracy attained 88.64%, which indicated that this method could detect most of the collapsed buildings without wrongly identifying many uncollapsed areas as collapsed ones. For the class collapsed or uncollapsed, it
produced both high producer’s and user’s accuracy. This
implies that the commission and omission errors for the target class have significantly declined.
Figure 5 A portion of the segmentation result (black lines) overlapped on the false colour composite image (band 3, 4, 2 as R, G, B).
Sensor Spatial resolution (m) Acquisition date
Acquisition time (GMT) Off-nadir view angle Satellite azimuth
Satellite elevation
WV-2 MS 2.0 9-Jan 15:43:33-15: 25.2° 321.4° 61.6°
WV-2 PAN 0.5 2010 43:38
QB MS 2.4 15-Jan 15:23:9-15: 20.6° 46.2° 68.1°
QB PAN 0.6 2010 23:17
Table 2. Building collapse detection results by OCSVM using different methods
methods
collapsed uncollapsed
OA Kappa
PA % UA % PA % UA %
comparative method 44.46 57.89 44.75 83.22 46.11% 0.1456
hierarchical multi-level method proposed in this study 88.64 61.67 82.9 95.92 84.26% 0.6216
PA: producer’s accuracy; UA: user’s accuracy; OA: overall accuracy
(a) (b)
Figure 6 detection result by using (a) comparative method (b) hierarchical multi-level method proposed in this study.
Figure 6 shows the detection result by using comparative method and hierarchical multi-level method proposed in this study. The white areas represent detected building damage class (target class).
(a) (b)
(c) (d)
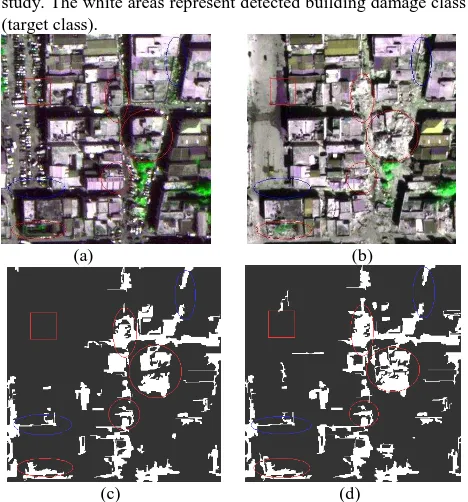
Figure 7 A close-up look of the building damage detection result by the OCSVM using different methods: (a) a local neighborhood on pre-quake imagery; (b) the neighborhood on post-quake imagery; (c) detection result, using comparative method; (d) using hierarchical multi-level method proposed in this study; Color assignments: white: building collapsed, black: uncollapsed. Within red circle: collapsed, within blue circle: uncollapsed.
To further compare the detection results obtained by using different methods, a close-up view of a damaged neighborhood is presented in Figure 7. According to (a) and (b), areas within red circles are collapsed buildings while areas within blue circles are uncollapsed buildings. By comparison of the area within red circles, many collapsed buildings were not fully detected using comparative method (see (c)), while most of the collapsed buildings were detected accurately by using proposed method (see (d)). By comparison of the area within blue circles, many uncollapsed buildings were wrongly detected as collapsed buildings using comparative method (see (c)), while less and less area of uncollapsed buildings were wrongly detected by using proposed method (see (d)). This close-up view is consistent with analyses of table 2.
5. CONCLUSIONS
In this study, a hierarchical multi-level method of building collapse detection using bi-temporal (pre- and post-earthquake) VHR images and post-event airborne LiDAR data was proposed. The proposed method was evaluated using bi-temporal VHR images and LiDAR data of Port au Prince, Haiti, which was heavily hit by an earthquake in January 2010. The method was also compared with some existing methods. The results showed that the method proposed in this study significantly outperformed the existing methods with improvement of 8% in overall accuracy and 47.6% in kappa coefficient. The proposed method provided a fast and reliable method to detect urban building collapse, which can also be applied to relevant applications.
6. REFERENCES
AL-KHUDHAIRY, D.H.A., CARAVAGGI, I. and GIADA, S., 2005. Structural damage assessments from Ikonos data using change detection, object-oriented segmentation, and classification techniques. Photogrammetric Engineering and Remote Sensing, 71, pp. 825–837.
Chen, Y., Wen, D., Jing, L., & Shi, P., 2007. Shadow information recovery in urban areas from very high resolution satellite imagery. International Journal of Remote Sensing, 28(15), pp.3249−3254.
CHICA-OLMO, M. and ABARCA-HERNAˆ NDEZ, F., 2000. Computing geostatistical image texture for remotely sensed data classification. Computers & Geosciences, 26, pp. 373– 383.
COBURN, C.A. and ROBERTS, A.C.B., 2004, A multiscale texture analysis procedure for improved forest stand classification. International Journal of Remote Sensing, 25, pp. 4287–4308.
Dare, P. M., 2005. Shadow analysis in high-resolution satellite imagery of urban areas. Photogrammetric Engineering & Remote Sensing, 71(2), pp.169−177.
Eva S M., 2011, Change Detection Applying Landscape Metrics on High Remote Sensing Images[J], Photogrammetric Engineering & Remote Sensing,77(10): 1045–1056.
HUYCK, C.K., MANSOURI, B., EGUCHI, R.T., HOUSHMAND, B., CASTNER, L.L. and SHINOZUKA, M., 2002. Earthquake damage detection algorithms using optical and ERS-SAR satellite data – application to theAugust 17, 1999 Marmara, Turkey, earthquake. Proceedings 7th US National Conference on Earthquake Engineering, Boston, MA (CD-ROM), (Buffalo, NY: Multidisciplinary Center for Earthquake Engineering Research).
Laben, C.A. and B.V. Brower, 2000. Process for enhancing the spatial resolution of multispectral imagery using pan-sharpening, U.S. Patent 6011875, URL:
http://www.freepatentsonline.com/6011875.html (last date accessed: 19 July 2011).
Li, Peijun , Xu, Haiqing and Guo, Jiancong, 2010. Urban building damage detection from very high resolution imagery using OCSVM and spatial features. International Journal of Remote Sensing, 31: 13, pp. 3393—3409.
MATSUMOTO, K.,VU, T.T. andYAMAZAKI, F., 2006. Extraction of damaged buildings using high resolution satellite images in the 2006 central Java earthquake. Proceedings of 2006 Asian Conference on Remote Sensing (ACRS). Available online at: http://www.aars-acrs.org/acrs/proceeding/ACRS2006/Papers/P-4_Q62.pdf
(accessed May 2009).
PAGOT, E. and PESARESI, M., 2008. Systematic study of the urban postconflict change classification performance using spectral and structural features in a support vector machine. IEEE Journal of Selected Topics in Applied Earth Observations and Remote Sensing, 1, pp. 120–128.
Shettigara, V. K., & Sumerling, G. M., 1998. Height determination of extended objects using shadows in SPOT images. Photogrammetric Engineering & Remote Sensing, 64(1), pp.35−44.
Shu, J. S., & Freeman, H., 1990. Cloud shadow removal from aerial photographs. Pattern Recognition, 23(6), pp.647−656. Vu T.T., Yamazaki F. and Matsusuoka M., 2009, Multi-scale
solution for building extraction from LIDAR and image data, International Journal of Applied Earth Observation and Geoinformation, 11:281-289.
Yu, Q., P. Gong, N. Clinton, G. Biging, M. Kelly, and D. Schironkauer, 2006. Object-based Detailed Vegetation Classification with Airborne High Spatial Resolution Remote Sensing Imagery. Photogrammetric Engineering and Remote Sensing, 72(7), pp. 799-812.