www.elsevier.nlrlocateraqua-online
Effect of dietary protein level on growth and body
composition of juvenile spotted sand bass,
Paralabrax maculatofasciatus, fed practical diets
C.A. Alvarez-Gonzalez
´
a,), R. Civera-Cerecedo
b,
J.L. Ortiz-Galindo
a, S. Dumas
a, M. Moreno-Legorreta
a,
T. Grayeb-Del Alamo
aa
Laboratorio de Biologıa Experimental, Centro Interdisciplinario de Ciencias Marinas,´
AÕ. I.P.N. srn, Col. Playa Palo de Santa Rita, P.O. Box 592, 23096 La Paz, B.C.S., Mexico
b
S.C. Laboratorio de Nutricion Acuıcola, Centro de In´ ´ Õestigaciones Biologicas del Noroeste, P.O. Box 128,´
23090 La Paz, B.C.S., Mexico
Received 31 January 2000; received in revised form 5 September 2000; accepted 6 September 2000
Abstract
A preliminary feeding trial was made to determine the effect of dietary protein level on growth Ž . and body composition of juvenile spotted sand bass Paralabrax maculatofasciatus 9.5 g . Fish
Ž .
were randomly distributed in nine 600-l circular tanks 42 fishrtank , which were connected to a closed water recirculating system. Fish were fed practical diets for 93 days containing increasing
Ž . Ž .
protein levels 40%, 45%, and 50% . Significant lower weight P-0.05 was observed in fish fed Ž .
the 40% protein diet 43.1 g compared to fish fed higher proteins diets. Growth rates, evaluated
b X Ž .
by an exponential model Ysae , and gross energy retention GER were significantly higher in
Ž .
fish fed the 45% and 50% protein diets than the fish fed the 40% diet P-0.05 . No significant difference among dietary protein levels was detected for the other growth variables measured, nor for the proximate composition of the whole fish, liver, or muscle. The use of a practical diet containing at least 45% protein is appropriate for growth of spotted sand bass juveniles.q2001
Elsevier Science B.V. All rights reserved.
Keywords: Paralabrax maculatofasciatus; Protein requirements; Recirculating system; Mariculture
)Corresponding author. Tel.:q52-112-2-53-44; fax:q52-112-2-53-22.
Ž .
E-mail address: [email protected] C.A. Alvarez-Gonzalez .´
0044-8486r01r$ - see front matterq2001 Elsevier Science B.V. All rights reserved.
Ž .
1. Introduction
Marine fish culture in Mexico is still at an experimental level. Spotted sand bass
Paralabrax maculatofasciatus has been identified, among other fish, as a potential
Ž .
candidate for aquaculture Matus-Nivon et al., 1990 . The distribution of this species
´
Ž .
ranges from Monterey Bay, USA to Mazatlan, Sinaloa, Mexico Miller and Lea, 1972 .
Ž
It inhabits shallow waters up to 60 m in northwest Mexico Thomson et al., 1987;
.
Lluch-Cota, 1995 , and is eurythermal because it tolerates temperatures from 7.58C to
Ž .
328C Thomson et al., 1987 . Spotted sand bass is carnivorous, preying mainly during daytime on small crustaceans, bivalves, gastropods, cephalopods, ophiuroids, and fish
ŽFerry et al., 1997 . This Serranid species shows adaptability to culture conditions and.
low territoriality. Sexual maturation and artificial propagation have been successfully
Ž .
done Rosales-Velazquez, 1997 . The spotted sand bass can reach about 45-cm total
´
Ž .
length Van der Heiden, 1985 , and its white meat is of excellent quality; however, very little information is available on its nutritional requirements. Protein is the most expensive component in fish feeds; hence, optimizing dietary concentrations is essential to minimize feed cost and to formulate feeds, which allow good growth and protein utilization. The dietary protein level needed for maximum growth of carnivorous species
Ž .
under culture conditions has been reported to vary from 40% to 55% Tucker, 1998 . The only information available on the nutritional requirements of spotted sand bass juveniles indicate those at 2.5-g mean weight need at least 55% dietary protein for best growth when casein is the sole protein source. However, in terms of feed conversion
Ž
ratio apparently the requirement could be lower Anguas-Velez, personal communica-
´
.tion . We need to determine the requirements for each species and for each stage of development to produce appropriate practical diets. In the present study, the effect of the dietary protein level on growth and body composition of spotted sand bass juveniles fed practical diets was evaluated.
2. Materials and methods
Ž .
Three-month-old juveniles 9.5"1.5 g were selected from fish produced at the Unidad Piloto de Maricultivo CICIMAR-IPN, La Paz, Mexico. Fish were randomly
Ž .
distributed 42rtank in nine 600-l tanks. These tanks were connected to an enclosed water recirculating system of 22 cylindrical fiberglass tanks. Photoperiod was set to 13:11 light:dark cycle and temperature ranged from 238C to 258C. Salinity varied
Ž . Ž
between 30‰ and 35‰. Total ammonia 0.02 and 0.49 mgrl and nitrite 0.02 and 0.71
. Ž .
mgrl were measured using spectrophotometric methods Strickland and Parsons, 1972 . Dissolved oxygen during the experiment ranged between 6.2 and 8.0 mgrl, and was
Ž .
measured using a YSI oximeter model 58 Ohio, USA .
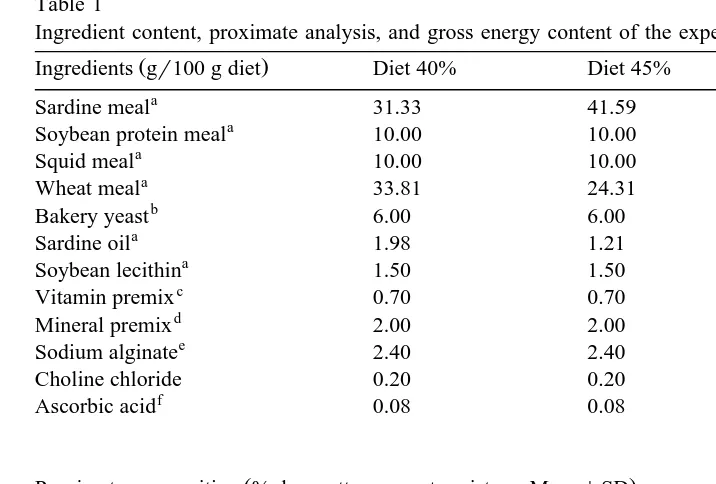
Three experimental diets were formulated to contain 40%, 45%, or 50% crude protein
Ždry matter basis . The protein level was adjusted by replacing sardine meal with wheat. Ž
meal. The diets were isocaloric and the total lipid level was maintained constant Table
.
Table 1
Ingredient content, proximate analysis, and gross energy content of the experimental diets
Ž .
Ingredients gr100 g diet Diet 40% Diet 45% Diet 50%
a
Sardine meal 31.33 41.59 51.96
a
Soybean protein meal 10.00 10.00 10.00
a
Proximate composition % dry matter, except moisture. Mean"SD
Crude protein 41.92"0.26 46.37"0.09 52.52"0.09 Ether extract 8.90"0.03 8.53"0.26 8.11"0.01 Ash 9.56"0.07 11.01"0.12 11.52"0.02
Fiber 1.35"0.07 1.19"0.32 0.74"0.11
g
NFE 38.27 32.94 27.17
Ž .
Gross energy calrg 4821"27 4842"15 4934"12
Moisture 22.27"0.09 18.56"0.30 23.92"0.17
a
PIASA, La Paz, Baja California Sur, Mexico.
b
Los Volcanes, Queretaro, Mexico.´
c Ž .
Vitamin supplement except where units are given, values are in mgrkg diet : Vit. A retinol, 2500 IU; Vit. D , 2400 IU;3 DL-alpha-tocopheryl acetate, 50 IU; menadione 10; thiamin, 1; riboflavin, 4; pyridoxine, 3; pantothenic acid, 20; niacin, 10; d-biotin, 0.15; folic acid, 1; cyanocobalamin, 0.01; inositol, 300. Filler sorghum meal.
d Ž .
Mineral premix grkg diet : CaCl2 2H O, 5.14; Na HPO , 11.4; MgSO 7H O, 2.98; FeSO 7H O,2 2 4 4 2 4 2
0.043; ZnSO 7H O, 0.055; MnCl 4H O, 0.019; CuSO 5H O, 0.005; KI, 0.006 mg; SeS , 0.083 mg.4 2 2 2 4 2 2 e
ALGIMAR, CICIMAR-IPN, La Paz, Baja California Sur, Mexico.´
f
Stay-C. Roche.
g Ž .
NFEsNitrogen-free extract, calculated as 100- %Proteinq%Ether extractq%Ashq%Fiber .
Each diet was prepared by first mixing the macroingredients; sardine meal, squid meal, wheat meal, soybean protein meal, and baker’s yeast, in a blender for 10 min. The microingredients; ascorbic acid, mineral premix, vitamin premix, sodium alginate, and choline chloride were mixed in a coffee grinder before being added to the microingredi-ents in the blender. Dry ingredimicroingredi-ents were mixed for 10 min before the fish oil and soybean lecithin was added. The oil and lecithin had also been manually blended for 10 min to obtain an emulsion. Finally, all the ingredients were mixed together for another
Ž .
Ž .
apparent satiation twice per day 0900 and 1700 during a 30-min period, and the
Ž .
amount of diet consumed was recorded daily. Every 2 weeks, the standard length SL
Ž .
and wet weight W of the total population were recorded. At the end of the experiment,
Ž .
90 fish were killed 10 per replicate to assay for crude protein, ether extract, and ash content of liver and muscle. For each replicate, two or three whole fish were used to
Ž .
determine proximate composition according to AOAC 1995 methods, and gross energy
Ž .
in an adiabatic bomb calorimeter Parr model 1261 Moline, IL, USA . All samples were stored at y508C, then lyophilized before the analytical procedures. The biochemical analysis of diets, fish, and tissue samples were conducted in triplicate.
Growth rate was determined after a logarithmic transformation of the wet weight, by
b X Ž .
a covariance analysis using the model Ysae Everhart et al., 1953 . The comparison
Ž . Ž .
between slopes b was made using a Tukey test Zar, 1996 . Survival was evaluated at the end of the experiment, using the test of hypothesis of the difference among the
Ž .
proportions of two populations Daniel, 1997 . Normality of distribution and homogene-ity of variance were tested. Data were analyzed by a one-way ANOVA with level of protein as factor. When the data were not normally distributed, a Kruskal–Wallis
Ž
analysis was used SL, proximate composition of whole fish, muscle, and liver, growth
.
variables . Means were compared by a Duncan’s multiple range test or Tukey
nonpara-Ž .
metric multiple test. Statistical analyses were made using STATISTICA v. 5.1
ŽStatSoft, Tulsa, OK, USA . All analysis were made at 0.05 significance level..
3. Results
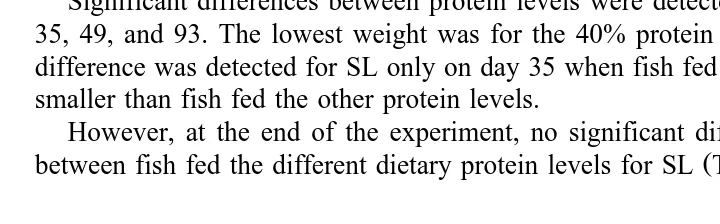
Significant differences between protein levels were detected for wet weight on days
Ž .
35, 49, and 93. The lowest weight was for the 40% protein diet Table 2 . Significant difference was detected for SL only on day 35 when fish fed the 45% protein diet were smaller than fish fed the other protein levels.
However, at the end of the experiment, no significant difference could be detected
Ž .
between fish fed the different dietary protein levels for SL Table 2 . Fish fed the 45%
Table 2
Ž . Ž .
Weight g and standard length cm of spotted sand bass juveniles fed different dietary protein levels
ŽMean"SD.
Ž . Ž . Ž .
Sampling days Weight g SL cm
Ž . Ž .
Protein level % Protein level %
40 45 50 40 45 50
Table 3
Growth variables and percent survival of spotted sand bass juveniles fed different dietary protein levels for 93
Ž .
Means in the same row with different superscript are significantly different P-0.05 .
1 Ž . wŽ . x
Specific growth rate SGR : ln final weightyln initial weightrdays=100.
2 Ž . Ž .
Average daily gain ADG : final mean weightyinitial mean weightrnumber of days.
3Condition factor CF : final mean body weightrfinal mean body lengthŽ . Ž 3.=100.
4 Ž . wŽ . Ž .x
Weight gain WG% : final mean weightyinitial mean weightrfinal mean weight =100.
5 Ž . Ž .
Survival % : final fish numberrinitial fish number=100.
and 50% protein diets showed higher specific growth rates, whereas no significant
Ž .
difference was detected for average daily gain ADG , condition factor, and percent
Ž . Ž
weight gain Table 3 . Survival of fish at the end of the experiment was high above
.
93% and unaffected by diets.
Ž .
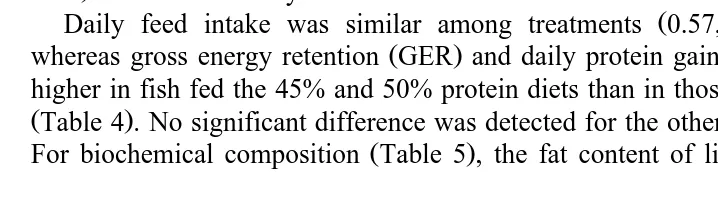
Daily feed intake was similar among treatments 0.57, 0.59 and 0.56 grfish ,
Ž . Ž .
whereas gross energy retention GER and daily protein gain DPG were significantly higher in fish fed the 45% and 50% protein diets than in those fed the 40% protein diet
ŽTable 4 . No significant difference was detected for the other feed utilization variables..
Ž .
For biochemical composition Table 5 , the fat content of liver varied from 64.2% to
Table 4
Ž .
Feed efficiency of spotted sand bass juveniles fed different dietary protein levels for 93 days Mean"SD
Ž .
DPG mgrfish 221.2"12.1 256.3"10.1 273.9"14.7
Ž .
Means in the same row with different superscript are significantly different P-0.05 .
1 Ž . Ž .
Daily feed intake DFI : feed intake, g dry matterrnumber of fishrday.
2 Ž . Ž . Ž .
Feed conversion ratio FCR : feed intake, g dry matterrfish weight gain, g .
3 Ž . Ž . Ž .
Protein efficiency ratio PER : fish wet weight gain, grprotein intake, g .
4 Ž . Ž . Ž
Protein productive value PPV : final % body protein=final body weightyinitial % body protein=
. Ž Ž . Ž . .
initial body weightrtotal protein intake g=weight gain g=100 .
5 Ž . Ž . Ž .
Gross energy retention GER : fish energy gain, kJrenergy intake, kJ=100.
6 Ž . Ž . Ž . Ž .
Daily energy gain DEG : energy intake, grtime days=N final number of fish . 7
Ž . Ž . Ž . Ž .
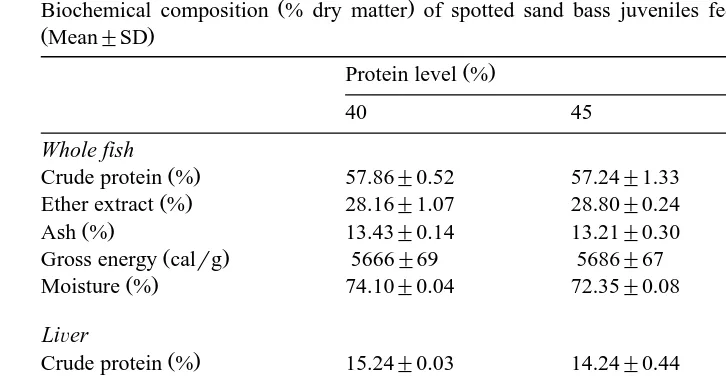
Table 5
Ž .
Biochemical composition % dry matter of spotted sand bass juveniles fed different dietary protein levels
ŽMean"SD.
Crude protein % 57.86"0.52 57.24"1.33 56.62"0.62
Ž .
Ether extract % 28.16"1.07 28.80"0.24 29.42"0.68
Ž .
Ash % 13.43"0.14 13.21"0.30 12.52"0.30
Ž .
Gross energy calrg 5666"69 5686"67 5727"77
Ž .
Moisture % 74.10"0.04 72.35"0.08 71.38"0.06
LiÕer
Ž .
Crude protein % 15.24"0.03 14.24"0.44 13.73"0.55
Ž .
Ether extract % 64.24"0.47 66.37"1.28 69.71"0.27
Ž .
Ash % 1.67"0.15 1.48"0.02 1.47"0.07
Muscle
Ž .
Crude protein % 70.91"1.15 72.16"0.32 72.71"0.58
Ž .
Ether extract % 22.64"2.26 22.47"0.82 20.97"0.58
Ž .
Ash % 5.60"0.23 5.68"0.23 5.87"0.22
69.7% for diets containing 40% and 50% dietary protein, Nevertheless, no differences in whole fish, liver, or muscle composition were found among dietary treatments.
4. Discussion
In this study, the 45% dietary protein level showed significantly better growth performance than the 40% protein level. This protein level is similar to those reported as required by other carnivorous fish, whereas it is higher than that recommended for
Ž
omnivorous or herbivorous fish such as tilapia, catfish, and carp Davis and Stickney,
.
1978; Ogino, 1980; Robinson and Robinette, 1994 . The difference in results from one
Ž
study to another can be explained by the different experimental conditions feeding
.
methods, species, age, sex, and stocking density used. In some cases, when the protein requirement is exceeded, the growth rate remains constant or decreases because dietary
Ž .
protein is used to metabolize the excess amino acids absorbed Jauncey, 1982 .
Ž
Accumulation of lipid in tissue and muscle has also been reported Ballestrazzi et al.,
.
1994; Swann et al., 1994 . The growth rate of spotted sand bass obtained in the present study can be considered satisfactory, because lower values have been found for other
Ž .
species, such as Mediterranean yellowtail Seriola dumerilii Jover et al., 1999 . In contrast, higher values have been reported for grouper Epinephelus tauÕina, barramundi ŽTacon et al., 1995 , or rabbitfish Parazo, 1990 . In a previous growth trial with spotted. Ž .
sand bass juveniles cultured in floating cages where the fish were fed a diet made with
Ž .
fresh tuna and squid as the main protein sources 56% protein and 22% ether extract ,
Ž .
The lack of control of environmental conditions in the cages and diet composition may have affected the growth performance; nevertheless, the higher ADG values found by us
Ž0.36 to 0.40 grday with diets containing lower protein 40–50% protein represent an. Ž .
improvement for the rearing technology of the spotted sand bass.
Ž . Ž .
The protein efficiency ration PER values 1.48, 1.42 and 1.34 for dietary protein levels 40%, 45% and 50% are higher than those obtained in a previous experiment
Ž .
where spotted sand bass juveniles 2.5 g were fed semipurified diets containing casein
Ž . Ž .
as main protein source 1.12, 1.21 and 1.15 Anguas-Velez, personal communication .
´
The difference in these results could be related to a more balanced amino acid composition in the practical diets compared to the semipurified diets, since it is known
Ž .
that casein is limited in arginine for many species studied Chen and Tsay, 1994 . Similar PER values have been reported for other species like gilthead seabream
Ž1.5–1.2, 42–50% dietary protein, Robaina et al., 1997 ; European sea bass 1.66–1.18;. Ž .
45–50% dietary protein, Ballestrazzi et al., 1994 , indicating that protein from the practical diets was used efficiently by spotted sand bass independently of the dietary protein level.
Significantly higher GER was detected in fish fed diets containing 45–50% protein, compared to fish fed the 40% protein diet. These values are higher than those of gross
Ž .
energy efficiency reported by Jover et al. 1999 for Mediterranean yellowtail juveniles
Ž12.5–15.2% for diets containing 45–50% protein , and similar to those reported by. Ž .
Ballestrazzi et al. 1994 for European sea bass fed diets containing 44–49% crude protein. DPG was also found to be higher in spotted sand bass fed diets containing 45 and 50% protein compared to fish fed the 40% protein diet, which is in accordance to the growth rates observed. In contrast, no effect of the dietary treatments was detected
Ž .
on the daily feed intake, protein productive value PPV , or the daily energy gain. In
Ž . Ž
rabbitfish Siganus canaliculatus Yousif et al., 1996 and Siganus guttatus Parazo,
.
1990 , PPV values were found to be 29.3% with 35% dietary protein level, and 30.7%
Ž .
with 36% dietary protein level. Robaina et al. 1997 in gilthead seabream, found values from 21.9% to 25.2% feeding a diet with a 55% protein. PPV values found here with spotted sand bass indicate that protein assimilation was relatively high with all dietary treatments. Since protein is the most expensive component in finfish feeds, it is necessary to minimize the protein content of the diet, but to provide the essential amino acids required by the organisms to support good growth. Special attention has to be
Ž .
taken to the feed conversion ratio or the feed efficiency , which are reliable variables for fish farmers. In our work, when the protein level in the diet increased, the feed conversion ratio decreased, but no significant difference was observed among
treat-Ž .
ments. The FCR values obtained here for the spotted sand bass 1.43–1.60 are similar or lower than those reported by several authors for commercially cultured species, such
Ž . Ž
as estuary grouper 1.67–2.85; Teng et al., 1978 and red drum 2.14; Serrano et al.,
. Ž .
the digestibility of the ingredients is not known. However, no significant effect of dietary protein level was observed on chemical composition of whole fish, muscle, or liver. A plausible explanation for lack of significant differences in the body or tissue composition may be the short time of the growth trial, considering the size of the
Ž .
organisms employed, as has been found in other studies Lazo et al., 1998 .
5. Conclusion
Our results indicate that spotted sand bass juveniles require about 45% protein in their diet to obtain good growth, which is within the range reported for other similar species. Further studies are needed to determine the amino acid requirements and the apparent digestibility coefficient of the protein sources employed.
Acknowledgements
We want to thank Sonia Rocha and Ernesto Goytortua for their helpful technical
´
assistance in the chemical analysis and formulation of the diets. This work was supported by an institutional grant IPN-DEPI 958131, by the Consejo Nacional de
Ž .
Ciencia y Tecnologıa of Mexico CONACyT project 1702P-B and by CIBNOR project
´
´
ABM17. We thank Dr. Ellis Glazier for editing the English-language text.
References
AOAC, 1995. 16th edn. Official Methods of Analysis of the Association of Official Analytical Chemist, vol. I, Washington, DC, USA, 1234 pp.
Ballestrazzi, R., Lanari, D., Agaro, E.D., Mion, A., 1994. The effect of dietary level and source on growth,
Ž
body composition, total ammonia and reactive phosphate excretion of growing sea bass Dicentrarchus
.
labrax . Aquaculture 127, 197–206.
Chen, H.Y., Tsay, J.C., 1994. Optimal dietary protein level for the growth of juvenile grouper, Epinephelus
malabaricus, fed semipurified diets. Aquaculture 119, 265–271.
Daniel, W.W., 1997. Biostatistics. Wiley, New York, USA, 756 pp.
Davis, T.A., Stickney, R.R., 1978. Growth response of Tilapia aurea to dietary protein quality and quantity. Trans. Am. Fish. Soc. 107, 479–483.
Everhart, W.H., Eipper, A.W., Youngs, W.D., 1953. Principles of Fishery Science. Cornell Univ. Press, Ithaca, NY, USA, 753 pp.
Ž
Ferry, L.A., Clark, S.L., Cailliet, G.M., 1997. Food habits of spotted sand bass Paralabrax
maculatofascia-.
tus, Serranidae from Bahia De Los Angeles, Baja California. Bull. South. Calif. Acad. Sci. 96, 1–21.
Grayeb-Del Alamo, T., Ortiz-Galindo, J.L., Civera-Cerecedo, R., Dumas, S., 1998. Effect of density on growth and survival during the nursery and growout of spotted sand bass in floating sea cages. In: Ruas-de
Ž .
Moraes, F., Fernandez-de Castro, P. Eds. , Aquicultura Brasil 98, 2–6 Nov. 1998, Recife, Brasil.´
Jauncey, K., 1982. The effect of varying dietary protein level on the growth, food conversion, protein utilization and body composition of juvenile tilapia Sarotherodon mosambicus. Aquaculture 27, 43–54. Jover, M., Garcıa-Gomez, A., Tomas, A., De la Gandara, F., Perez, L., 1999. Growth of Mediterranean´ ´ ´ ´ ´
Ž .
Lazo, J.P., Davis, D.A., Arnold, C.R., 1998. The effects of dietary protein level on growth, feed efficiency and
Ž .
survival of juvenile Florida pompano Trachinotus carolinus . Aquaculture 169, 225–232.
Lluch-Cota, D.B., 1995. Aspectos reproductivos de la cabrilla arenera Paralabrax maculatofasciatus
ŽPisces:Serranidae en Bahıa Magdalena, Baja California Sur, Mexico. Master’s thesis. CICIMAR-IPN, La. ´ ´
Paz, Mexico, 116 pp.´
Matus-Nivon, E., Ramırez-Sevilla, R., Ortiz-Galindo, J.L., Martınez-Pecero, R., Gonzalez-Acosta, B., 1990.´ ´ ´ ´
Potencial acuacultural de ocho especies de peces marinos del Pacifico mexicano, con base a su biologıa´
Ž .
temprana. In: de la Lanza-Espino, G., Arredondo-Figueroa, J.L. Eds. , La Acuacultura en Mexico: De Los´
Conceptos a La Produccion. Instituto de Biologıa, U.N.A.M., Mexico, pp. 67–74.´ ´ ´
Miller, J.D., Lea, R.N., 1972. Guide to the coastal marine fishes of California. California Department of Fish and Game. Fish Bull. 157, 249 pp.
Ogino, C., 1980. Protein requirement of carp and rainbow trout. Bull. Jpn. Soc. Sci. Fish. 46, 385–391. Parazo, M.M., 1990. Effect of dietary protein and energy level on growth, protein utilization and carcass
composition of rabbitfish, Siganus guttatus. Aquaculture 84, 41–49.
Robaina, L., Moyano, F.J., Izquierdo, M.S., Socorro, J., Vergara, J.M., Montero, D., 1997. Corn gluten and
Ž .
meat and bone meals as protein sources in diets for gilthead seabream Sparus aurata : nutritional and histological implications. Aquaculture 157, 347–359.
Robinson, E.H., Robinette, H.R., 1994. Effects of dietary protein level and feeding regimen on growth and fattiness of channel catfish, Ictalurus punctatus. J. Appl. Aquacult. 1, 67–89.
Rosales-Velazquez, M.O., 1997. Efecto de la alimentacion sobre los desoves de la cabrilla arenera Paralabrax´ ´
Ž .
maculatofasciatus Teleostei: Serranidae mantenida en cautiverio. Master’s Thesis. CICIMAR-IPN, La
Paz, Mexico, 62 pp.´
Serrano, J.A., Nenematipour, G.R., Gatlin, D.M. III, 1992. Dietary protein requirement of the red drum
ŽSciaenops ocellatus and relative use of dietary carbohydrate and lipid. Aquaculture 101, 283–291..
Strickland, J.D.H., Parsons, T.R., 1972. A Practical Handbook of Seawater Analysis. Fisheries Research Board of Canada, Ottawa, 309 pp.
Swann, D.L., Riepe, J.R., Stanley, J.D., Griffin, M.E., Brown, P.B., 1994. Cage culture of hybrids striped bass in Indiana and evaluation of diets containing three levels of dietary protein. J. World Aquacult. Soc. 25, 281–288.
Tacon, A.G.J., Phillips, M.J., Barg, U.C., 1995. Aquaculture feeds and the environment: the Asian experience. Water Sci. Technol. 31, 41–59.
Teng, S.K., Chua, T.E., Lim, P.E., 1978. Preliminary observation on dietary protein requirement of estuary grouper Epinephelus salmoides Maxwell cultured in floating net cages. Aquaculture 15, 257–271. Thomson, D.A., Findley, L.T., Kerstitch, A.N., 1987. Reef Fishes of the Sea of Cortez. The Rocky Shore
Fishes of the Gulf of California. The University of Arizona Press, Arizona, USA, 302 pp. Tucker, J.W., 1998. Marine Fish Culture. Kluwer Academic Publishing, Norwell, MA, USA, 750 pp. Van der Heiden, A.M., 1985. Taxonomıa, biologıa y evaluacion de la ictiofauna demersal del Golfo de´ ´ ´
Ž .
California. In: Yanez-Arancibia, A.˜ Ed. , Recursos pesqueros potenciales de Mexico. La pesca´
acompanante del camaron. UNAMrPUALrICLMrSEPESCArINP. Distrito Federal, Mexico, pp. 149–˜ ´ ´
195.
Yousif, O.M., Osman, M.F., Anawhi, A.A., Cherain, T., 1996. Optimum protein to energy ratio for two size
Ž .
groups of rabbitfish, Siganus canaliculatus Park . Aquacult. Nutr. 2, 229–233.