A SIMPLE, INEX PENSIVE METHOD FOR TEACHING
HOW MEMBRANE POTENTIALS ARE GENERATED
William M. Moran, Jerod Denton, Kelly Wilson, Matt Williams, and Steven W. Runge
Depa rtm ent of Biology, University of Centra l Ark a nsa s, Conwa y, Ark a nsa s 72035-0001
W
e have developed a simple laboratory exercise that uses an inexpensive dialysis membrane (molecular weight cutoff5100) to illustrate the genera-tion of membrane potentials (Vm) across plasma membranes of animal cells. Apiece of membrane,2.0 cm2is mounted in an Ussing-like chamber. One chamber half is
designated cytosol and the other half external. Chamber sidedness helps students relate their findings to those of real cells. As in real cells, outward directed K1concentration
gradients [high cytosolic K1concentration ([K1]
c) and low extracellular K1
concentra-tion] generate cytosol electrically negative Vm with a slope of approximately 245
mV/decade change in [K1]
c. The polarity ofVmreflects the outward flow of potassium
ions because flow of the larger counterion, H2PO42, is restricted by the pores in the
membrane. A slope less than Nernstian (,59 mV/decade) suggests that the membrane is slightly permeable to H2PO42. Importantly, this facilitates teaching the use of the Nernst
equation to quantify the relationship between ion concentration ratios across mem-branes and magnitude of Vm. For example, students use their data and calculate a
permeability ratioPK/PH2PO4that corresponds to a slope,24% less than Nernstian. This
calculation shows that Nernstian slopes are achieved only when permeability to the counterion is zero. Finally, students use the concept of membrane capacitance to calculate the number of ions that cross the membrane. They learn where these ions are located and why the bulk solutions conform to the principle of electroneutrality.
AM. J. PHYSIOL. 277 (ADV. PHYSIOL. EDUC. 22): S51–S59, 1999.
Key words:diffusion potentials; Nernst equation; dialysis membranes
The membrane potential (Vm) in animal cells is
gener-ated largely by intracellular potassium ions (K1) flow-ing through plasma membrane K1-selective leak chan-nels to the cell exterior (3, 7, 9). In animal cells, Vm
plays a vital role in a number of physiological pro-cesses, such as electrical signaling in excitable cells, Na-coupled transport of nutrients by small intestine, muscle contraction, brain function, sensory percep-tion, secretion of neurotransmitters, postsynaptic gen-eration of action potentials, cell signaling, secretion of insulin by pancreatic cells, secretion of Cl2by airway epithelia, and ion transport across epithelial cells lining the nephron (7 ). Nearly one-third of the cell’s
supply of ATP powers the plasma membrane Na1-K1 -ATPase (Na1pump) that maintains the high intracellu-lar K1 concentration necessary to generate V
m (1).
Because of the ubiquitous role ofVmin physiological
processes and the large fraction of the cell’s energy supply devoted to maintainingVm, it is essential that
beginning physiology students have a firm grasp on how membrane potentials are generated.
However, teaching the concept of a membrane poten-tial is very difficult (11). Students often become confused with the bewildering array of membrane pumps and channels and transmembrane ion
ents responsible for generatingVm. There are several
reasons for the confusion.1) In most cells, the plasma membrane electrogenic Na1 pump, whose activity maintains the high intracellular K1 concentrations, contributes little to Vm in part because the pump
behaves as a source of constant current; it has an infinitely high resistance (5).2) The high concentra-tion side of the membrane has an electrical polarity opposite that of the charge carried by the membrane permeant ion. 3) Even though ions cross the mem-brane to generateVm, bulk solution electroneutrality is
maintained (3, 4, 9). Therefore, before students can appreciate how the interaction between membrane pumps and leaks generate membrane potentials in real cells, they must understand how the flow of ions across membranes generates membrane potentials. For a current, detailed analysis of the origin of resting membrane potentials, see Sperelakis (13). A descrip-tion of the interacdescrip-tion between plasma membrane ion pumps and ion channels in generating membrane poten-tials in animal cells is found in Byrne and Schultz (3).
Accordingly, we developed a simple, hands-on exer-cise that employs a mock cell to generate membrane potentials. The apparatus and approach presented here follow, in part, a laboratory exercise developed at California State University at Hayward (CSUH) that used cation- and anion-selective membranes to gener-ate membrane potentials (8). It is also similar to the experiment published by Manalis and Hastings in 1974 (11). In both of those laboratory exercises, K1 gradients were imposed across the cation-selective membrane andVmwere generated with nearly
Nern-stian slopes, 58 mV/decade. These exercises revealed the Nernst equilibrium potential for K1and showed that sustained K1 gradients maintain V
m constant.
Unfortunately, the ion-selective membranes used are no longer available, and the description of the CSUH experiment (8) is no longer in print. We searched for a suitable alternative membrane and found a new, low molecular weight cutoff (MWCO5 100) membrane, manufactured by Spectrum, that served our purpose. With the dialysis membrane, if one ion of a dissociable salt can pass through the membrane while the counte-rion is restricted because of its larger size, then a membrane potential will be generated when the two solutions bathing the membrane have different salt concentrations (see Fig. 1).
Compared with teaching the concept of membrane potentials with microelectrode techniques and the above-mentioned ion-selective membranes, the Spec-trum dialysis membrane offers several advantages. 1) It is relatively inexpensive; an 8 3 10-in. sheet costs about $62.00 (Spectrum part no. 133080), and,40 pieces of experimental membrane can be obtained from a single sheet. 2) The membrane is shipped ready to use and requires no time-consuming cleaning procedure.3) Because the relationship between trans-membrane ion concentration ratio andVmis less than
Nernstian, a permeability ratio can be calculated for the permeant ion and the less permeant counterion. Importantly, this helps students relate the magnitude of Vm to that predicted by the Nernst equation. 4)
Expensive equipment such as oscilloscopes and
elec-FIG. 1.
trometers is not required; rather, a simple pH meter operated in voltage mode suffices. 5) The dialysis membrane chamber is relatively inexpensive and can be purchased from Jim’s Instrument Manufactur-ing (Iowa City, IA). 6) The entire experiment is designed around a mock cell with cytosol and extracel-lular fluid compartments to help students relate their results to conditions found in real cells. 7) Because membrane thickness is known, a value for membrane capacitance can be derived with a simple assumption. Hence, students employ the concept of membrane capacitance and calculate the number of potassium ions that c ross the membrane to generate Vm. 8) The approach used
here employs the scientific method such that stu-dents formulate hypotheses about polarity and magni-tude of Vm before they conduct experiments and
analyze data.9) Changes in ion activities in different concentrations of the salt solutions are of no concern because dilute (0.1–10 mM) solutions are employed. Change in ion activity is a particularly difficult concept for students to grasp and adds to the complexity of data analysis when salt concentrations approach 100 mM.
The experiments described here give students a hands-on experience with the generation of mem-brane potentials. In addition, students calculate the number of ions that cross the membrane to generate Vm, and they are introduced to the Nernst equation as
an equilibrium expression and learn how this impor-tant electrochemical equation is used in electrophysi-ological studies. The second experiment illustrates the role of the transmembrane Na1gradient in reversal of Vmduring an action potential in excitable cells (7 ).
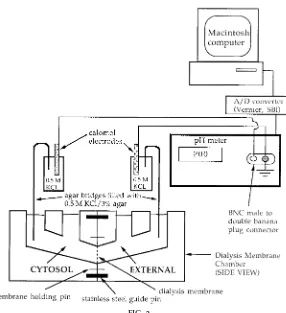
EXPERIMENTAL APPARATUS
The experimental apparatus is relatively simple (Fig. 2). An ,2-cm2 piece of membrane is cut from the sheet of dialysis membrane and placed in 0.1 mM KH2PO4 for ,10 min to allow antibacterial agents to diffuse from the membrane pores. We have found that placing the piece of membrane in distilled water gives anomalous results. After a light layer of silicone grease is applied around the chamber opening on each chamber half, the membrane is mounted by gently forcing the membrane down over the chamber’s membrane holding pins with stainless steel forceps. The two chamber halves are slipped together, guided
by two large stainless steel guide pins (Fig. 2). The two chamber halves are held together in a utility vise (jaw width 2.5 in., jaw opening 29⁄
16in., jaw depth 1.5 in.,
and overall length 71⁄ 4in.).
The two chamber halves are filled with appropriate salt solutions, and KCl-agar bridges are inserted into each chamber half to make an electrical connection to the calomel electrodes (catalog no. 13-620-258, Fisher Scientific). The agar bridges are prepared by boiling agar (3%, bacteriological; catalog no. A-5306, Sigma) in 3 M KCl dissolved in distilled water. Polyethylene (PE) tubing is then filled with the hot agar-KCl mixture from a plastic syringe fitted with a large stainless steel needle. To comply with electrophysiological conven-tion, the extracellular electrode is connected to ground on the pH meter (Digital Chemcadet model 5984-50, Cole-Parmer Instrument), and the other electrode is connected to the cytosol side of the chamber. In our studies, the output of the pH meter (i.e.,Vm) is fed to a
Vernier analog-to-digital converter. The digitized sig-nal is displayed on the screen of a Macintosh com-puter, employing Vernier’s Data Logger software.
SOLUTIONS
We have experimented with several salts and found three that give reliable and reproducible results: K2HPO4, KH2PO4, and Na2HPO4, all dissolved in
dis-tilled water to give stock concentrations of 10 mM. Salts that failed to give reliable results were KCl, potassium tetrathionate, potassium pyrosulfate, potas-sium nitrate, potaspotas-sium sulfate, potaspotas-sium gluconate, sodium diatrizoate, and sodium citrate. The stock solutions of K2HPO4, KH2PO4, and Na2HPO4 are
di-luted to give concentrations of 1 and 0.1 mM for use in the experiments. To obtain additional data points, concentrations of 0.5 mM and 5 mM may be used. Although identical results are obtained with the two K1 phosphate salts, it is best to use KH
2PO4 to
calculate the permeability ratioPK/PH2PO4, as described
inEXPERIMENTS.
Str eaming potentials do not contribute toVm.Ion
(10). To test for streaming potentials, we added mannitol to the salt solutions on the low salt concen-tration side of the membrane to achieve osmolarities equal to those on the high salt concentration side. We then compared Vm to measurements made in the
absence of mannitol and found no difference between the two. Therefore, streaming potentials do not make measurable contributions toVmin these experiments.
EXPERIMENTS
Effect of Incr easing Cytosolic K1Concentration onVm
In the first experiment, students explore the relation-ship between transmembrane K1gradients andV
m. To
mimic K1gradients present across plasma membranes
of real cells, students consult Table 1 and determine in which compartment they increase K1concentration. Importantly, this gives students insight into the nature of the K1concentration gradient. Next, they develop a hypothesis, which includes statements about magni-tude and polarity ofVm, to predict what will happen to
Vmwhen they increase the cytosolic K1concentration
([K1]
c) while holding the extracellular K1
concentra-tion ([K1]
e) constant. In keeping with convention (see
Figs. 5–14B, Ref. 7), instructors may choose to begin the experiment with high [K1]
c and increase [K1]e,
which depolarizesVm.
The experiment is started by placing 0.1 mM KH2PO4
in each chamber half. The potential displayed on the pH meter represents zero Vm. A 3-ml syringe with a
FIG. 2.
piece of PE tubing attached is used to empty and refill the chamber halves when changing salt solutions. When the salt concentration is increased in a chamber half, the chamber should be rinsed at least once with the new salt solution beforeVmis recorded. AfterVmis
recorded with the higher KH2PO4concentrations, 0.1
mM phosphate salt should be returned to the cytosolic chamber to check for drift. Usually little drift occurs. However, in some cases drift of a few millivolts occurs, and either this must be added to or subtracted from Vm or the experiment must be repeated. With
the recording arrangement illustrated in Fig. 2, in-creases in [K1]
cgenerate a cytosol negative Vm. After
Vm is recorded with 0.1, 1, and 10 mM KH2PO4
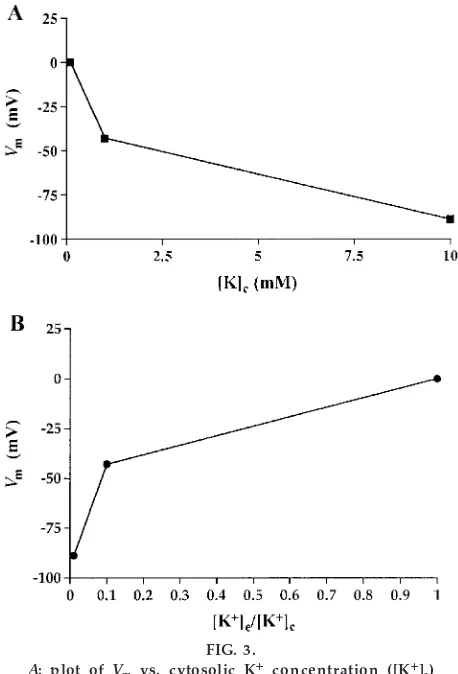
(students should also include concentrations of 0.5 and 5 mM) in the cytosol compartment, the students plot a graph ofVmversus [K1]c(Fig. 3A) and then plot
Vmversus the ratio of [K1]eto [K1]c, that is, ratios of 1,
0.1, and 0.01 (Fig. 3B). This graph shows that the ratio of potassium ion concentrations across the membrane is the important factor in generation ofVmbecause a
ratio of 1.0 gives a Vm of zero. With this plot, Vm
becomes increasingly more negative as a function of [K1]
e/[K1]c, but not in a linear manner.
The next objective is to establish a linear relationship between Vm and [K1]e/[K1]c. When doing this,
stu-dents will be introduced to the Nernst equation and to the reason for taking the log [K1]
e/[K1]cto establish a
linear relationship between Vm and the ratio of K1
concentrations on the two sides of the membrane. Ideally, measurements ofVmare made when diffusion
forces (concentration gradient) and electrical forces (Vm) are equal, that is, at equilibrium. Thus we can
equate these two forces. We can writeEfor electrical force and Ce/Cc for concentration ratio (extracellular
to c ytosolic ) or c onc entration forc e in the K1 transmembrane chemical gradient, where C repre-sents concentration (in mol/l). At equilibrium we then have
E5Ce/Cc (1)
The pr oblem with Eq. 1. At this point the students should be asked what the problem is with this equation. Clearly, the units of the two forces are not the same. To rectify this situation, the concentration ratio (Ce/Cc) is multiplied by a constant k that must
have units of volts. Now the units on the two sides of
FIG. 3.
A: plot ofVm vs. cytosolic K1concentration ([K1]c) while ex ter nal K1concentration ([K1]e) is held at 0.1 mM. B: plot of [K1]e/ [K1]c vs. Vm gives a nonlinear r elationship. As [K1]
cincr eases (i.e., decr ease in [K1]e/ [K1]
c),Vmbecomes mor e negative.Vmr epr esents the electrical potential of the cytosol compartment r efer-enced to the ex ter nal compartment (n53; standar d deviations ar e smaller than data point symbols). TABLE 1
Cytosol and ex ter nal Na1and K1concentrations and their ratios in squid nerve and fr og muscle
Tissue
Cytosolic Concentration,
mM
External Concentration,
mM
Ce/Cc
Na1 K1 Na1 K1 Na1 K1
Squid nerve 49 410 440 22 8.8 0.05 Frog sartorius muscle 10 140 120 2.5 12 0.02
Data are from Eckert et al. (6). Ce/Cc, ratio of external to cytosolic
the equation are the same, and we can rewriteEq. 1as
E5k(Ce/Cc) (2)
Next, the constant k should be explored. In other words, where doeskcome from and why does it have units of volts?kis equal toRT/zF, where Ris the gas constant (2 cal/mol 3 Kelvin), T is the absolute temperature (Kelvin units), z is the valence of the membrane permeant ion, and F is the Faraday con-stant (23,062 cal/mol3 V). The Faraday constant is the conversion factor that converts energy in a chemi-cal concentration gradient (chemi-cal/mol) into equivalent energy in an electrical gradient (volts). At this point we have found it useful to have the students derive the units of k to convince themselves that it has units of volts. NowEq. 2 can be rewritten to include RT/zFas
E5(RT/zF)(Ce/Cc) (3)
However, a plot of E, orVm, against (RT/zF)(Ce/Cc)
still gives a nonlinear relationship. To establish a linear relationship between E and (RT/zF)(Ce/Cc), the
stu-dents should be asked how the numbers on thex- and y-axes differ. On the y-axis the numbers represent an arithmetic progression, such as 10, 20, 30, 40, etc., because the difference between any two successive numbers is constant. On the x-axis the numbers represent a geometric progression in which Ce/Cc
decreases as 1, 0.1, 0.01 (12). In this progression, the ratio between any two successive numbers is constant and the numbers decrease exponentially. If we take negative logarithms of the numbers on thex-axis, we obtain numbers that represent an arithmetic progres-sion of 0, 1, 2, etc. Now, if 2ln (Ce/Cc) is plotted
against Vm, one arithmetic progression is plotted
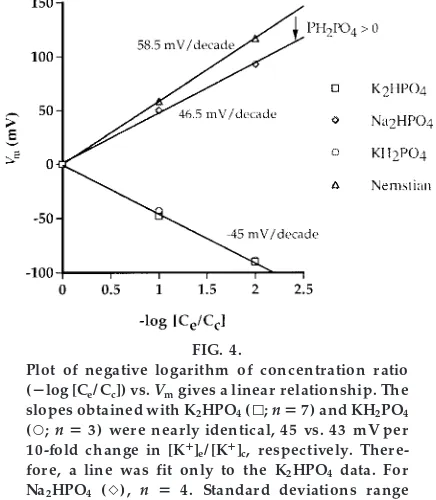
against another arithmetic progression and a linear relationship is established between the two variables (Fig. 4).
If we expandEq. 3to include ln (Ce/Cc) as follows
E5(RT/zF) ln (Ce/Cc) (4)
then we have the familiar Nernst equation. This is usually written as the log (Ce/Cc)
E5(2.3RT/zF) log (Ce/Cc) (5)
Eis now referred to as the equilibriumVm. The value
of 2.3RT/zFis 59 mV at 23°C. With a monovalent salt, a 10-fold ratio for Ce/Ccwill generate aVmof 59 mVif
the m em bra ne is perm ea ble to one ion only. Accord-ingly, the slope of the relationship between Vm and
2log (Ce/Cc) has a value of 59 mV/decade change in
Ce/Cc and is referred to as a Nernstian slope. The
significance of the Nernst equation is that it describes the mathematical relationship between an ion chemi-cal concentration difference (or gradient) across a membrane andVmunder equilibrium conditions, i.e.,
when there is no net flow of ion across the membrane andVmis constant (2, 3).
Why is the slope less than Ner nstian?We suggest that the following analysis be performed by the students as a homework assignment.
At this point, the students should be asked why the slope of their relationship between Vm and 2log
FIG. 4.
Plot of negative logarithm of concentration ratio (2log [Ce/ Cc]) vs.Vmgives a linear r elationship. The slopes obtained with K2HPO4(k;n57) and KH2PO4 (s;n53) wer e nearly identical, 45 vs. 43 mV per 10-fold change in [K1]
(Ce/Cc) for KH2PO4 is less than Nernstian. As noted
above, a Nernstian slope is obtained only if the membrane is permeable to one ion. This suggests that the dialysis membrane is somewhat permeable to the counterion, H2PO42. A small permeability to H2PO42is
not unreasonable, given that H2PO4
2has a molecular
weight of 96 and the dialysis membrane has an MWCO of 100. Hence, we assume that the membrane is slightly permeable to H2PO42. These data allow the
students to calculate a permeability ratio PH2PO4/PK
and to demonstrate how permeability to the counte-rion generates less-than-Nernstian slopes. Further-more, this calculation reveals that Nernstian slopes are achieved only when the membrane is permeable to one ion.
For a membrane permeable to both ions of a disso-ciable salt, such as KH2PO4,Vmis given by (3)
Vm5(PK2PH2PO4)/(PK1PH2PO4)
359 mV.log ([KH2PO4]e/[KH2PO4]c) (6)
This expression is derived from the equation that gives the diffusion potential arising from the diffusion of a salt that dissociates into monovalent cations and anions (3). Because permeability is proportional to the diffusion coefficient, we can substitute perme-abilities for diffusion coefficients (3). Furthermore, the students should be aware that this equation reduces to the Nernst equation for K1 if membrane permeability to H2PO42approaches zero. From Fig. 4,
the slope is,45 mV/decade change in [K1]c(we use
the absolute value to simplify the calculation). We have consistently found slopes ranging from 40 to 50 mV/decade change in [K1]
c. However, in the
stu-dents’ hands, slopes are sometimes less, 30 –45 mV/decade. For a 10-fold concentration gradient we have
45 mV5(PK2PH2PO4)/(PK1PH2PO4)359 mV
To facilitate calculation of a permeability ratio, we arbitrarily set PKto 1.0. We will solve for the
mem-brane permeability ratioPH2PO4/PK. Dividing each side
of the above equation by 59 mV gives
45 mV/59 mV50.765(PK2PH2PO4)/(PK1PH2PO4)
When we solve forPH2PO4/PK, we have
20.23/21.7650.135PH2PO4/PK
With PK5 1.0, then PK/PH2PO4 5 1/0.13 5 7.7. The
dialysis membrane is 7.7 times more permeable to K1 than to H2PO42, and the permeability to H2PO42drives
the slope of the relationship between Vm and2log
([K1]
c/[K1]e) to a value ,59 mV/decade change in
[K1]
c.
How Many Ions Cr oss the Membrane to GenerateVm?
One of the most confusing aspects for students in understanding membrane potentials is that relatively few ions cross the membrane to generateVm.
Further-more, the ions that cross the membrane do not enter the pool of ions present in bulk solution because the solution is a conductor (4). These ions are present in a layer adjacent to, or just beneath, the membrane (Fig. 5) (4, 7). The following calculation reveals the number of ions needed to generate Vm across the dialysis
FIG. 5.
membrane, and Fig. 5 shows where these ions accumu-late. To calculate the number of ions that cross the dialysis membrane to generate Vm, students employ
the concept of membrane capacitance (Cm) (4).
Biologi-cal membranes behave as electriBiologi-cal capacitors be-cause they separate and store charge (4, 7, 10). The relationship betweenCmandVmis given by
Cm5Q/Vm (7)
where Q is the amount of charge stored by the membrane. Assuming that the cellulose ester dialysis membrane has a dielectric constant similar to that of biological membranes, we can estimate the capaci-tance of the dialysis membrane from the difference in thickness of the two membranes (4). Plasma mem-branes are ,5 nm thick, whereas the dialysis mem-brane is,20 µm thick, a difference of 4,000. Plasma membranes have a capacitance of 1 µF/cm2 (4, 9).
Thus the dialysis membrane has a capacitance of ,2.5 3 1024 µF/cm2. For the KH2PO4 and Na2HPO4
salts, the slope of the relationship between Vm and
Ce/Ccis,45 mV/decade change in ion concentration. Therefore,
Q/Cm545 mV
and
Q5(2.5310210F/cm2)(0.045 V)
51.1310211C/cm2
where C is coulomb (unit of electrical charge). To calculate the number of ions (N) that cross the membrane, we divideQby the charge per ion (e) (4)
N5Q(membrane area)/e (8)
so that
N5(1.1310211C/cm2)(
,1.0 cm2)/1.6310219C
5,6.93107
Approximately 7 million ions cross the,1.0-cm2area of dialysis membrane to generate aVmof 45 mV. This
seems like a large number of ions. However, these ions are stored near the membrane (see Fig. 5) and interact electrostatically with the layer of anions left
behind. As noted above, they do not change the number of ions in the bulk solution; hence, bulk electroneutrality is maintained (4). Furthermore, this number of ions, compared with the number of ions in bulk solution, represents a tiny fraction, as the follow-ing calculation shows. There are 6 3 1023 ions per
mole, and the 3 ml of 0.1 mM phosphate (0.2 mM potassium and sodium ions) salt solutions have 3.63
1017ions. The ratio of ions that crossed the membrane
to those present in bulk solution is
6.93107/3.63101751.9310210
This calculation shows that, relative to the number of ions in bulk solution, very few ions cross the mem-brane to chargeCmand generateVm.
Effect of Incr eases in Ex tracellular Na1 Concentration onVm
In the second experiment the students explore the relation between Vm and transmembrane Na1
gradients. This experiment will give students in-sight into the ionic basis of ac tion potentials in excitable cells. Again, students consult Table 1 and determine the compartment in which they must increase Na1 concentration to mimic the Na1 gradient found in animal cells. Next, they develop a hypothesis about magnitude and polarity of Vm that
result from increases in external Na1 concentration ([Na1]
e). This experiment is conducted in the same
manner as with increases in [K1]
c. After conducting
the experiment, students should answer the following questions.
1) Why is the absolute value of the slope (see Fig. 4) obtained with Na2HPO4 similar to that obtained with
KH2PO4?
2) Why is the polarity ofVmgenerated with Na2HPO4
opposite to that obtained with KH2PO4?
3) How do the results with Na2HPO4 relate to the
change inVmthat occurs during an action potential in
excitable cells?
Major Points of Lab Ex er cise
1) AVmdevelops when there is an ion gradient across
a membrane if one ion of a dissociable salt is restricted from crossing the membrane while the other ion is freely permeant.
2) The electrical polarity of Vm reflects flow of the
membrane permeant ion down its concentration gradi-ent.
3) In real cells and as demonstrated in the mock cell, Vm results from potassium ions from flowing down
their concentration gradient from the cytosol to the cell exterior.
4) The slope of the relation between Ce/Cc for the
membrane permeant ion andVmis Nernstian only if
the membrane is predominantly permeable to one ion of a salt that dissociates into monovalent cations and anions.
5) Relatively few ions cross the membrane to charge Cm and generate Vm; bulk electroneutrality is
main-tained.
6) Increases in external Na1concentration reveal the concentration gradient responsible for reversal ofVm
during an action potential in excitable cells.
SUMMARY
This laboratory exercise provides a simple set of experiments that can be reliably and reproducibly conducted by students in a three-hour laboratory period. The experiments reveal how membrane poten-tials are generated and show the ion gradient respon-sible for action potentials in excitable cells, and the students are introduced to the Nernst equation as an equilibrium expression.
We thank Dr. Paul Hamilton for critically reading the manuscript.
This project was supported in part by a National Science Founda-tion InstrumentaFounda-tion Laboratory Improvement Grant (9352255) and
by funds supplied by the Biology Department at the University of Central Arkansas.
Present addresses: J. Denton, Dept. of Physiology, Dartmouth Medical School, Hanover, NH 03755; K. Wilson, Univ. of Arkansas for Medical Sciences, College of Medicine, 4301 W. Markham St. -Slot 551, Little Rock, AR 72205.
Address for reprint requests or other correspondence: W. M. Moran, Dept. of Biology, Univ. of Central Arkansas, Conway, AR 72035-0001 (E-mail: [email protected]).
Received 12 March 1998; accepted in final form 20 July 1999.
Refer ences
1. Alberts, B., D. Bray, J. Lewis, M. Raff, K. Roberts, and J. D. Watson. Molecula r Biology of the Cell(3rd ed.). New York: Garland, 1994.
2. Becker, W. M., J. B. Reece, and M. F. Poenie.The World of the Cell (3rd ed.). Menlo Park, CA: Benjamin/Cummings, 1996.
3. Byr ne, J. H., and S. G. Schultz. An Introduction to Mem -bra ne Tra nsport a nd Bioelectricity. New York: Raven, 1988. 4. DeFelice, L. J. Electrica l Properties of Cells. New York:
Plenum, 1997.
5. DeWeer, P. Electrogenic pumps: theoretical and practical considerations. In:Electrogenic Tra nsport: Funda m enta l Prin-ciples a nd Physiologica l Im plica tions, edited by M. P. Blaus-tein and M. Lieberman. New York: Raven, 1984, p. 1–15. 6. Eckert, R., D. Randall, and G. Augustine.Anim a l
Physiol-ogy(3rd ed.). New York: Freeman, 1988.
7. Eckert, R., D. Randall, W. Bur ggr en, and K. Fr ench.
Anim a l Physiology(4th ed.). New York: Freeman, 1996. 8. Goldstein, N. N., and M. J. Fr ee.Founda tions of
Physiologi-ca l Instrum enta tion. Springfield, IL: Thomas, 1979.
9. Gutnecht, J.The origin of bioelectric potentials in plant and animal cells.Am . Zool. 10: 347–354, 1970.
10. Hille, B.Ionic Cha nnels of Excita ble Mem bra nes. Sunderland, MA: Sinauer Assoc., 1984.
11. Manalis, R. S., and L. Hastings.Electrical gradients across an ion-exchange membrane in student’s artificial cell. J. Appl. Physiol. 36: 769–770, 1974.
12. Morris, J. G.A Biologist’s Physica l Chem istry. Reading, MA: Addison-Wesley, 1968.