Classification of agricultural fields using time series of dual polarimetry
TerraSAR-X images
S. Mirzaee a, *, M. Motagha, b , H. Arefi a
, M. Nooryazdanc
a University of Tehran, Dept. of Surveying and Geomatics Eng., Tehran, Iran - (saramirzaee, hossein.arefi)@ut.ac.ir b GFZ German Research Centre for Geosciences, Section of Remote Sensing, 14473, Potsdam, Germany - [email protected]
c Forest, Range and Watershed Management of Iran, Lorestan province - [email protected]
KEY WORDS: Dualpolarimetric radar, TerraSAR-X, Classification, SVM, Multitemporal
ABSTRACT:
Due to its special imaging characteristics, Synthetic Aperture Radar (SAR) has become an important source of information for a variety of remote sensing applications dealing with environmental changes. SAR images contain information about both phase and intensity in different polarization modes, making them sensitive to geometrical structure and physical properties of the targets such as dielectric and plant water content. In this study we investigate multi temporal changes occurring to different crop types due to phenological changes using high-resolution TerraSAR-X imagers. The dataset includes 17 dual-polarimetry TSX data acquired from June 2012 to August 2013 in Lorestan province, Iran. Several features are extracted from polarized data and classified using support vector machine (SVM) classifier. Training samples and different features employed in classification are also assessed in the study. Results show a satisfactory accuracy for classification which is about 0.91 in kappa coefficient.
* Corresponding author.
1. INTRODUCTION
Agricultural monitoring is one of the important issues for every community as it is one of the economic foundations and is
related to humans’ food preparation. In this regard monitoring
phenological changes and classification of different crop types with the aim of recognizing growth behaviour, cultivation problems and crop yield estimation has received more considerations in recent years.
Satellite radar imagery provides reliable and frequent imaging capability from space. Due to its all-weather functionality, sensitivity to target geometrical structure and orientation, soil moisture and dielectric constant radar imagery has proven powerful for applications which need frequent imagery over an area or involving with the soil and vegetation condition. One of the limitations of radar imagery for classification purposes is the lack of dimension for a single image. There are different ways to overcome this limitation by employing different integrations such as using multifrequency, multipolarization, and multitemporal observations in combination with optical data ( Dhar et al., (2009) and Zhao et al., (2014))
Sabour et al., (2008) used dual polarization HH/VH time series of ENVISAT data for classification of crop types. H/A/alpha decomposition of fully polarimetric L-band data and also hybrid decomposition parameters behaviour during growing season of agricultural areas is investigated by Jain (2010). Zhao et al., (2014) discussed about the feasibility of c-and x-band polarimetric SAR images to crop harvest pattern recognition and tried to classify them with a decision tree algorithm. Voormansik et al., (2013) investigated the capability of dual polarimetry TerraSAR-X (TSX) images for detecting grassland cutting practices. In this research we have utilized the
underlying phenological characteristics of different crops which may exist in polarimetric features to show the ability of temporal signatures for agricultural classification purposes. Support vector machine (SVM) as kernel based supervised classifier was used for this purpose. To improve the accuracy, a modification has been done on the training samples and finally, results of classification with different parameters are compared.
2. TEST SITE AND DATA SET
2.1 Study area
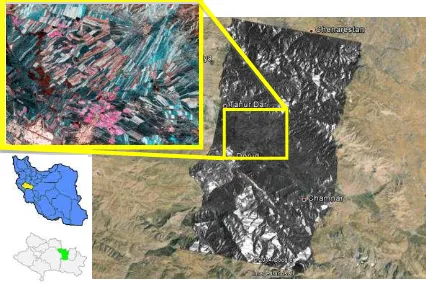
Our test site is located in the north east of Doroud city in Lorestan province, Iran. It is located in a region with centre coordinate of 33°31'55.00"N, 49° 6'8.00"E and a population of 162,800 people. The area includes agricultural fields with different crop types, which are mostly cereals and beans, rice and alfalfa.
2.2 Satellite Data
Figure 1: An example of a TSX amplitude image of July 26th 2012 over google earth image in Doroud and the subset area shown with RGB colour composite in Pauli basis over the
agricultural fields.
3. PROCESSING STEPS AND RESULTS
3.1 Feature extraction
After data separation of each year we have a subset of the desired area from the whole scene. To reduce the effect of speckle, SSC images were converted to 5*5 multilooked complex images and projected to ground range with geocoding, so that the final resolution is 12m. Every individual point scatterer can be described by a target vector in pauli basis with fully polarimetric monostatic mode as follows (Lee and Pottier, 2009): scattering matrix and SHVis the cross-polarized one.
To obtain information about the distributed targets such as soil and vegetation, a coherency matrix is formed which is shown in equation 2 and every element of this matrix, is a spatially average of the adjacent pixels response (Lee and Pottier, 2009).
†
k.k
=
T
(2)
H/A/Alpha polarimetric decomposition which is based on eigenvector decomposition of the (2×2) complex covariance matrix and has been described by Pottier et al., (2009), is utilized here with a difference that instead of covariance matrix we used the top left sub matrix of equation (2). In fact the target vector of equation (1) is formed with the first two elements including HH and VV polarizations. Therefore the decomposition parameters, i.e. Entropy/Anisotropy/Alpha, are calculated as follows: shown in equation 2, and the equation 3 shows the eigenvector display. You can see the eigenvalue decomposition of T2 as it is shown in equation 4.
1
2 1 2
2 2The pseudo-probabilities of the T2 is calculated as:
,
Now by using pseudo-probability (pi) values of the eigenvalues
(i), entropy (H), Anisotropy (A), and alpha angle () are
Coherence (HHVV) and ratio between HH and VV are also calculated as follows:
In this study, the support vector machine (SVM) classifier with RBF1 kernel is employed. SVM is a supervised linear Kernel-base classifier which needs careful attention in the procedure of training samples selection (Srivastava and Bhambhu, 2010). One of the main properties of SVM is that it doesn’t suffer from the limitation of training samples and data dimensionality. However, the accuracy of training samples highly affects the final result. In order to be sure about the quality of training samples, a refinement has been applied which will be discussed more in the next subsection. Radar images in x-band are much more influenced by speckle phenomenon due to the small wavelength. So for further suppressing of this effect on the classification accuracy, all features were speckle filtered using refined Lee filter (Lee, 1981) with a 3×3 window size and then stacked for the two years separately. Accordingly we have 7 parameters for each year (entropy, anisotropy, dominant scattering alpha angle, coherence magnitude between HH and VV, the ratio of HH intensity to VV intensity, with HH and VV backscatter) which formed 77 stacked bands for 2012 and 42 for 2013. The RBF kernel parameters include gamma and penalty factors which were tested with different values to obtain the best ones. However, the classification results were not affected much by selecting gamma factors. Therefore, this value was chosen
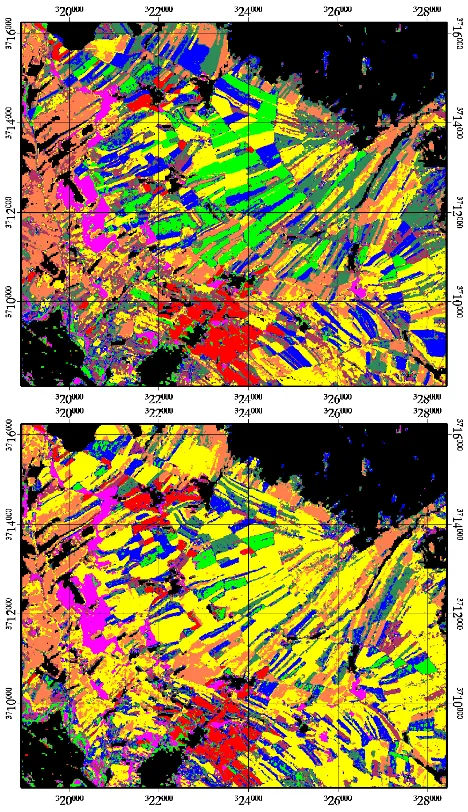
only relative to the number of bands participating in the classification, and it was 1 divided by the number of bands. But the penalty factor was selected as 1000 with respect to the overall accuracy of the classification. The reference map for each year which is shown in Figure 2 was provided through local survey from the farmers, so 8 classes were considered for each year.
Figure 2: Reference maps for 2012 (on the top) and 2013 (on the bottom)
3.3 Refinement of training samples
In order to investigate the accuracy of training samples, a modification procedure is employed after training sample collection. This procedure includes a 3-sigma outlier detection test, which is based on mean and standard deviation of the desired class. Samples which are out of the interval of 3 sigma are assumed to be as outliers (Kasunic, 2011). This assumption preserves 99% of the observations while detecting the outliers. This step was done using the first 3 bands of PCA2 transform. The reason of selecting PCA transform was to suppress the noise further while preserving the most information with reducing the number of bands.
3.4 Classification result and accuracy assessment
After outlier detection of training samples, 1% of them were used to train the support vectors while the rest were utilized for accuracy assessment. In order to see the effect of refinement on the classification accuracy the full data set was classified and assessed two times with and without refinement. The results showed that the overall accuracy increases by about 2%. Accuracy assessment is done with calculating a number of criteria such as completeness, correctness and quality (Heipke and Mayer, 1997), the overall accuracy (OA) and kappa coefficient (Liu et al., 2007). Kappa coefficient and ovaerall accuracy were estimated for the whole image with different
2 Principal Component Analysis
combinations of features for each year. The other 3 criteria were assessed only for a subset area of about 1.69 km2. Formulation and results come as follows.
(11) refernce of
Length
reference matched
of Length s
ompletenes
c
(12) extraction
of Length
extraction matched
of Length s
correctnes
(13) qq
extraction matched
of Length quality
Where:
reference unmatched
of Length data extracted of
Length
qq
Figure 3: Accuracy assessment of classification results with different parameters combination for the year 2012. FP: Full
parameters stack, Co: Coherency, Ra: Ratio of HH/VV, En: Entropy, An: Anisotropy, Al: Alpha, SHH and SVV: polarimetric backscatter values, PCA: 3 first bands of PCA.
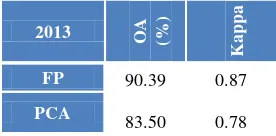
2013 OA (%)
K
a
p
p
a
FP 90.39 0.87
PCA 83.50 0.78
Table 1: accuracy assessment of 2013 classification
User and producer accuracies for the full parameters case in each year are also shown in Table 2.
2012 2013
UA PA UA PA
Rice 98.62 96.36 98.97 91.28
Bean 96.04 95.11 90.34 90.00
Potato 88.81 95.03 72.21 79.39
Barley &
wheat 94.76 94.5 95.17 9.82
Alfalfa 79.74 74.21 76.24 69.79
Pasture 99.7 96.88 98.35 95.03
Fava beans 84.04 86.67 80.62 78.14
Unknown 99.81 94.37 94.24 87.46
Table 2: User and producer accuracies for the full parameters case
Reference map FP Co, Ra, En, An, Al
Co Al En
PCA An SHH and SVV
Ra
Figure 4: classification results of the subset area for quality assessment with the specified band combination written under each figure (for the year 2012)
co
m
p
lete
n
ess
co
rr
ec
tn
ess
q
u
a
li
ty
FP 0.88 0.84 0.75
Co, Ra, En, An, Al 0.84 0.81 0.70
Co 0.83 0.80 0.69
En 0.74 0.71 0.57
An 0.74 0.72 0.58
Al 0.75 0.73 0.59
SHH and SVV 0.77 0.76 0.62
Ra 0.54 0.51 0.36
PCA 0.80 0.76 0.64
Table 3: completeness, correctness and quality assessment of different band combinations for the subset area of the year 2012
The assessment was repeated for the year 2013 with only the full parameters case and the results are shown in Figure 5 and Table 4.
Reference map FP
Figure 5: Area used for quality assessment of classification results for 2013 with full parameters set
co
m
p
lete
n
ess
co
rr
ec
tn
ess
q
u
a
li
ty
FP 0.84 0.79 0.69
Table 4: completeness, correctness and quality assessment of full parameters case for the subset area of the year 2013
To show the classification results of agricultural areas, a vegetation mask was built and applied to omit the extra classes such as urban areas. The mask was built using NDVI maximum composite of 14 Landsat 8 images over the year 2013. A threshold of 0.2 is used corresponding to typical and semi-intensive vegetation. The masked classified map for both years is shown in Figure 66 and 7 corresponding to the years 2012 and 2013 respectively.
After classification and assessment procedures, classes were spectrally averaged in all the features. Then the time series behaviour is plotted for each feature. The plots are depicted in Figure 8. This is another proof of the separated classes and their correspondence for 2 years. As we can see, each class is shown in a specific colour with different line type for each year. The same classes follow the same behaviour every year but there is some fluctuations. The reason may be because of climate change and the amount of moisture due to precipitation aactivities. This assumption should be investigated in the future.
Figure 6 : Classification map of the year 2012 (on the top) and 2013 (on the bottom)
4. DISCUSSION AND CONCLUSION
The aim of this paper was to show the capability of multitemporal x-band dual polarimetric radar images to classify agricultural fields. A classification procedure has been proposed using kernel based supervised SVM classifier. Although SVM is not suffered from data dimensionality limitations, but its accuracy is highly dependent on the accuracy of the training data. Therefore to become certain about the training data quality, we applied a procedure named training samples refinement including an outlier detection. After the refinement, classification was done and assessed with different feature combinations. As it is shown in Figure 3, the accuracy and quality of classification with using only time series signature of HH to VV ratio, is very low and less than all others. However, as it is depicted in the Error! Reference source not found.8, the pick value of this feature for class 1 is higher than other crop types, so it is an appropriate indicator for separating class 1 which corresponds to rice fields. The characteristics and behaviour of this feature has been used for rice area crop monitoring in several works such as Bouvet and Le Toan, (2009).
As we can see from the results, the final classification map does not follow a specific pattern. The changes are due to alternating cultivation between crops. Farmers do not always cultivate a specific plant in this region in order to save the quality of soil. So crop types like wheat, barley and beans are implanted alternatively in a field every 2 to 4 years. This is an important issue for the image preparation. Mapping crop types in an area through phenological changes requires acquiring dataset within one agricultural season in order to not have any changes, in particular for the areas with diversity of crop cultivation.
ACKNOWLEDGEMENTS
The copyright of SAR data belongs to DLR (German Aerospace Center) and was provided under the research proposal XTI_LAND0505.
REFERENCES
Bouvet, a., Le Toan, T., 2009. Monitoring of the Rice Cropping System in the Mekong Delta Using ENVISAT/ASAR Dual Polarization Data. IEEE Trans. Geosci. Remote Sens. 47, 517–526. doi:10.1109/TGRS.2008.2007963 De Lathauwer, L., De Moor, B., Vandewalle, J., 2000. An
introduction to independent component analysis. J. Chemom. 14, 123–149.
doi:10.1002/1099-128X(200005/06)14:3<123::AID-CEM589>3.0.CO;2-1
Dhar, T., Gray, D., Menges, C., 2009. Agricultural performance monitoring with polarimetric SAR and optical imagery.
… SAR Polarim. Polarim. … 26–30.
Heipke, C., Mayer, H., 1997. Evaluation of automatic road extraction. Int. Arch. ….
Kasunic, M., 2011. An Investigation of Techniques for Detecting Data Anomalies in Earned Value Management Data.
Lee, J.-S., Pottier, E., 2009. Polarimetric Radar Imaging: From Basics to Applications, New York.
doi:10.1080/01431161.2010.535193
Liu, C., Frazier, P., Kumar, L., 2007. Comparative assessment of the measures of thematic classification accuracy. Remote Sens. Environ. 107, 606–616.
doi:10.1016/j.rse.2006.10.010
Pottier, E., Ferro-Famil, L., Allain, S., Cloude, S., Hajnsek, I., Papathanassiou, K., Moreira, A., Williams, M., Minchella, A., Lavalle, M., Desnos, Y.L., 2009. Overview of the PolSARpro v4.0 Software. The open source toolbox for polarimetric and interferometric polarimetric SAR data processing, in: International Geoscience and Remote Sensing Symposium (IGARSS). doi:10.1109/IGARSS.2009.5417532
Sabour, S., Lohmann, P., Soergel, U., 2008. Monitoring Agricultural Activities Using Multi-Temporal ASAR
ENVISAT Data. … Process. Multi-Temporal Data ….
Srivastava, D., Bhambhu, L., 2010. DATA CLASSIFICATION USING SUPPORT VECTOR MACHINE. J. Theor. Appl. Inf. ….
Teknomo, B.K., 2007. K-Means Clustering Tutorial 1–12. Voormansik, K., Jagdhuber, T., Olesk, A., Hajnsek, I.,
Papathanassiou, K.P., 2013. Towards a detection of grassland cutting practices with dual polarimetric TerraSAR-X data. Int. J. Remote Sens. 34, 8081–8103. doi:10.1080/01431161.2013.829593
Zhao, L., Yang, J., Li, P., Zhang, L., 2014. Characteristics Analysis and Classification of Crop Harvest Patterns by Exploiting High-Frequency MultiPolarization SAR Data. IEEE J. Sel. Top. Appl. Earth Obs. Remote Sens. 1–1. doi:10.1109/JSTARS.2014.2308273
Figure 7: Temporal signature of all classes in each feature over an agricultural season
SHH SVV
Entropy Anisotropy
Ratio HH/VV Coherency