LOW COST INFRARED AND NEAR INFRARED SENSORS FOR UAVS
Samuel T. Aden a, James P. Bialas a, Zachary Champion a, Eugene Levin a, Jessica L. McCarty b
a School of Technology, Michigan Technological University, Houghton, MI, USA ([email protected]) b Michigan Tech Research Institute, Ann Arbor, MI, USA
KEY WORDS: UAVs, Mapping, Visualization, Multisensor, Aerial, Infrared, Temperature, Imagery, Experimental, Forest fires,
ABSTRACT:
Thermal remote sensing has a wide range of applications, though the extent of its use is inhibited by cost. Robotic and computer components are now widely available to consumers on a scale that makes thermal data a readily accessible resource. In this project, thermal imagery collected via a lightweight remote sensing Unmanned Aerial Vehicle (UAV) was used to create a surface temperature map for the purpose of providing wildland firefighting crews with a cost-effective and time-saving resource. The UAV system proved to be flexible, allowing for customized sensor packages to be designed that could include visible or infrared cameras, GPS, temperature sensors, and rangefinders, in addition to many data management options. Altogether, such a UAV system could be used to rapidly collect thermal and aerial data, with a geographic accuracy of less than one meter.
1. INTRODUCTION
Forest fires cause environmental disasters worldwide and can result in high economic and ecological damages. Satellite, aerial and ground-based remote sensing platforms have been developed to address this concern by detecting, recording, and mapping wildfire activity.7 In many cases the temporal and spatial resolutions of space systems are not adequate for forest-fire fighting, and aerial platforms are often cost-prohibitive.3 Ground based systems with high-resolution visual and infrared cameras demonstrate good performance for early detection and monitoring, though the main disadvantage of these systems is their limited mobility over varied and overgrown terrain.6
In Michigan’s Upper Peninsula, the sparse local population and vast undeveloped geography make the task of monitoring wildfire activity a significant task. Jason Mittlestat, a forester who works for the Michigan Department of Natural Resources (DNR; www.michigan.gov/dnr) out of Baraga, MI described the techniques for “hotspot” detection (burning or burned area of relatively high heat and/or activity) as an area where UAVs could significantly increase the effectiveness of small crews by saving both time and money. The only airborne facilities that a state-level agency like the Michigan DNR currently have access to are fixed wing planes without infrared capabilities, or helicopters brought in from Michigan’s Lower Peninsula or Canada if the situation will cause several thousand dollars in fire damage.5 Space platforms are also largely inadequate to effectively monitor wildfire activity in real time for a variety of reasons, including a satellite’s inability to deviate from its orbit, overcome atmospheric barriers such as clouds, and acquire imagery of a specific target of a desired spatial or temporal resolution. Much of the current hotspot detection is up to wildland firefighting crews
on foot with handheld detectors.5 With the amount of seasonally combustible land in the Upper Peninsula, this is not an efficient technique, particularly in emergency situations.
Employing appropriately designed UAVs can overcome the drawbacks highlighted by the Michigan DNR. UAVs can be very helpful for wildfire monitoring, as they can bridge the gap between the spatial scales currently available from aerial, satellite, and ground-based systems. A UAV may also adapt to accommodate environmental variables in real time with remote- or auto-pilot to optimize its vantage point and preserve itself.2 Recently UAVs have become increasingly available to professionals and consumers with limited or prescribed budgets. The purpose of this study was to develop methods and create geospatial products from a custom-built UAV platform for the purpose of wildfire hotspot detection.
2. RELATED WORK
emergency situations has been hailed as providing services “beyond the capabilities of human-pilot endurance.”1 While this beyond human characteristic is lauded in marketing pamphlets, automating portions of the response to a hazardous situation with a reliable technology offers a host of safety benefits and new methods for environmental monitoring.
UAVs are not only useful for monitoring an active fire, but may also yield valuable data before, throughout the various burning stages, and after.6 A UAV equipped with multispectral cameras may detect water stress and differentiate vegetation types, which can supplement existing land cover and land use data. The combination of infrared and visual images is useful to provide robust fire detection with high detection probability and low false alarm rates.4 Estimations of fire mechanics and damage can be obtained by rapid processing of geospatial data with open source software, much of which is rigorously documented online and does not require extensive training.
While UAVs can theoretically be equipped with active and passive sensors that are sensitive to specific electromagnetic wavelengths, their payload is limited by the capabilities of the flight vehicle itself. One of the main obstacles that UAV designers encounter is that few low-cost or commonly available UAV systems have the “high endurance and high payload capable of carrying relatively heavy observation sensors,”6 including most radar and lidar systems. Low-cost UAVs are not typically designed to carry such equipment and most imaging systems are not typically designed to be mounted on a UAV. Nevertheless, smaller, lighter sensors sensitive to smaller electromagnetic wavelength ranges may still provide suitable data.
In addition to cameras, a UAV’s payload must include methods for storing or moving data somewhere safe for it to be made accessible away from the fire event. The flight may also benefit from additional sensors to supplement the data gathered by the camera(s) with additional context, for example with GPS data. In 2003, American Photogrammetric and Remote Sensing (ASPRS) researchers set out to build a robust UAV system that could “provide improved geo-rectification of fire image data,” and “globally distribute the real-time corrected thermal imagery via the Internet,” all in “near real-time” (which they defined to be within two minutes)1. Supported by industry leaders and state-of-the-art technologies, this study demonstrated the functionality that integrating these robotic and geospatial technologies could provide. Over a decade later, access to these technologies has planning and allocation and coordination within the multi-UAV
fleet. The perception system should integrate all the information from the UAV sensors for fire monitoring.”5 Fire propagation may be estimated and decisions may be made based on real-time perceptions by calculating aspects such as shape and position of the fire front, or rate of spread and the maximum height of the flames, if they are able to be detected. In this way the perception system was able to observe and coordinate an appropriate response in real time.
The goal of this project was to provide cost-effective UAV support for a state-level fire agency. Since the vehicle itself would certainly be the most expensive component, this immediately implied that imaging abilities would be subject to the payload capacity of our flight vehicle. While it is clear from Ollero et al. (2006) that pre- and post-wildfire monitoring would benefit from a robust, professional imaging system, off-the-shelf technology is also available to find alternative means to produce a similar product. This applies not only to the cameras and sensors, but also to the on-board data storage, georeferencing, processing, and distribution. Finally, whether it be through the use of a full auto-pilot or a primitive noise-filtering, data-gathering system, intelligent software could be chosen or written to optimize each component’s performance.
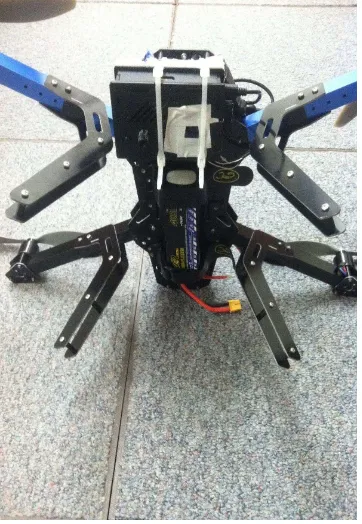
Figure 1. Close-up image of the underside of the 3D Robotics Quad platform
Figure 2. Close-up image of the top of the 3D Robotics Quad platform.
Thermal imaging cameras, at just under $1000 USD, were prohibitively expensive for this project. The low resolution in this price class (~ 80 x 60 pixels) makes it less desirable. Low cost infrared heat guns were also considered, these take a single reading of temperature in their field of view, often using a laser to assist in aiming the device. For sake of time and cost, MLX90614
series of sensors
(http://www.digikey.com/catalog/en/partgroup/mlx90614-15/20353) was deemed appropriate for this project (less than $100 USD). MLX90614 series of sensors communicate via the I2C protocol which can be integrated with the UAV’s native autopilot system or lightweight onboard computer. These systems can measure ambient temperature of the sensor itself making it an ideal on-board temperature sensor for future development in
navigating fire scenes and avoiding pockets of hot air that are potentially dangerous to the UAV itself. We chose a MLX90614ESF-BCI-000-TU-ND with a 5 degree field of view, giving us a ground resolution of about 4m at 50m flying height.
A Raspberry Pi single board computer
(http://www.raspberrypi.org) was used to run the MLX90614ESF-BCI-000-TU-ND sensor. Code from the online
Raspberry Pi development community
(http://www.raspberrypi.org/forums/viewtopic.php?t=17738) was modified to suit our needs by setting the logging interval and recording timestamps in microseconds (see open source code here: http://askel.tc.mtu.edu/mlx.c). Raspberry Pi has other advantages, including a direct link to the autopilot system. By using the mavproxy software on the Raspberry Pi, we could log telemetry data in sync with the clock on the Pi. This makes correlation with data from the sensor much easier. The Raspberry Pi has no battery backed clock, so the data log timestamps will not match the autopilot data timestamps if we use the autopilot logs themselves. The link to the autopilot is bidirectional, so the Raspberry Pi can issue command to the autopilot.
Included on the UAV system was the capability for aerial imaging. This system utililzed the Pi-NoIR camera (http://www.raspberrypi.org/tag/pi-noir/) native to the Raspberry Pi. While it is a low cost camera similar to cellphone cameras, it requires no modification to sense NIR signals. It is also very small and very light.
Figure 3. MLX90614ESF-BCI-000-TU-ND sensor, Pi-NoIR, and Raspberry Pi in a Nwazet Pi Camera Box
4. METHODS
4.1 UAV experimentation
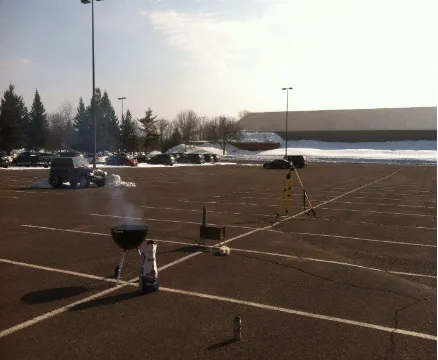
Five test flights were completed on and around the campus of Michigan Technological University during the spring of 2014. The UAV and complete camera box system was piloted at a height of 15 to 50 m above experimental heat sources. Four ground control points (GCPs) were surveyed, two with heat sources: a lit charcoal grill was placed over control point 2 and a lit camping wood stove was placed in the flightpath. Ground control was laid using standard surveying protocol that entailed a 20 minute fast static session at each point using a Trimble R-8 GPS and a TSC3 Data Collector. GCP coordinates were verified in Google Earth. A full automated flight was executed at a 50 meter flying height, including a descent in loiter mode to 15 meters over the ground control to evaluate how the system would register heat sources.
Figure 4. Experimental heat sources for testing UAV system.
4.2 Data Processing to Retrieve Temperature
The first step in analyzing the resulting temperature data is correlating the data with position and UAV attitude (“Attitude” refers to control over the orientation of an object (generally pitch, yaw, and roll) in 3D space). The flight logs contain GPS and attitude position at selected time intervals as do the IR sensor logs. A script was written that correlates the closest attitude and temperature data in time for any given GPS position (http://askel.tc.mtu.edu/flight2/flightlog/corr.pl). Note: because the IR sensor logs data at about 3 times the rate of the GPS, interval temperature readings are inserted in the output and marked as DATA.
5. RESULTS
We automated data extraction from the UAV system and output temperature data can be downloaded at http://askel.tc.mtu.edu/flight2/flightlog/test.txt (with header format of: gps_time, lat, lon, altitude, heading, attitude log difference, pitch, yaw, roll, temp log difference, ambient temp, measured temp).
5.1 KML visualizations
Visualizations of the flight and data were also completed (code: http://askel.tc.mtu.edu/flight2/flightlog/kml.py). A KML file containing individual temperature readings as points on a map for both the ambient and ground temperature readings was produced (Figure 5). Points are colorized relative to each other temperature and labeled with the temperature reading taken. A second KML was produced to show the temperature readings in real-space, including altitude (Figure 6). This KML file can be downloaded here: ttp://askel.tc.mtu.edu/flight2/flightlog/temp-data.kml
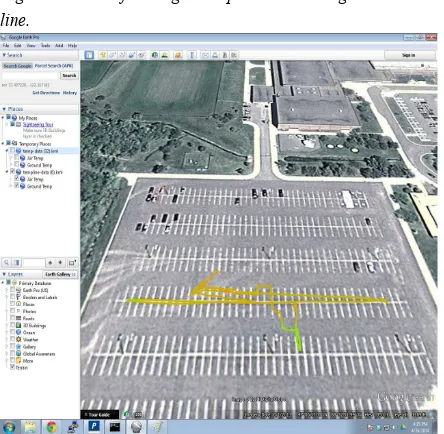
A line KML was produced to indicate the change in temperature across space (http://askel.tc.mtu.edu/flight2/flightlog/line.py). This visualization was created by creating a line between points colorized by calculating the average temperature of the temperatures read between those two points. The changing color indicates the change in temperature, allowing a user too quickly determine “hot spots” (Figure 7). A intuitive color scale was used, varying from green indicating the coldest temperatures to red indicating the highest temperatures. This KML file can be
downloaded here:
Figure 5. KML of averaged temperature readings visualized as a line.
The autopilot software onboard the UAV was also capable of generating a KML file of the flight path of the UAV as well as other flight-specific data (Figure 8). The KML that corresponds to
the above data can be found here:
http://askel.tc.mtu.edu/flight2/flightlog/flight.tlog.kmz
5.2 MicMac Visualizations
MicMac is a open source close range photogrammetric processing software package available from France’s Institut Géographique National (http://logiciels.ign.fr/?-Micmac,3-). It utilizes a SIFT algorithm to match images and do a simple relative camera reconstruction. From this, 3D point clouds and orthorectified imagery can be generated.
The Pi NoIR camera has several issues that make photogrammetric processing difficult. First, the relatively short focal length of 3.6mm gives a pronounced fisheye effect that must be corrected for. Second, the camera does not feature a traditional shutter, but instead records the value of each successive row of sensors in the matrix, scanning across all the sensors. This results in image distortions as the camera moves. And finally, the camera features an automatic white balance that can result in image color variation between successive images. It was found that the camera needs a two second delay between being first addressed in software and taking the actual image for the white balance to adjust suitably.
While the camera distortions provided a poor 3d point cloud result, MicMac was able to produce a useful orthoimage. MicMac does provide the ability to rectify this image with ground control.
Figure 6. Orthorectified visualization of imagery using MicMac software.
Since the Pi NoIR camera does not have a NIR filter installed, it is possible to capture NIR imagery on one of the RGB channels by filtering out the corresponding color. Using a blue filter makes the blue channel the NIR channel. If we used red as the visible light channel, we can create a proxy NDVI image. Figure 7 shows live vegetation clearly delineated in green.
Figure 7. NDVI of orthoimage.
5.3 MATLAB Visualization
code used to produce the MATLAB visualization is available here: http://askel.tc.mtu.edu/flightdatacontour.m.
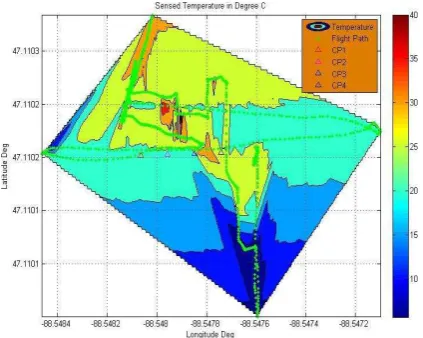
Figure 8. MATLAB visualization of temperature peaks from UAV flight (note: X and Y axis are not to scale).
6. DISCUSSION AND CONCLUSIONS
In this project, we developed a low-cost thermal scanning UAV platform, and assessed its imaging capabilities. While the tools we employed required extensive preparation and on-site maintenance, it nevertheless proved that preliminary hotspot detection is well within the reach of our approach. Our platform was able to georeference thermal fluctuations of far less than one degree (°C), and with proper calibration of the NoIR camera, it also serves as an effective aerial reconnaissance tool for photogrammetric purposes.
In our test flights, we confirmed that we could identify a definite region of interest based on temperature readings. There was a significant spike in temperature readings that was easily resolvable by the sensitivity and frequency of our sensor. With the data from the temperature sensor, we were able to create a thermal map of the surface. These temperature readings were associated with a GPS value, which made the data easily portable to a KML format for viewing in Google Earth. Furthermore, the data could be averaged and extrapolated to create a heat map of the area scanned.
Another way to create a heat map would be to extrapolate each temperature reading based on the sensor's 5 degree field of view, and then average the temperature values between regions rather than points. This would only be more useful with a more comprehensive flight path over a more defined region. Our UAV setup offers the user an affordable means of detecting hot spots in a post wildfire situation. However, there is still work that may be done with this concept. For instance, since the temperature readings are immediate, the UAV itself could also be programmed to react based on the data it received.2,4 It could also be programmed to perform its own preliminary data processing by
identifying areas of concern by only recording temperatures above a certain threshold. This would also help cut down on the amount of data accumulated, if that were an issue.
Though we used Google Earth and MATLAB to visualize our data, the output from the UAV's GPS could also be used to display the data in GIS software. The flight path could be imported as vector points, and the MATLAB charts or the NoIR photos could be exported as raster images. Also, processed temperature data could be used directly in the creation of vector polygons.
While GIS is useful, it is important to note that this is a tool to assist fire fighters who are operating in the field. This means that the data visualization may not necessitate the use of a full GIS software suite. Processing the data with lightweight scripts and visualizing it with less cumbersome software would mean that wildfire crews would not need to carry around as much computing power. For example, overall project costs could be further reduced by processing this data with open source freeware, such as Python (https://www.python.org/) or R (http://www.r-project.org/), in order to avoid the licensing fees that come with MATLAB and proprietary GIS software (including Google Earth Pro).
Our work demonstrated the potential for new and increasingly economical technologies to provide rapid thermal imagery. This opens many possibilities for wildland firefighters, wildland fire incident command centers, and land managers, and will make it faster and more affordable for them to assess the location of hotspots after a wildfire event.
7. ACKNOWLEDGEMENTS
Special thanks to Dr. Eugene Levin, Dr. Yushin Ahn, John Kaminski, Kavitha Lakshmi, and Ioakeim Tellidis for providing critical advice and assistance with the project.
8. REFERENCES
Ambrosia, V.G., S.S. Wegener, D.V. Sullivan, S.W. Buechel, J.A. Brass, S.E. Dunagan, R.G. Higgins, E.A. Hildum and S.M. Schoenung, April 2003, “Demonstrating UAV-
Acquired Real-Time Thermal Data Over Fires”, Photogrammetric
Engineering and Remote Sensing.
http://info.asprs.org/publications/pers/2003journal/april/2003_apr _391-402.pdf
Demonstration", American Institute of Aeronautics and Astronautics. http://arc.aiaa.org/doi/abs/10.2514/6.2011-1636
Lentile, Leigh B.; Holden, Zachary A.; Smith, Alistair M.S.; Falkowski, Michael J.; Hudak, Andrew T.; Morgan, Penelope; Lewis, SarahA.; Gessler, Paul E.; and Benson, Nate C., "Remote sensing techniques to assess active fire characteristics and post-fire effects" (2006). USDA Forest Service / UNL Faculty Publications. Paper 194.
Merino, Luis, Caballero Fernando, Martinez-de-Dios J. Ramiro, I. Maza, and Anibal Ollero. 2010, "Automatic Forest Fire Monitoring and Measurement using Unmanned Aerial Vehicles." International Conference on Forest Fire Research VI. http://aramis.upo.es/isa/lmercab/publications/papers/ICFFR10_M erinoetal.pdf
Mittlestat, Jason. Interviewed by authors, 10 Feb 2014, Houghton MI.
Ollero, A., and Martinez de Dios, J.R., Merino, L., 2006, “Unmanned Aerial Vehicles as tools for forest-fire fighting”, International Conference on Forest Fire Research V http://grvc.us.es/publica/congresosint/documentos/2006VICFFR_ AOLLERO.pdf