EXTRACTION OF URBAN TREES FROM INTEGRATED AIRBORNE BASED
DIGITAL IMAGE AND LIDAR POINT CLOUD DATASETS - INITIAL RESULTS
M. A. Dogon-yaroac, P. Kumara, A. Abdul Rahmana, and G. Buyuksalihb.
a3D GIS Research Lab., Dept. of Geoinformatics, Universiti Teknologi Malaysia, 81310, Johor, Malaysia - [email protected]. bBIMTAS, Istanbul, Turkey. cDept. of Surveying and Geoinformatics, Abubakar Tafawa Balewa University, PMB 0248,
Bauchi, Nigeria – [email protected].
KEY WORDS: Urban trees extraction, airborne LIDAR, multispectral image, semi-automated.
ABSTRACT
Timely and accurate acquisition of information on the condition and structural changes of urban trees serves as a tool for decision makers to better appreciate urban ecosystems and their numerous values which are critical to building up strategies for sustainable development. The conventional techniques used for extracting tree features include; ground surveying and interpretation of the aerial photography. However, these techniques are associated with some constraint, such as labour intensive field work, a lot of financial requirement, influences by weather condition and topographical covers which can be overcome by means of integrated airborne based LiDAR and very high resolution digital image datasets. This study presented a semi-automated approach for extracting urban trees from integrated airborne based LIDAR and multispectral digital image datasets over Istanbul city of Turkey. The above scheme includes detection and extraction of shadow free vegetation features based on spectral properties of digital images using shadow index and NDVI techniques and automated extraction of 3D information about vegetation features from the integrated processing of shadow free vegetation image and LiDAR point cloud datasets. The ability of the developed algorithms shows a promising result as an automated and cost effective approach to estimating and delineated 3D information of urban trees. The research also proved that integrated datasets is a suitable technology and a viable source of information for city managers to be used in urban trees management.
1. INTRODUCTION
Urban trees have many advantages such as preserving energy, improving water quality, minimizing greenhouse gasses and many other environmental pollutants, as well as connecting urban dwellers with nature (McPherson, E. G., 2006, Nowak D. J., 2007). In spite of efforts and capital spent on the conservation of trees, many city authorities often do not have an all- inclusive information on their condition (Yang, J., 2012). In order to realize numerous economic, environmental and sustainable decision-making processes, an accurate, up-to-date and in-depth information on spatial distributions and health conditions of urban ecosystem is necessary. Accurate techniques for locating and mapping urban trees help city planners and other decision makers to better understand how much canopy cover exists, identify new planting, removal, or reforestation opportunities and what locations have the greatest need or potential to maximize benefits of return on investment. It can also help track trends or changes to the urban trees over time and inform future management decisions. Conventionally, this information is obtained through field surveying methods and interpretation of the aerial photography. Generally, ground surveying techniques are highly expensive, laborious (tedious), time-consuming and usually cannot be carry out over large areas. In addition, field surveying can only be carried out in areas reachable by the surveyors with insufficient or no data obtained in restricted properties and other unreachable areas. It is not easy, if not impossible to generate or create urban trees inventory for the whole city through field surveying. On the other hand, aerial photography does not directly provide 3D information of trees structure (Chen, et al., 2006) and is easily influenced by weather condition and topographical covers (Chen, et al., 2005). Therefore, somewhat
insufficient information is obtainable about trees in many cities around the world, which is a major limitation for actualizing their benefits (Zhang, and Qiu, 2012).
However, LIDAR systems have no band which makes it insufficient for vegetation classification, especially in urban forests with diverse species and high spatial heterogeneity. Digital multispectral imagine, usually possesses different bands, therefore, exhibit a great potential in identifying tree feature with their rich spectral contents. Airborne LIDAR data and imagery are highly complementary (Caldwell, et al., 2005), the images can validate the filtering accuracy (Jawak, et al., 2013) while the elevation information from LIDAR can be used to ortho-rectify images datasets (Flood, M., 2002, Savopol, et al., 2004). Highly dense LIDAR data with multiple returns per square meter would be overwhelming for tree crown depiction and for determination of crown shape while spectral properties can be used to differentiate tree objects (Holmgren, et al., 2008, MacFaden, et al., 2012). It is assumed that both data sources concurrently will be more successful for trees detection in contrast with any of them alone (Chen, et al., 2005, Zhang, C., 2010).
The objectives of this study includes extraction of shadow free vegetation features from the digital images using shadow index and NDVI techniques and automated extraction of 3D information about the vegetation features from the integrated processing of shadow free vegetation image and LiDAR point cloud datasets. The remaining parts of this paper describes, the study area and datasets used in section 2, the extraction techniques in section 3, the results and discussion in section 4 and finally, the conclusion in section 5.
2 STUDY AREA AND DATA 2.1 Study Area
The study area is located in Besiktas district inside the city centre of Istanbul in north-western Turkey with a total area of 5,343 Km2 (Başar, et al., 2011). Istanbul is among the
most special cities in the world with its position as a bridge between Europe and Asia. The western part of the city is in Europe, and the eastern is in Asia. It is positioned between 280 01’ and 290 55’ eastern longitudes and 410
33’ and 400 28’ latitudes. Bosphorus strait (Figure 1)
which connects the Sea of Marmara at the north and the Black Sea to its south divides the city into an Asian city closest to Europe and the closest European city to Asia (Gregory, T. E., 2010, Efe, et al., 2011). Istanbul is a typical urban area with complex spatial assemblages of vegetation, buildings, roads, and other man-made features.
Figure 1: Istanbul and the Bosphorus strait.
2.2 Datasets Used
Two datasets were used to achieve the objectives of this research study; namely:
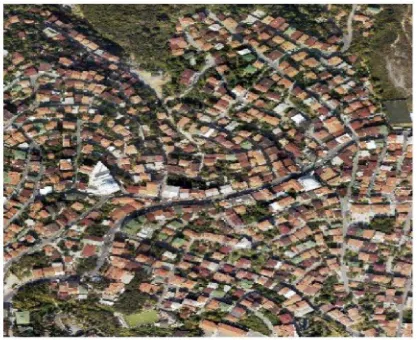
Airborne based multispectral digital images which possess red, green, and blue bands (Figure 2) and near infrared band (Figure 3) at 0.1 and 0.5 spatial resolutions respectively. Airborne based LIDAR points cloud.
These datasets were collected in 2013 by BIMTAS Company in Istanbul, Turkey, using airborne laser scanning system.
2.2.1 Multispectral Digital Images (RGB and NIR Bands)
The multispectral images provide more details about spatial geometry and spectral information about surface of the study area used for detection and extraction of the vegetation features. The spatial reference of the images is WGS 1984, UTM Zone 35N.
Figure 2: RGB bands image
Figure 3: NIR band image.
2.2.2 Airborne LIDAR Point Cloud
about the shape and surface characteristics of the study area through x, y and z points commonly referred to as point clouds. It provides accurate height information which is missing in the digital images and also supporting information about crown shape (Hyyppä, et al., 2008). This information from LiDAR has the ability to ortho-rectify the digital images and generate a well-defined 3D representation of ground and features above the ground surface over wide spatial scales. The LIDAR data contains about 2,335,245 number of points.
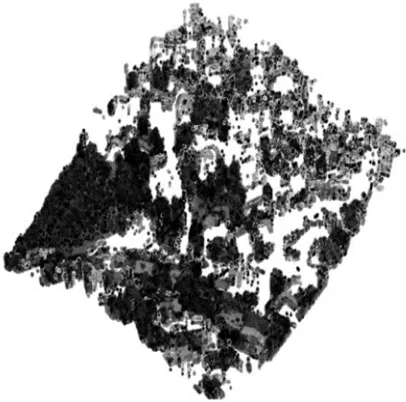
Figure 4: Airborne LIDAR points cloud.
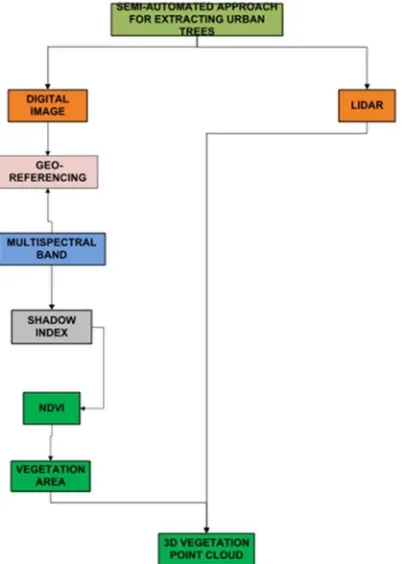
3. THE EXTRACTION TECHNIQUES Figure 5 present a work flow chart for identifying and extracting tree features from the integrated datasets.
Figure 5: The workflow chart.
3.1 Image Geometric Correction
The NIR image does not have the same spatial resolution and pixel depth with the multispectral image. Consequently, the NIR image which has 0.5 spatial resolution and 16bit pixel depth has been geo-rectified in order to have the same spatial reference with the RGB image which has 0.1 spatial resolution and 8bit pixel depth.
3.2 Shadow Index (Si)
Shadow index is an indicator which describes presence of shadow objects for each pixel in a digital image. Consequently, in order to get rid of the confusing spectral problem between reflected spectra of specific kind of trees and the reflected spectra of the shadow of trees, the shadow values of the digital image have been determined using Equation 1 as below.
SI = √ (256 – Red) (256 – NIR) (1) (Mustafa, et al., 2015).
where; NIR and Red are the Near Infrared and the Red reflectance bands respectively.
Furthermore, the shadow index image which provides precise shadows information was thresholded to detect absolute information. By utilizing this threshold value, a binary image was obtained with a value of 0 indicating the non-shadow objects and a value of 1 indicating the shadow objects.
3.3 NDVI
NDVI is an indicator that describes the greenness, relative density and health of vegetation for each pixel in a digital image (Mróz, et al., 2004, Bannari, et al., 1995, Blanco, et al., 2008). The NDVI helps to distinguish between vegetation and non-vegetation features (Geerken, et al., 2005, Moleele, et al., 2001, Fuller, et al., 1998). Therefore, the vegetation objects were separated from non-vegetation objects using Equation 2 as below.
NDVI = (NIR – Red) / (NIR + Red) (2) (Mustafa, et al., 2015)
where; NIR and Red are the Near Infrared and Red- reflectance bands, respectively.
Furthermore, the NDVI image which provides precise information about vegetation features was thresholded to detect absolute information. By utilizing this threshold value, a binary image was obtained with a value of 0 indicating non-vegetation features and a value of 1 indicating vegetation features.
3.5 Extracting 3D Information of Vegetation Features In order to achieve this objective, the shadows free vegetation image and the LIDAR datasets have been integrated to extract 3D information about the vegetation features. This task has been completely processed in a fully automated fashion using the Python programming tool. The modus operandi of the developed algorithm in processing this task includes:
i. Accessing and reading the shadows free vegetation image file.
ii. Detecting contour polygons of the vegetation features.
iii. Determining boundaries of each contour polygon of the vegetation features.
iv. Accessing and reading the LiDAR text file. v. Integrating the shadows free vegetation image
and the LiDAR data files.
vi. Extracting LiDAR points falling inside each polygon of the vegetation features.
vii. Saving the extracted LiDAR points into a new text file.
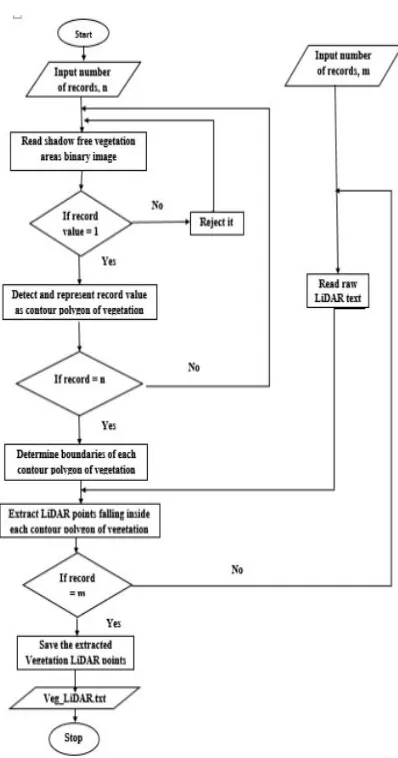
The mode of operation of this task have been represented using pseudo code flow chart. See Figure 6 below for more details.
Figure 6: Pseudo code flow chart of extracting 3D information about vegetation from the integrated datasets
4. RESULTS AND DISCUSSIONS
The purpose of this paper is to develop a feasible and efficient algorithm useful for extracting urban trees from the integrated airborne based LIDAR point cloud and multispectral digital imagine datasets. The above scheme includes extraction of shadow free vegetation features image from the digital image and automated integration of the LIDAR data and shadow free vegetation image in order extract 3D information about vegetation objects.
4.1 Shadow Index
It has been evidently proved that shadows presence is posing a great challenge during trees detection and extraction from the digital image (Mustafa, et al. 2015). This is due to the fact that NDVI normally fails to distinguish between the spectral reflectance of vegetation objects and that of their shadows. Therefore, the shadow index have been used to distinguished pixels which belong to shadow objects on the digital image from those of non-shadow objects by applying Equation 1 to determines shadow values of the digital image on a per-pixel basis. The result of shadow index (Figure 7) is a new image file with shadow values ranging from 1 to 239. The white pixels which have high shadow values represent the shadow objects while the black or dark grey pixels which have low shadow values represent the non-shadow objects.
Figure 7: Shadow index image.
Figure 8: Shadow index image after thresholding.
4.2 NDVI
The NDVI which is an index of plant greenness or photosynthetic activity has been used to distinguished pixels which belong to vegetation features on the digital image from those of other features by applying Equation 2 to calculate NDVI values of the digital image on a per- pixel basis. The output of this operation is a new image file (Figure 9) with NDVI values ranging from -1.0 to 0.989. The white pixels which have high NDVI values represent the vegetation features while the black or dark grey pixels which have low NDVI values represent the non-vegetation features.
Figure 9: NDVI image.
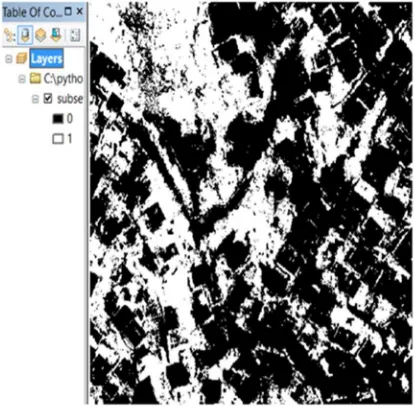
After applying an absolute threshold value to the NDVI image, a binary image (Figure 10) was created with a value of 0 indicating the non-vegetation features (i.e. black colour pixels) and value of 1 indicating the vegetation features (i.e. white colour pixels). The threshold value for NDVI image was estimated experimentally as 0.3.
Figure 10: NDVI image after thresholding.
4.3 Shadow Free Vegetation Image
The shadow free vegetation image was determined by masking out objects identified as shadows from the NDVI binary image. After the shadow objects were removed, the final output was turned into an image without shadow. Thus, a binary image (Figure 11) was created with a value of 0 indicating the non-vegetation features and value of 1 indicating the shadow free vegetation features. In this way, it became possible to get rid of the confusing spectral problem between reflected spectra of trees and that of their shadows.
Figure 11: Shadow free vegetation image.
Figure 12: 3D information about vegetation features.
5. CONCLUSIONS
This paper presented workflow about semi-automated approach for extracting urban trees from integrated airborne based LIDAR point cloud and multispectral digital image datasets. The paper proved that the integrated datasets is a suitable technology and a viable source of information for city managers to evaluate, enhance urban landscape patterns and gain a better understanding of the current spatial distributions, composition and extent of trees in an urban area. The ability of the developed algorithms shows a promising result as a fast and cost effective approach for estimating and delineated 3D information about urban tree, especially over a very large area. The extracted information will provides a snapshot of location, status and extent of trees in the study area which will be useful to city planners and other decision makers to better understand how much canopy cover exists, identify new planting, removal, or reforestation opportunities and what locations have the greatest need or potential to maximize benefits of return on investment. It can also help track trends or changes to the urban trees over time and inform future management decisions.
Finally, it is important to note that the object of interest in this study are the tree objects. However, critical analysis of the extracted LiDAR data (i.e. 3D information about vegetation features) reveals that the extracted data consist of trees and other unwanted vegetation objects such as grassland and shrubs which would have to be completely filtered out from the dataset. Therefore, future work should concentrate on developing an approach or techniques which can be used to completely filter out these undesirable LiDAR points of non-tree features from the dataset. In addition, the designed algorithms have so far only been tested over the Istanbul urban area. Further research is needed in other urban areas with different species, forest compositions and/or spatial distributions in order to examine the robustness and extensibility of these techniques.
REFERENCES
Bannari, A., Morin, D., Bonn, F. and Huete, A.R., 1995. A review of vegetation indices. Remote sensing reviews, 13(1-2), pp. 95-120.
Başar, A., Çatay, B. and Ünlüyurt, T., 2011. A multi-period double coverage approach for locating the emergency medical service stations in Istanbul. Journal of the Operational Research Society, 62(4), pp.627-637.
Blanco, L.J., Aguillera, M.O., Paruelo, J.M., and Biurrun, F.N., 2008. Grazing effect on NDVI across an aridity gradient in Argentina. Journal of Arid Environments 72(5):764-776.
Brolly, G., Király, G., & Czimber, K. 2013. Mapping forest regeneration from terrestrial laser scans. Acta Silvatica et Lignaria Hungarica, 9(1), 135-146.
Caldwell, J. 2005. Merging technologies – LIDAR complements multispectral imagery. Earth Imaging Journal.
Carter, J., Schmid, K., Waters, K., Betzhold, L., Hadley, B., Mataosky, R. and Halleran, J., 2012. LiDAR 101: An introduction to LiDAR technology, data, and applications. National Oceanic and Atmospheric Administration (NOAA) Coastal Services Center. Charleston, SC.
Chen, L., Chiang, T., & Teo, T. 2005, Fusion of LIDAR data and high-resolution images for forest canopy modelling. In Proc. 26th Asian Conf. on Remote Sensing.
Chen Q., Baldocchi D., Gong P. and Kelly M. 2006. Isolating Individual Trees in a Savanna Woodland Using Small Footprint Lidar Data, Photogrammetric Engineering & Remote Sensing, Vol. 72, No. 8, pp. 923-932.
Coops, N.C., Hilker, T., Wulder, M.A., St-Onge, B., Newnham, G., Siggins, A. and Trofymow, J.T., 2007. Estimating canopy structure of Douglas-fir forest stands from discrete-return LiDAR. Trees, 21(3), pp.295-310.
Efe, R. and Cürebal, I., 2011. Impacts of the “Marmaray” project (Bosphorus Tube crossing, tunnels, and stations) on transportation and urban environment in Istanbul. In Engineering Earth (pp. 715-733). Springer Netherlands.
Flood, M., 2002, Product definitions and guidelines for use in specifying LiDAR deliverables. Photogrammetric Engineering and Remote Sensing, 68, pp. 1230–1234.
Fuller, D.O. 1998. Trends in NDVI time series and their relation to rangeland and crop production in Senegal, 1987-1993. International Journal of Remote Sensing 19(10):2013-2018.
Gaulton, R. and Malthus, T.J., 2010. LiDAR mapping of canopy gaps in continuous cover forests: A comparison of canopy height model and point cloud based techniques. International Journal of Remote Sensing, 31(5), pp.1193-1211.
NDVI time series using Fourier Filtered Cycle Similarity. International Journal of Remote Sensing 26(24):5535-5554.
Gregory, T.E., 2010. A history of Byzantium (Vol. 19). John Wiley & Sons.
Heinzel, J.N., Weinacker, H. and Koch, B., 2008. Full automatic detection of tree species based on delineated single tree crowns–a data fusion approach for airborne laser scanning data and aerial photographs. Proceedings of SilviLaser, 2008, p.8th.
Holmgren, J., Persson, Å. and Söderman, U. 2008. Species identification of individual trees by combining high-resolution LiDAR data with multi‐spectral images. International Journal of Remote Sensing, 29(5), 1537- 1552.
Hudak, A.T., Evans, J.S. and Stuart Smith, A.M., 2009. LiDAR utility for natural resource managers. Remote Sensing, 1(4), pp.934-951.
Hyyppä, J., Hyyppä, H., Leckie, D., Gougeon, F., Yu, X. and Maltamo, M., 2008. Review of methods of small‐ footprint airborne laser scanning for extracting forest inventory data in boreal forests. International Journal of Remote Sensing, 29(5), pp.1339-1366.
Jawak, S. D., Panditrao, S. N., & Luis, A. J. 2013. Validation of High-Density Airborne LiDAR-Based Feature Extraction Using Very High-Resolution Optical Remote Sensing Data. Advances in Remote Sensing, 2013.
Lang S., Tiede D., Maier B. and Blaschke T. 2006. “3D Forest Structure Analysis from Optical and LIDAR Data,” Revista Ambiência, Guarapuava, v.2 Edição Especial, Vol. 1, No. 1, pp. 95-110.
Liang, X., Hyyppä, J. and Matikainen, L., 2007. Deciduous-coniferous tree classification using the difference between first and last pulse laser signatures. International Archives of Photogrammetry, Remote Sensing, and Spatial Information Sciences, 36(3/W52).
MacFaden, S.W., O’Neil-Dunne, J.P., Royar, A.R., Lu, J.W. and Rundle, A.G., 2012. High-resolution tree canopy mapping for New York City using LIDAR and object-based image analysis. Journal of Applied Remote Sensing, 6(1), pp.063567-1.
McPherson, E.G., 2006. Urban forestry in North America, Renewable. Resources Journal, 24:8–12.
Moleele, N., Ringrose, S., Arnberg, W., Lunden, B., and C. Vanderpost. 2001. Assessment of vegetation indexes useful for browse (forage) production in semi-arid rangelands. International Journal of Remote Sensing 22(5):741-756.
Mróz, M. and Sobieraj, A., 2004. Comparison of several vegetation indices calculated on the basis of a seasonal SPOT XS time series, and their suitability for land cover and agricultural crop identification. Tech. Sci, 7, pp.39- 66.
Mustafaa, Y. T., Habeebb, H. N., Steinc, A., & Sulaiman, F. Y. 2015. Identification and Mapping of Tree Species in Urban Areas Using WORLDVIEW-2 Imagery. ISPRS Annals of Photogrammetry, Remote Sensing and Spatial Information Sciences, 1, 175-181.
Nowak, D.J., 2007. Assessing urban forest effects and values New York City’s urban forest. DIANE Publishing.
Patenaude G., Hill R. A., Milne R., Gaveau D. L. A., Briggs B. B. J. and Dawson T. P. 2004. “Quantifying Forest above Ground Carbon Content Using LiDAR Remote Sensing,” Remote Sensing of Environment, Vol. 93, No. 3, pp. 368-380.
Persson, Å., Holmgren, J. and Söderman, U., 2006. Identification of tree species of individual trees by combining very high resolution laser data with multi- spectral images. In Proceedings of the international workshop on 3D Remote Sensing in Forestry (pp. 91-96).
Persson, Å.J.U.H., Holmgren, J., Söderman, U. and Olsson, H., 2004. Tree species classification of individual trees in Sweden by combining high-resolution laser data with high resolution near-infrared digital images. International Archives of Photogrammetry, Remote Sensing, and Spatial Information Sciences, 36(8), pp.204-207.
Rahman, M. Z. A., Majid, Z., Bakar, M. A. A., Rasib, A. W., & Kadir, W. H. W. 2015. Individual Tree Measurement in Tropical Environment using Terrestrial Laser Scanning. Jurnal Teknologi, 73(5).
Reitberger, J., Krzystek, P. and Stilla, U., 2009, March. The benefit of airborne full waveform LiDAR for 3D segmentation and classification of single trees. In ASPRS 2009 Annual Conference (pp. 1-9).
Savopol, F., & Armenakis, C. 2004. Assessment of LiDAR and Digital Camera Data in the Context of Rapid Change Detection Methodologies. ISPR S, Commission IV, WG IV/7.
Seielstad, C.A. and Queen, L.P., 2003. Using airborne laser altimetry to determine fuel models for estimating fire behavior. Journal of Forestry, 101(4), pp.10-15.
Vierling, L. a, Gould, W. a, Martinuzzi, S., & Clawges, R. M. 2008. LiDAR: shedding new light on habitat characterization and modeling. Frontiers in Ecology and the doi: 10.1890/070001. Environment, 6(2), 90–98.
Woods, M., Lim, K., & Treitz, P. 2008. Predicting forest stand variables from LiDAR data in the Great Lakes – St. Lawrence forest of Ontario. The Forestry Chronicle, 84(6), 827–839.doi:10.5558/tfc84827-6.
Yang, J., 2012. Urban forestry in challenging environments. Urban Forestry & Urban Greening, 11(2), pp. 103-104.