A REVISED GLACIER INVENTORY OF BHAGA BASIN HIMACHAL PRADESH, INDIA :
CURRENT STATUS AND RECENT GLACIER VARIATIONS
F. S. Birajdara,∗, G. Venkataramana, I. M. Bahugunab, H. P. Samantc a
Centre of Studies in Resources Engineering, Indian Institute of Technology Bombay, Mumbai 400076, India -(farjana.birajdar , GV) @ iitb.ac.in
b
Space Applications Centre, Indian Space Research Organization, Ahmedabad 380 015, India - [email protected] c
Department of Geology, St. Xavier’s College (Autonomous), Mumbai 400001, India - [email protected]
KEY WORDS:Cryosphere,Himalaya, Glacier Inventory,Glacier Changes, Satellite Remote Sensing
ABSTRACT:
Himalayan glaciers show large uncertainty regarding their present and future state due to their sensitive reaction towards change in climatic condition. Himalayan glaciers are unique as they are located in tropical, high altitude regions, predominantly valley type and many are covered with debris. The great northern plains of India sustain on the perennial melt of glaciers meeting the water requirements of agriculture, industries, domestic sector even in the months of summer when large tracts of the country go dry. Therefore, it is important to monitor and assess the state of snow and glaciers and to know the sustainability of glaciers in view of changing global scenarios of climate and water security of the nation. Any information pertaining to Himalayan glaciers is normally difficult to be obtained by conventional means due to its harsh weather and rugged terrains. Due to the ecological diversity and geographical vividness, major part of the Indian Himalaya is largely un-investigated. Considering the fact that Himalayan glaciers are situated in a harsh environment, conventional techniques of their study is challenging and difficult both in terms of logistics and finances whereas the satellite remote sensing offers a potential mode for monitoring glaciers in long term. In order to gain an updated overview of the present state of the glacier cover and its changes since the previous inventories, an attempt has been made to generate a new remote-sensing-derived glacier inventory on 1:50,000 scale for Bhaga basin (N32◦28′19.7′′- N33◦0′9.9′′; E76◦56′16.3′′- E77◦25′23.7′′) Western Himalaya covering an area of 1695.63 km2. having 231 glaciers and occupying glacierized area of 385.17±3.71 km2. ranging from 0.03 km2. to 29.28 km2. Glacier inventory has been carried out using high resolution IRS P6 LISS III data of 2011, ASTER DEM and other ancillary data. Specific measurements of mapped glacier features are the inputs for generating the glacier inventory data sheet with 37 parameters as per the UNESCO/TTS format, 11 additional parameters associated with the de-glaciated valley as per the suggestions of Space Application Center Ahmadabad and 9 newly introduced parameters of present study. The data sheet provides glacier wise details for each glacier on the significant glacier parameters like morphology, dimensions, orientation, elevation, etc. for both the active glacier component as well as the associated de-glaciated valley features. Assessment of recent variation in the glacierized area between 2001 and 2011. Results indicate that 231 glaciers covering an area of 391.56±3.76 km2. in 2001 has been reduced to 385.17±3.71 km2. in 2011; a loss of 1.63±1.0% in glacierized area within a period of 10 years. The present paper brings
out the methodology adopted and salient results of the glacier inventory carried out which will help to enrich the existing database required for water resources assessment of the country and also meet the requirements of various researches working on climate change related studies.
1. MANUSCRIPT
1.1 Introduction
Himalayas have nearly 15,000 glaciers and it is one of the largest continental area under ice. It is estimated that about 34,000 km2., about 18% of the Himalayas is always covered with ice. (Bamber et al., 2007). Systematic inventory of the Himalayan glaciers is useful for overall development of hilly regions of the Himalaya. This information is particularly required for a variety of applica-tions such as: a) planning and operation of mini and micro hydro-electric stations; b) estimation of irrigation potential, and c) dis-aster warning. (Wagenbach, 1989; Meier, 1984). But glaciolog-ical studies in high altitude terrain and under inclement weather conditions as in higher Himalayas become difficult by conven-tional means. Thus remote sensing techniques play much greater role in mapping and monitoring of permanent snowfields and glaciers. Therefore use of satellite data is finding wide acceptance in glacial inventory (Anon, 2006). The compilation of glacier inventories from automated multispectral classification of opti-cal satellite data in combination with a digital elevation model
∗Corresponding author. This is useful to know for communication with the appropriate person in cases with more than one author
knowl-edge about the glaciers in the Himalayas are obvious from re-cent debates in the media about the state and future develop-ments of glaciers in this region (Cogley et al., 2010; Schier-meier, 2010).One of the regions with missing glacier outlines is the western Himalayan part of India, which is hence selected as a key region for this study. Glaciers were selected as Essen-tial Climate Variables (ECVs) as they provide some of the clear-est evidence of climate change and constitute key variables for early-detection strategies in global climate-related observations (GCOS, 2004). Investigations of glaciers are therefore especially important in regions with sparse climatic records or those where is still under debate whether climate change is occurring or not, such as the western Himalaya (Roy and Balling, 2005; Yadav et al., 2004). Inventory data is generated for individual glaciers in a well-defined format as suggested by United Nations Temporary Technical Secretariat (UNESCO/TTS) and later modified with few additional parameters. The additional parameters contain in-formation related to de-glaciated valleys and glacier lakes (Anon, 2006). The TTS format covers a wide variety of information re-lated to the glacier like the glacier identification, nomenclature, location, dimensions, elevation, azimuth, the glacier form, activ-ity, etc. The information is very well represented in a structured table format. The sharing of data in tabular form among the users is quite convenient. However, in the absence of actual map the visualization and comparison of the representative inventory pa-rameter data is difficult. Sometimes it is impossible to compare, understand and eliminate the ambiguity in the statistical informa-tion generated while working in the same area. Obviously since early seventies when the TTS format was designed the means for preparing and sharing of data in digital map form was not so well developed. Handling of digital data and sharing in map form was rather difficult. This paper briefly dwells upon the remote sensing based glacier inventory mapping (at 1:50, 000 scale) and provides insight to the related theme layers, standards and structure of the digital data base being created in GIS environment. The design of database is in consultations with the requirements of TTS for-mat. Besides the expected cartographic outputs, the design takes care of storage of other inputs (e.g. related to dimensions like maximum length, maximum width, etc.), which are TTS format requirement. Current paper provides detailed description for the newly conceived and designed glacier inventory related layers. The nomenclature and codification scheme for the other associ-ated layers is as per National (Natural) Resources Information system (NRIS) Node Design and Standards document (Anon, 2005).
1.2 Study areas
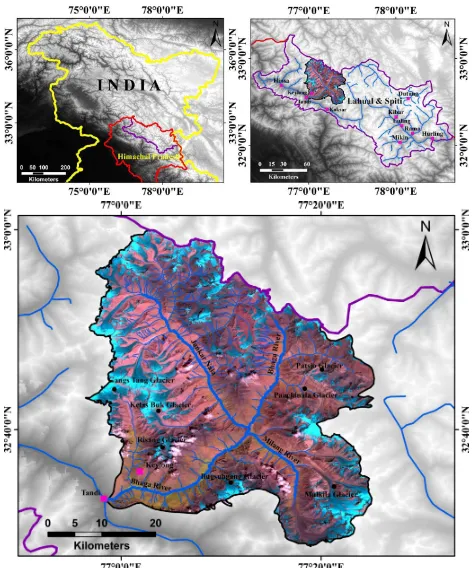
The study area comprises Bhaga basin (Figure:1) which is lo-cated between76◦56′16.253′′E and77◦25′23.73′′E longitude and32◦28′19.656′′Nto33◦0′9.887′′Nlatitude. Bhaga basin is the sub basin of Chenab basin lying under Lahaul - Spiti district of Himachal Pradesh, covering an area of 1695.63 km2. hav-ing 231 glaciers occupyhav-ing glacierized area of 385.17±3.71 km2 (Figure:2). Bhaga basin is located on the slopes of the western Himalayan range in Lahaul area. These glaciers feed the river Bhaga. The important glaciers of Bhaga valley are Lady of Key-long, Mulkila, Milang and Gangstang. Besides these glaciers, the region has two lakes Suraj Tal and Patsio Lake. U shaped valleys, waterfalls, glaciers and moraines characterize the upper catchments of the Bhaga River. The entire tract is devoid of a vegetative cover. The discharge of this river increases during the summer months, when the snow on the high mountains starts melting. The Glaciers of Bhaga basin are surrounded by high snow covered peaks from all sides.
Figure 1: Location Map Of Study Area
Figure 2: Total glaciated area of Bhaga Basin
1.3 Data Sources
extract-ing elevation information. Collateral data in the form of pub-lished maps, charts and tables are collected from various sources. Mainly the drainage maps from Irrigation Atlas of India (Anon, 1972), Watershed maps for Watershed Atlas of India (Anon, 1990), Political and Physiographic maps, Road maps/ trekking guide maps, Census information (Census, 2001) (Anon, 2001).
2. METHODOLOGY
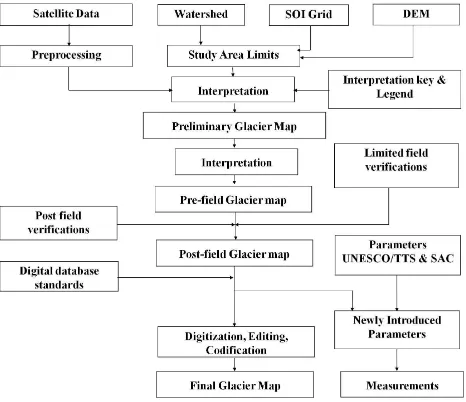
The main aim of this work is to carry out the revised glacier inventory using high resolution satellite data , generate a Sur-vey of India grid wise glacier geomorphological map and esti-mate the recent variation in the glacier features between 2001 and 2011(Figure:3). The inventory data provides glacier wise de-tails for each glacier on the significant glacier parameters like morphology, dimensions, orientation, elevation, etc. for both the active glacier component as well as the associated de-glaciated valley features. Specific measurements of mapped glacier fea-tures are the inputs for generating the glacier inventory data with 37 parameters as per the UNESCO/TTS format , 11 additional parameters associated with the de-glaciated valley as per the sug-gestions of Space application center Ahmadabad. 9 new param-eters related to glacio-geomorphic characteristics are introduced in the revised glacier inventory to estimate the possible parame-ters responsible for change in glacier features. The relationship of glacier area with glacier length, % of debris cover of the glacier and glacier width are estimated. The relationship of glacier length with glacier terminus altitude and % of debris cover of the glacier are determined. The relationship of glacier width with glacier ter-minus altitude, and % of debris cover of the glacier are estimated. Presence of preserved lateral moraine of each glacier are moni-tored. These estimated statistics are correlated with the present status of the glacier health. Glacier features such as accumula-tion area, ablaaccumula-tion area, glacial lakes, snow line/equilibrium line and glacial boundaries etc. are interpreted by visual interpreta-tion technique from False Color Composite prepared using P6 LISS III satellite data. The datasets of predominantly August-September season has been used because during this time retreat of snowline is normally maximum and glaciers are fully exposed.
Figure 3: Broad approach for glacier inventory map and data sheet preparation
2.1 Satellite data Pre-Processing
2.1.1 Geometric corrections: The satellite images were ge-ometrically corrected using georeferenced SOI topographic maps
on 1:50,00 scale. The georeferencing of satellite images is car-ried out by identifying a set of ground control points (GCPs) on the maps and images. The features such as confluence of tribu-tary glaciers, river tributaries, ridges etc. have been located and used as GCPs. The position accuracy of topographical maps at 1:50,000 scale is 12.5 m which is considered for the GCPs too. The georeferencing of the satellite images were carried out using second order polynomial transformation resulting in a root mean square error (RMSE) of less than 0.5 using ERDAS imagine 11 software. All the satellite images were georeferenced using Geo-graphic latitude/longitude projection system and Everest datum. All the satellite images were coregisterd with each other consider-ing one image as master image and other images as slave images.
2.1.2 Radiometric corrections: Radiometric correction is important to ensure that terrestrial variables retrieved from op-tical satellite sensor systems are calibrated to a common physical scale. Radiometric correction is one of several corrections per-formed on satellite image data prior to the retrieval of land, atmo-sphere, and ocean information. Radiometric consistency among ground targets in multi-temporal imagery is difficult to maintain due to changes in sensor characteristics, atmospheric condition, solar angle, and sensor view angle (Du et al., 2002; Lillesand and Kiefer, 1994). Therefore, radiometric corrections are of-ten performed on multi-temporal imagery to reduce any or all of the above influences and increase sensitivity to landscape change (e.g. Chavez, 1996; Chen et al., 2004; Coppin et al., 2004; Roder-ick et al., 1999; Song et al., 2001; Spanner et al., 1994). An abso-lute radiometric correction method is used for the present study which is generally a two step process. First step is to convert Digital Number (DN) of sensor measurement to spectral radiance measured by satellite sensors using following ( equation(1))
Lsat=DN∗Gain+Of f set (1)
WhereLsat is spectral radiance detected by a satellite sensor; DN is the digital number of the sensor measurement, and Gain and Offset are sensor-specific calibration parameters determined prior to sensor launch. While these parameters are usually as-sumed to be stable, they can change due to long-time service or accidents (Schowengerdt, 1997). The second step of absolute ra-diometric correction is to transfer the sensor detected radiance into ground surface reflectance using Equation (2) ( Lillesand and Kiefer, 1994).(equation(2))
P surf ace=(Lsat−Lpath)
Eτ (2)
Here Psurface is the ground surface reflectance of the target. Lpath is the path radiance, E is the irradiance on the ground tar-get, and is the transmission of the atmosphere (Lillesand and Kiefer, 1994). Absolute radiometric models use in situ measure-ments or reasonable estimation of atmospheric optical depth, so-lar zenith angle and satellite status to input parameters for calcu-lating the ground surface reflectance (e.g. Chavez, 1996; Song et al., 2001).
2.2 Base map generation
extracting the base information on separate vector layers, which are later updated using satellite data.
2.3 Glacier features layers
The glaciers in the Himalayas are mainly of the Mountain and valley glacier type. The available archive information on glaciers in the form of glacier maps / Atlas on the Himalayan Glacier Inventory (Anon, 1996, I.M. Bahuguna et. al. 2001, A.V. Kulka-rni et.al. 2005, KulkaKulka-rni et.al, 1991, KulkaKulka-rni et.al, 1999 ) at 1:250,000 scale is referred before the mapping is initiated to get an idea of the glacier occurrences and distribution. The glacier in-ventory map is prepared in two steps; first the preliminary glacier inventory map is prepared using the first set of satellite data and all glacier features are mapped. Based on the subsequent year data, the dynamic features like snow line, permanent snow cov-ered area, moraine extent, etc., are modified and new glacier fea-tures, if any, are appended to prepare the pre-field glacier inven-tory map. Depending on the accessibility the pre-field glacier inventory map is then verified in the field and final glacier in-ventory map is prepared by including the modifications. Tem-poral LISS III satellite data of 2001 and 2011 are used for de-lineation of the glacier features. ArcGIS 10.1 software is used to delineate various glacier features like extent of the perennial snow covered areas, glacieret/snow fields, glacier accumulation and ablation area, cirques, horn, deglaciated valley, supra-glacial lakes, moraine dam / glacial lake, moraine, medial moraine, lat-eral moraine and terminal moraine etc as a polygon features. Glac-ier snout i.e terminus of the glacGlac-ier and the coordinates of the glacier features such as Supra-glacial lake, De-glaciated valley, Moraine dam lake, Snowline are marked as point layer. Some of the glacier features like transient snow line, ice divide and central line of glacier are delineated as the lines.
2.4 Field verification
The final glacier inventory map layer is prepared only after lim-ited field verification exercise. In order to validate the present sta-tus of the glaciers and to observed the geomorphological parame-ters the Patsio glacier (32◦46′6.5′′NLatitude and77◦20′28.8′′E Longitude) of Lahual and Spiti district of Himachal Pradesh has been selected. Monitoring of the terminus position of the glacier has been done for verification of the changes occurring at the frontal area of the glacier. Geomorphological parameters like preserved lateral moraine, recessional moraine and glacier lake to assess the impact on the glacier changes. Based on the field expedition to the Patsio glaciers, the glacier inventory map is ver-ified and corrected.
3. RESULTS AND DISCUSSIONS
3.1 Generation Of Glacier Inventory Map
Inventory data is generated for individual glaciers in a well-defined format as suggested by UNESCO/TTS and Space application cen-ter Ahmadabad. It is divided into three parts. First part [A] com-prises all 49 parameters recommended by UNESCO/TTS. Sec-ond part [B] includes additional information (not recommended in TTS) on 15 parameters related to remote sensing and deglaciat-ed valleys and glacier lakes which are suggestdeglaciat-ed by Space appli-cation center Ahmadabad. Third Part [C] deals with the relation-ship of the glacio- geomorphic characteristics with each other for monitoring the health of the glacier. By using the glacier inven-tory map layers in GIS environment, systematic observations and measurements are made on the glacial feature and estimated the recent variations in the glacier features between 2001 and 2011
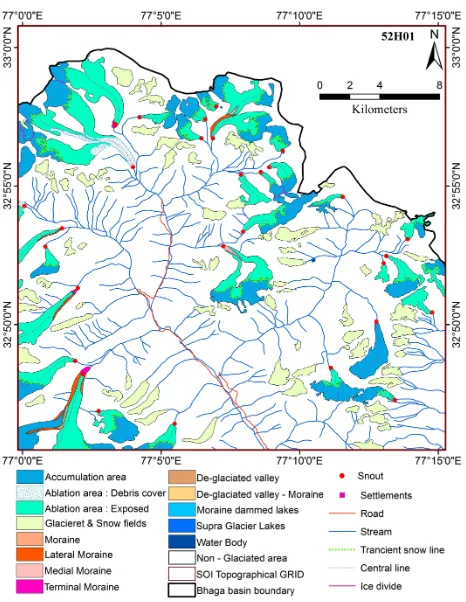
Figure 4: Glacier Inventory Map of Bhaga Basin
Figure 5: Survey of India grid wise glacier Inventory map of Bhaga Basin
3.2 Changes in the surface area of glacier features
mapping and representation of the significant glacier morpholog-ical features of glaciers on Survey of India topographmorpholog-ical grid of 1:50,000 scale. The mapped glacier features include the glacier boundary with separate accumulation and ablation area. The ab-lation area is further divided into abab-lation area ice exposed and ablation area debris covered. The Moraines like median, lateral and terminal moraines present on the glacier are separately iden-tified and delineated. The supra-glacier lakes occurring on the glaciers and the moraine dam lakes are also delineated. The ter-minus of the glaciers are marked as a point location depicting the end of the glacier tongue. The de-glaciated valley associated with the glacier is also delineated (Figure:4-5).
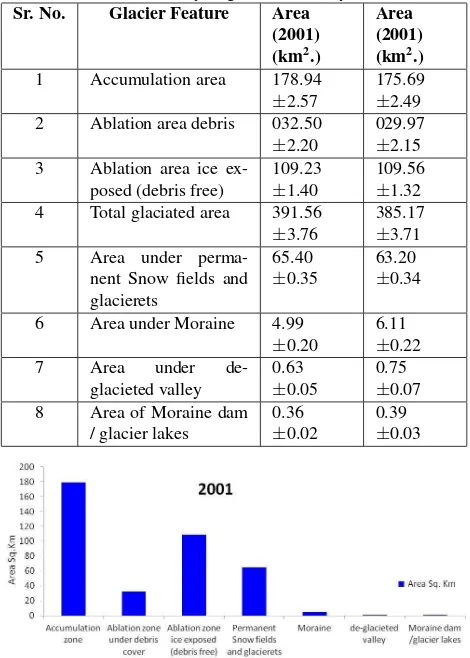
Table 1: Summary of glacier inventory result Sr. No. Glacier Feature Area
(2001) (km2.)
Area (2001) (km2.) 1 Accumulation area 178.94
±2.57
175.69
±2.49 2 Ablation area debris 032.50
±2.20
029.97
±2.15
3 Ablation area ice ex-posed (debris free)
109.23
±1.40
109.56
±1.32
4 Total glaciated area 391.56
±3.76
385.17
±3.71 5 Area under
perma-nent Snow fields and glacierets
65.40
±0.35
63.20
±0.34
6 Area under Moraine 4.99
±0.20
6.11
±0.22
7 Area under
de-glacieted valley
0.63
±0.05
0.75
±0.07
8 Area of Moraine dam / glacier lakes
0.36
±0.02
0.39
±0.03
Figure 6: Statistical distributions of glacier features (2001)
Figure 7: Statistical distributions of glacier features (2011)
Broad statistical analysis of data for the Bhaga basin is carried out to understand the distribution of the glaciated area in the basin. The glacier inventory datasheet with 73 parameters is prepared for each glacier. Bhaga basin include 231 glaciers lying at an
Figure 8: Percent glaciated area under major morphological classes(2001)
Figure 9: Percent glaciated area under major morphological classes(2011)
elevation ranging from 3800 m asl to 6200 m asl, which are oc-cupying 391.56 ±3.76 sq. km. of glaciated area during 2001
which has been reduced to 385.17±3.71 sq. km. in 2011,
show-ing a loss of 1.63±1.0% in glaciated area within a period of 10
years. Surface area of the glacier features for 2001 and 2011 is estimated and the changes in the surface area for all the glacier features are calculated. During 2001-2011 the total accumulation area is reduced by 1.82±0.44% while, slight increase of 0.30 ±0.02% has been observed in the debris free ablation area. The
thick debris cover plays an important role by stopping the heat from sun rays in reducing the melting of glacier ice. Ablation area under debris cover is estimated and observed that the glaciers are having varying amounts of debris cover. During 2001- 2011 the ablation area under debris cover has been reduced by 7.78
±6.69 percentage. Furthermore the loss in ablation area under
debris cover is observed at the frontal area of the glaciers due to the recession of the terminus of the glaciers. Loss of 3.36
±0.53% has been observed in area under permanent Snow fields
and glacierets. Increase of 22.44±4.21% has been estimated in
the area of moraines. The de-glaciated valley is one of the in-dicators of retreat of valley glaciers by vacating the valleys in lower reaches beyond the snout region. There are 4 number of de-glaciated valleys in the Bhaga basin and occupy a total of 0.63
±0.05 sq. km. area during 2001 which has been increased to 0.75 ±0.07 km2.during 2011 showing an increase of 19.05±9.52% in
surface area. A slight expansion of moraine dammed/ glaciel lake has been observed. The area under moraine dammed/ glacial lake was 0.36±0.02 sq. km. during 2001 which has been increased
4. CONCLUSIONS
This study describes the creation of a consistent multi-temporal digital glacier inventory of the Bhaga basin Himachal Pradesh, based on the structure of the previous inventory as per UNESCO/-TTS format and modifications suggested by Space Application Centre, Ahmadabad . The revised glacier inventory is derived using remotely sensed satellite data which can be progressively updated through time to maintain consistency between the glacier outlines. Moreover, the newest inventory also includes the impact of the glacio-geomorphic parameters on the glacier changes. A systematically designed and structured (standard) database pro-viding a level of flexibility in storage, utilization and sharing of spatial and aspatial data for the purpose of glacier inventory has been devised. The present glacier inventory data can provide an insight to the behavior as well as the overall health of glaciers of the basin. This inventory can be a baseline dataset for various future studies, including change assessment, modeling of future glacier development and glacio-geomorphic change assessments.
5. REFERENCES
Andreassen, L., Paul, F., K¨a¨ab, A., and Hausberg, J. (2008). Landsat-derived glacier inventory for Jotunheimen, Norway, and deduced glacier changes since the 1930s. The Cryosphere, 2(2), 131145.
Bamber, J.L. and A. Rivera (2007): ”A review of remote sens-ing methods for glacier mass balance determination”. Global and Planetary Change, 59, 138-148.
Bhambri, R., and Bolch, T. (2009). Glaciermapping: a reviewwith special reference to the Indian Himalayas. Progress in Physical Geography, 33(5), 672704,
Bolch, T., Menounos, B., and Wheate, R. (2010). Landsat-based inventory of glaciers in western Canada, 19852005. Remote Sens-ing of Environment, 114, 127137.
Bolch, T., Kulkarni, A., K¨a¨ab, A., Huggel, C., Paul, F., and Cog-ley, J. G. (2012). The State and Fate of Himalayan Glaciers. Sci-ence, 336(6079), 310314
Chavez, P. S. (1996). Image-based atmospheric correctionsRe-visited and improved. Photogrammetric Engineering and Remote Sensing ,62,10251036.
Chen, X., Vierling, L., Rowell, E., and DeFelice, T. (2004). Using lidar and effective LAI data to evaluate IKONOS and Landsat 7 ETM+ vegetation cover estimates in a ponderosa pine forest. Remote Sensing of Environment,91, 1426.
Cogley, J. G. (2009). A more complete version of the World Glacier Inventory. Annals of Glaciology, 50(53), 3238.
Cogley, J. G., Kargel, J. S., Kaser, G., and vander Ween, C. J. (2010). Tracking the source of glacier misinformation. Science, 327(5965), 522.
Coppin, P., Jonckheere, I., Nackaerts, K., Muys, B., and Lambin, E. (2004). Digital change detection methods in ecosystem mon-itoring: A review. International Journal of Remote Sensing,10, 15651596.
D.K. Hall, A.T.C. Chang and H. Siddalingaiah, Reflectance of glaciers as calculated using Landsat-5 Thematic mapper data. Re-mote Sensing of Environment, 25, pp. 311-321, 1988.
Du, Y., Teillet, P. M., and Cihlar, J. (2002). Radiometric nor-malization of multitemporal high-resolution satellite images with quality control for land cover change detection. Remote Sensing of Environment ,82,123134.
Hock, R., De Woul, M., Radi, V., and Dyurgerov, M. (2009). Mountain glaciers and ice caps around Antarctica make a large sealevel rise contribution. Geophysical Research Letters, 36(7), L07501.
Huss, M. (2011). Present and future contribution of glacier stor-age change to runoff from macro scale drainstor-age basins in Europe. Water Resources Research, 47(7), W07511
J. Dozier, Snow reflectance from Landsat-4 Thematic Mapper. IEEE Transactions on Geoscience and Remote Sensing, GE-22(3), pp. 323-328, 1984.
Kaser, G., Cogley, J., Dyurgerov, M., Meier, M., and Ohmura, A. (2006). Mass balance of glaciers and ice caps: Consensus estimates for 19612004. Geophysical Research Letters, 33(19), L19501.
Kulkarni A.V., Philip G., Thakur V.C., Sood R.K., Randhawa S.S., and Ram Chandra, (1999) Glacier inventory of Satluj basin using remote sensing technique, Himalayan Geology, 20(2), pp 45-52.
Koboltschnig, G. R., Schner, W., Zappa, M., Kroisleitner, C., and Holzmann, H. (2008). Runoff modelling of the glacierized Alpine Upper Salzach basin (Austria): multi-criteria result vali-dation. Hydrological Processes, 22, 39503964.
Meier M F (1984). Contribution of small glaciers to global sea level, Science, 226, 1418-1421.
Ohmura, A. (2009). Completing the world glacier inventory. An-nals of Glaciology, 50(53), 144148.
Paul, F., Huggel, C., and K¨a¨ab, A. (2004). Combining satellite multispectral image data and a digital elevation model for map-ping of debris-covered glaciers. Remote Sensing of Environment, 89(4), 510518.
Paul, F., and K¨a¨ab, A. (2005). Perspectives on the production of a glacier inventory from multispectral satellite data in Arc-tic Canada: Cumberland Peninsula, Baffin Island. Annals of Glaciology, 42, 5966.
Paul, F., Barry, R. G., Cogley, J. G., Frey, H., Haeberli, W., Ohmura, A., et al. (2009). Recommendations for the compi-lation of glacier inventory data from digital sources. Annals of Glaciology, 50(53), 119126.
Racoviteanu, A. E., Williams, M. W., and Barry, R. G. (2008). Optical remote sensing of glacier characteristics: A review with focus on the Himalaya. Sensors, 8, 33553383.
Racoviteanu, A., Frank, P., Bruce, R., Khalsa, S., and Armstrong, R. (2009). Challenges and recommendations in mapping of glacier parameters from space: Results of the 2008 Global Land Ice Measurements from Space (GLIMS) workshop, Boulder, Col-orado, USA. Annals of Glaciology, 50(53), 5369.
Raper, S. C. B., R. Braithwaite, J., (2006): Low sea level rise pro-jections from mountain glaciers and icecaps under global warm-ing, Nature, 439, 311-313.
Raup, B., K¨a¨ab, A., Kargel, J. S., Bishop, M. P., Hamilton, G., Lee, E., et al. (2007). Remote sensing and GIS technology in the Global Land Ice Measurements from Space (GLIMS) Project. Computers and Geosciences, 33, 104125.
Roderick, M. L., Noble, I. R., and Cridland, S. W. (1999). Es-timating woody and herbaceous vegetation cover from time se-ries satellite observations. Global Ecology and Biogeography,8, 501508.
Roy, S. S., and Balling, R. C. (2005). Analysis of trends in max-imum and minmax-imum temperature, diurnal temperature range, and cloud cover over India. Geophysical Research Letters, 32(12), L12702.
Schiermeier, Q. (2010). Glacier estimate is on thin ice. Nature, 463(7279), 276277.
Song, C., Woodcock, C. E., Seto, K. C., Lenney, M. P., and Ma-comber, S. A. (2001). Classification and change detection using Landsat TM data: When and how to correct atmospheric effects? Remote Sensing of Environment,75, 230244.
Spanner, M. A., Pierce, L. L., Peterson, D. L., and Running, S. W. (1990). Remote sensing of temperate coniferous forest leaf area index The influence of canopy closure, understory vegeta-tion and background reflectance. Internavegeta-tional Journal of Remote Sensing,11,95111.
Yadav, R. R., Park, W. -K., Singh, J., and Bhasha, D. (2004). Do the western Himalayas defy global warming? Geophysical Research Letters, 31(17).
Lillesand, T. M., and Kiefer, R. W. (1994). Remote sensing and image interpretation . John Wiley and Sons.
Schowengerdt, R. A. (1997). Remote sensing models and meth-ods for image processing. 2nd edition. San Diego, CAAcademic Press Ltd.
Schowengerdt, R. A. (2007). Remote SensingModels and Meth-ods for Image Processing (Third edition). Amsterdam: Academic Press 515 pp.
Wagenbach D (1989). Environmental record in alpine glaciers, in the Environmental record in Glaciers and Ice (eds H. Oeschger and O.C. Langway,Jr.), John Wiley and Sons Limited, pp 69-83.
Anon., (2006) www.glims. Global Land Ice Measurements from Space, Using the Worlds glacier to Monitor Climate Change.
Anon., (2005) Snow and glacial studies, Project Execution Doc-ument, SAC, Ahmedabad.
Anon., (2005) NNRMS Standards, DOS ISRO, Bangalore.
Anon., (2001) Primary Census Abstracts, Census of India.
Anon., (2000) National (Natural) Resources Information System (NRIS) - Node design and standards ISRO-NNRMS-SP-2000, Bangalore.
Anon., (1996) Glacier Atlas of Satluj, Beas and Spiti region at 1: 50k scale using IRS 1A/1B (1992-93) data - By SAC, Ahmed-abad, Wadia Institute of Himalayan Geology, Dehradun and HP Remote Sensing Cell, Shimla.
Anon., (1990) Watershed Atlas of India, All India Soil and Land use Survey, Department of Agriculture and Cooperation, New Delhi.
Anon., (1972) Irrigation Atlas of India, Ministry of Education and Youth affairs, GOI, New Delhi.
Bahuguna I.M., .Kulkarni A.V, Arrawatia M.L., and Shresta D.G., Glacier Atlas of Tista basin (Sikkim Himalayas), SAC/RESA/MWRG-GLI/SN/16/2001.
GCOS. 2004. Implementation plan for the Global Observing Sys-tem for Climate in support of the UNFCCC. Report GCOS 92 (WMO/TD No. 1219). 136p.
Kaser, G., Grosshauser, M., and Marzeion, B. (2010). Contribu-tion potential of glaciers to water availability in different climate regimes. Proceedings of the National Academy of Sciences, 107, 2022320227.
Kulkarni A.V., and Buch A.M., (1991), Glacier Atlas of Indian Himalaya, SAC/RSAG-MWRD/SN/05/91, 62 p.
Kulkarni A.V., Rathore B.P., Randhawa S.S., Sood R.K. and Kaul Manoj, (2005) Glacier Atlas of Chenab basin.
Muller F., Instructions for compilation and assemblage of data for world inventory supplement. UNESCO, Technical papers, 1978.
Muller F., Inventory of glaciers in the Mount Everest region, in perennial ice and snow masses a guide for compilation and as-semblage of data for world inventory, UNESCO, Technical pa-pers, 1970.