Full Terms & Conditions of access and use can be found at
http://www.tandfonline.com/action/journalInformation?journalCode=vjeb20
Download by: [Universitas Maritim Raja Ali Haji] Date: 11 January 2016, At: 22:35
Journal of Education for Business
ISSN: 0883-2323 (Print) 1940-3356 (Online) Journal homepage: http://www.tandfonline.com/loi/vjeb20
The Effects of AACSB Accreditation on Faculty
Salaries and Productivity
David W. Hedrick , Steven E. Henson , John M. Krieg & Charles S. Wassell Jr.
To cite this article: David W. Hedrick , Steven E. Henson , John M. Krieg & Charles S. Wassell Jr. (2010) The Effects of AACSB Accreditation on Faculty Salaries and Productivity, Journal of Education for Business, 85:5, 284-291, DOI: 10.1080/08832320903449543
To link to this article: http://dx.doi.org/10.1080/08832320903449543
Published online: 08 Jul 2010.
Submit your article to this journal
Article views: 78
View related articles
CopyrightC Taylor & Francis Group, LLC ISSN: 0883-2323
DOI: 10.1080/08832320903449543
The Effects of AACSB Accreditation on Faculty
Salaries and Productivity
David W. Hedrick
Central Washington University, Ellensburg, Washington, USA
Steven E. Henson and John M. Krieg
Western Washington University, Bellingham, Washington, USA
Charles S. Wassell, Jr.
Central Washington University, Ellensburg, Washington, USA
The authors explored differences between salaries and productivity of business faculty in As-sociation to Advance Collegiate Schools of Business (AACSB)-accredited business programs and those without AACSB accreditation. Empirical evidence is scarce regarding these differ-ences, yet understanding the impact of AACSB accreditation on salaries and productivity is important when university administrators assess the costs and benefits of AACSB accredi-tation. The authors found that faculty in accredited business schools are paid more, publish more, and teach less than their peers at nonaccredited schools. These differences exist between faculty who are otherwise similar, and are not simply due to nonrandom selection of faculty into accredited and nonaccredited institutions.
Keywords: AACSB, accreditation, salary
Accreditation is a mark of distinction for academic programs. Collegiate business schools may strive over the tenure of multiple administrators to obtain or retain accreditation by the Association to Advance Collegiate Schools of Business (AACSB). The stated goal of accreditation is to improve business program quality, yet skeptics contend that the aim is to increase business faculty salaries, perhaps at the expense of other academic programs. In choosing to dedicate consid-erable resources to this pursuit, school administrators may act with incomplete knowledge of how accreditation impacts various dimensions of a business program, particularly in regard to input costs and faculty productivity.
Tensions may exist between business school deans and other senior administrators who, although supportive of ac-creditation, are concerned about its costs. Therefore, the ex-pense of pursuing accreditation justifies a detailed investi-gation of how accreditation impacts the explicit and implicit costs, as well as the quality, of a business education. However,
Correspondence should be addressed to David W. Hedrick, Central Washington University, Department of Economics, 400 E. University Way, Ellensburg, WA 98926, USA. E-mail: dhedrick@cwu.edu
analysis of these costs is sparse. Although descriptive statis-tics, such as those provided by AACSB annual salary surveys, indicate upward movement in salaries paid to accredited busi-ness faculty, empirical research linking AACSB accreditation to faculty salaries and productivity is practically nonexistent. To our knowledge, only one study has attempted to determine if salaries are different between AACSB-accredited and non-AACSB-accredited programs. Using sign tests, Levernier and Miles (1992) found that faculty at AACSB-accredited institutions earn higher salaries. These results, however, are qualitative and do not estimate a salary premium for faculty in accredited business programs. Using data from a survey mailed to business school deans, Yunker (1998) reported that faculty at accredited institutions teach on average about 8–9 hr per week and publish slightly over three refereed articles and over a 5-year period, whereas faculty at nonaccredited schools teach just over 11 hr per week and publish about two articles over 5 years. These results suggest that accredited in-stitutions are more research- and less teaching-oriented than nonaccredited schools; however, due to the small sample size and lack of reported standard errors, the statistical validity of these findings cannot be determined.
THE EFFECTS OF AACSB ACCREDITATION 285
Other analyses of the impacts of accreditation have fo-cused primarily on how deans weigh research productivity, teaching performance, and service in their evaluations of faculty, rather than measuring the effects of accreditation on these metrics. Early research by Lein and Merz (1977) and Tong and Bures (1987) demonstrated that deans at AACSB accredited institutions placed research productivity ahead of teaching and service in assessing faculty performance. In 1991, AACSB adopted “mission-driven” standards, under which institutions may designate the relative importance of research, teaching and service to their missions and develop standards for faculty evaluation that reflect these relative pri-orities.1Ehie and Karathanos (1994) suggest that under these new standards, deans appear to place the same emphasis on research as before, but evaluations of teaching have become more important relative to service. None of these studies attempted to estimate the direct effects of accreditation on these performance measures themselves.
In this article, we provide the first quantitative exami-nation of the impacts of AACSB accreditation on faculty salaries, teaching loads, and research productivity that makes use of data drawn from a nationally representative survey of individual faculty. We began by adopting a standard re-gression methodology (Mincer, 1974) that explored the dif-ferences in salary, teaching load, and research productiv-ity between AACSB-accredited and non-AACSB-accredited business programs. We found that faculty at accredited in-stitutions earn more, teach less, and produce more research. However, the regression approach ignores the possibility that faculty select into accredited and nonaccredited schools non-randomly. We controlled for this potential selection bias us-ing a nonparametric matchus-ing model, subsequently described in detail. Our results show that these differences in salary, teaching loads, and research exist even between faculty who are observationally similar, and do not arise from differ-ences between accredited and nonaccredited institutions in the types of individuals employed. That is, these differences can be attributed to accreditation itself, and are not due to accredited institutions hiring individuals with different char-acteristics. We conclude by discussing the impact of these findings on the value of accreditation.
METHOD
Data
We drew data from the National Study of Post-Secondary Faculty (NSOPF) conducted by the U.S. Department of Ed-ucation’s National Center for Education Statistics (NCES). The NSOPF provides a national snapshot of higher educa-tion faculty and has been administered in 1988, 1993, 1998, and 2004. Each survey cycle has used a two-stage stratified random sampling process. The first stage draws a sample of institutions to be surveyed and in the second stage faculty
members are sampled from the selected institutions.2Faculty
members responded to a questionnaire that inquires about their professional experience and background, responsibili-ties and workload, compensation, demographic characteris-tics, and opinions. In a separate institutional questionnaire, a representative of the school’s administration was asked about institutional characteristics, policies, faculty benefits, total number of full-time and part-time faculty, and the presence or absence of collective bargaining. Over all four cycles, a total of 78,310 faculty and 1,900 institutional questionnaires were returned.3We matched the NSOPF data with a list of AACSB-accredited schools obtained from AACSB Interna-tional. As of April 2008, there were 459 institutions in the United States that were AACSB-accredited.
From the original 78,310 NSOPF observations, we deleted faculty members not teaching in a business program (72,830), part-time faculty (1,850), observations for which NCES cal-culates imputed values for some of the variables used in this analysis (2,290), and faculty members in institutions not designated by the Carnegie Foundation as doctoral, com-prehensive, or liberal arts (40).4The final sample contained
1,300 faculty observations from 540 institutions. Of these, 880 faculty members were at 320 institutions that were AACSB-accredited, and 420 faculty were at 220 nonaccred-ited schools.5
Measures
We first performed a series of t tests to compare average salaries, teaching loads, and research output stratified by the type of institution: doctoral, comprehensive, or liberal arts. We found support for Levernier and Miles’s (1992) sign tests that AACSB accreditation appears associated with statistical differences in these measures. We then estimated regression models to assess the impact of AACSB accreditation on fac-ulty salaries, research productivity, and instructional load. Finally, in order to deal with potential selection bias we (semi-) nonparametrically controlled for faculty characteris-tics through propensity score (pscore) matching.
RESULTS
Comparison of Means
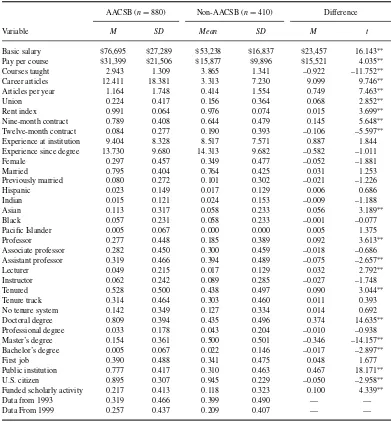
The means of the variables used in our analysis are compared in Table 1, conditioned on AACSB-accreditation status. A simple comparison of means by accreditation status provides support for past research and often-cited anecdotal evidence that faculty in accredited institutions receive higher pay, pro-duce more refereed articles, and teach less. Compared to faculty at nonaccredited schools, AACSB-accredited faculty appear to earn approximately 50% more as measured by ba-sic salary and about twice as much when measured by pay per course taught.6Accredited faculty teach one less course
TABLE 1
Sample Means and Standard Deviations by AACSB Accreditation Status
AACSB (n=880) Non-AACSB (n=410) Difference
Variable M SD Mean SD M t
Basic salary $76,695 $27,289 $53,238 $16,837 $23,457 16.143∗∗ Pay per course $31,399 $21,506 $15,877 $9,896 $15,521 4.035∗∗ Courses taught 2.943 1.309 3.865 1.341 –0.922 –11.752∗∗ Career articles 12.411 18.381 3.313 7.230 9.099 9.746∗∗ Articles per year 1.164 1.748 0.414 1.554 0.749 7.463∗∗ Union 0.224 0.417 0.156 0.364 0.068 2.852∗∗ Rent index 0.991 0.064 0.976 0.074 0.015 3.699∗∗ Nine-month contract 0.789 0.408 0.644 0.479 0.145 5.648∗∗ Twelve-month contract 0.084 0.277 0.190 0.393 –0.106 –5.597∗∗ Experience at institution 9.404 8.328 8.517 7.571 0.887 1.844 Experience since degree 13.730 9.680 14.313 9.682 –0.582 –1.011 Female 0.297 0.457 0.349 0.477 –0.052 –1.881 Married 0.795 0.404 0.764 0.425 0.031 1.253 Previously married 0.080 0.272 0.101 0.302 –0.021 –1.226 Hispanic 0.023 0.149 0.017 0.129 0.006 0.686 Indian 0.015 0.121 0.024 0.153 –0.009 –1.188 Asian 0.113 0.317 0.058 0.233 0.056 3.189∗∗ Black 0.057 0.231 0.058 0.233 –0.001 –0.077 Pacific Islander 0.005 0.067 0.000 0.000 0.005 1.375 Professor 0.277 0.448 0.185 0.389 0.092 3.613∗∗ Associate professor 0.282 0.450 0.300 0.459 –0.018 –0.686 Assistant professor 0.319 0.466 0.394 0.489 –0.075 –2.657∗∗ Lecturer 0.049 0.215 0.017 0.129 0.032 2.792∗∗ Instructor 0.062 0.242 0.089 0.285 –0.027 –1.748 Tenured 0.528 0.500 0.438 0.497 0.090 3.044∗∗ Tenure track 0.314 0.464 0.303 0.460 0.011 0.393 No tenure system 0.142 0.349 0.127 0.334 0.014 0.692 Doctoral degree 0.809 0.394 0.435 0.496 0.374 14.635∗∗ Professional degree 0.033 0.178 0.043 0.204 –0.010 –0.938 Master’s degree 0.154 0.361 0.500 0.501 –0.346 –14.157∗∗ Bachelor’s degree 0.005 0.067 0.022 0.146 –0.017 –2.897∗∗ First job 0.390 0.488 0.341 0.475 0.048 1.677 Public institution 0.777 0.417 0.310 0.463 0.467 18.171∗∗ U.S. citizen 0.895 0.307 0.945 0.229 –0.050 –2.958∗∗ Funded scholarly activity 0.217 0.413 0.118 0.323 0.100 4.339∗∗
Data from 1993 0.319 0.466 0.399 0.490 — —
Data From 1999 0.257 0.437 0.209 0.407 — —
Note. Sample sizes were rounded to the nearest 10 to comply with National Center for Education Statistics disclosure requirements. AACSB=Association to Advance Collegiate Schools of Business.
∗
p<.05.
∗ ∗
p<.01.
per semester or quarter and have published nine more arti-cles during their careers, or about three quarters of an article more per year of postterminal degree experience. This is consistent with the summary statistics presented by Yunker (1998).
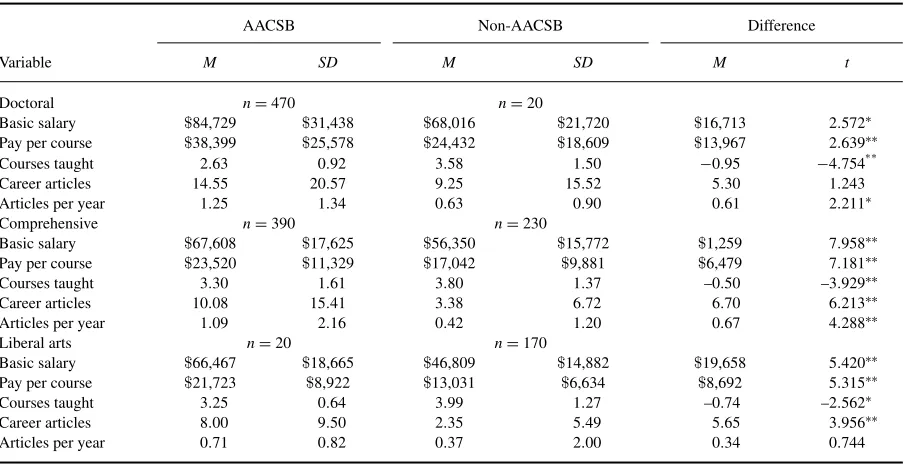
Table 2 compares the means of salaries, teaching loads, and research productivity stratified by accreditation sta-tus and broad Carnegie classification. Among doctoral in-stitutions, business faculty in accredited schools averaged
$84,729 in basic salary (in 2004 constant dollars) over the
sample period, whereas their counterparts in nonaccredited institutions averaged$68,016. The difference in their
earn-ings of$16,713 (21% of the full-sample mean) was
signif-icant at the 99% confidence level. Average salaries are also significantly higher in accredited programs in both compre-hensive and liberal arts institutions; the difference is 25% for the combined category. In all types of institutions the pay per course was greater in accredited programs, with the difference ranging from$6,479 (38%) per course in
compre-hensive institutions to$13,967 (57%) per course in doctoral
institutions.
Teaching loads, measured as the number of courses as-signed in fall semester or quarter of each survey year, were also lower for business faculty in accredited schools. Faculty
THE EFFECTS OF AACSB ACCREDITATION 287
TABLE 2
Sample Means and Standard Deviations by AACSB Accreditation Status and Carnegie Classification
AACSB Non-AACSB Difference
Variable M SD M SD M t
Doctoral n=470 n=20
Basic salary $84,729 $31,438 $68,016 $21,720 $16,713 2.572∗ Pay per course $38,399 $25,578 $24,432 $18,609 $13,967 2.639∗∗ Courses taught 2.63 0.92 3.58 1.50 −0.95 −4.754∗ ∗ Career articles 14.55 20.57 9.25 15.52 5.30 1.243 Articles per year 1.25 1.34 0.63 0.90 0.61 2.211∗
Comprehensive n=390 n=230
Basic salary $67,608 $17,625 $56,350 $15,772 $1,259 7.958∗∗ Pay per course $23,520 $11,329 $17,042 $9,881 $6,479 7.181∗∗ Courses taught 3.30 1.61 3.80 1.37 –0.50 –3.929∗∗ Career articles 10.08 15.41 3.38 6.72 6.70 6.213∗∗ Articles per year 1.09 2.16 0.42 1.20 0.67 4.288∗∗
Liberal arts n=20 n=170
Basic salary $66,467 $18,665 $46,809 $14,882 $19,658 5.420∗∗ Pay per course $21,723 $8,922 $13,031 $6,634 $8,692 5.315∗∗
Courses taught 3.25 0.64 3.99 1.27 –0.74 –2.562∗
Career articles 8.00 9.50 2.35 5.49 5.65 3.956∗∗
Articles per year 0.71 0.82 0.37 2.00 0.34 0.744
Note. Sample sizes were rounded to the nearest 10 to comply with National Center for Education Statistics disclosure requirements. AACSB =Association to Advance Collegiate Schools of Business.
∗p<.05. ∗∗p<.01.
were assigned, on average, 0.95 fewer courses in doctoral in-stitutions, 0.50 fewer courses in comprehensive inin-stitutions, and 0.74 fewer courses in liberal arts institutions than their peers in nonaccredited programs.
Accreditation also appeared to be associated with higher research output, measured by refereed articles. Faculty in accredited comprehensive and liberal arts institutions aver-aged approximately three times as many refereed articles as those in nonaccredited institutions. No significant dif-ferences were found in career research output for doctoral institutions, but faculty in AACSB-accredited doctoral in-stitutions do produce significantly more articles per year than their non-AACSB-accredited colleagues. This differ-ence in annual productivity also holds for faculty in com-prehensive institutions, but not for those in liberal arts institutions.
Such simple comparisons of means, although suggestive, did not adequately control for other differences between in-stitutions and faculty members that may explain differences in pay, teaching assignments, and research productivity. For example, according to Table 1, faculty at nonaccredited insti-tutions tended to have less experience at that institution but more in the profession, were less likely to be tenured, were less likely to hold the rank of full professor, were less likely to receive external funding, and were more likely to be at a private university. We subsequently turn to a more systematic exploration of these differences that controls for these and other factors.
Regression Model Incorporating Multiple Influences
Faculty salaries, teaching loads, and research productivity were likely to be affected by a wide range of influences, particularly individual faculty characteristics and the nature of their respective institutions. To control for these factors and to quantify the impacts of AACSB accreditation, we estimated a regression model of the following basic form:
Yijt=β·AACSBjt+δXijt+γZjt+εijt (1)
The dependent variableY constitutes different measures of pay, teaching load, and research productivity, for theith faculty member at institutionj during timet. The variable
AACSBis an indicator variable for the presence of AACSB accreditation,Xis a matrix of individual-specific characteris-tics, andZis a matrix of institutional and regional variables. The error term in this equation,εijt,is a random variable
as-sociated with a particular faculty memberiat institutionjat timet. The coefficient of interest in Equation 1 isβ, which measures the change in the dependent variable when faculty are members of an accredited business school. For regres-sions in which a measure of pay is the dependent variable, we used a log-level specification, and (exp[β]–1) measures the percentage change in pay associated with a change in accreditation status.
The NSOPF has a rich set of faculty and institutional variables. In our analysis we incorporate all variables listed
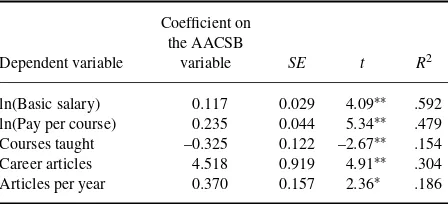
TABLE 3
Impacts of AACSB Accreditation: Regression Results
Note. All regressions include all of the explanatory variables listed in Table 1. Full results are available on request. Total observations=810. AACSB=Association to Advance Collegiate Schools of Business.
∗p<.05. ∗∗p<.01.
in Table 1, including measures of a faculty member’s ex-perience (both at the institution and over their career), ter-minal degree, tenure status, funding for scholarly activity, rank, marital status, gender, ethnicity, and citizenship. At the institutional level, we added measures of public or pri-vate control and the presence of a faculty union, and we used a gross rent index to proxy the cost of living at the county level. Given the lower teaching loads and the rela-tively greater emphasis on research productivity in the reward structure at doctoral schools, for these regressions we lim-ited our sample to the 4-year comprehensive and liberal arts institutions.7
Table 3 presents the estimated impacts of AACSB ac-creditation from the regression model for log of real basic salary (2004 dollars), the log of real basic salary per course taught during fall quarter, the number of courses taught in fall quarter, the total number of refereed articles the faculty member has published during his or her career, and the av-erage number of articles a faculty member has published per year since receiving the terminal degree.8,9The regression results are qualitatively similar to those from the compar-isons of means: faculty in accredited schools, controlling for other influences, received higher pay, taught fewer courses, and published more articles than their counterparts in nonac-credited business schools. However, in contrast to a simple comparison of means, the regression estimate of the salary gap between accredited and nonaccredited faculty was only about half as large—approximately 11.7% across all faculty in comprehensive and liberal arts institutions—but still sta-tistically significant. The estimated accreditation premium measured on a per-course basis was 23.5%, again a large decrease from the differences in means but still a substan-tial amount. In the fall quarter or semester (for which we had data) faculty taught about 0.33 fewer courses. Faculty in AACSB-accredited programs published greater than 4.5 more career articles and about 0.37 more articles per year than did those in nonaccredited programs.
It is important to note that although the paired t tests and the regression analysis suggest significant faculty differ-ences between accredited and nonaccredited schools, neither should be interpreted as causal effects. It is possible that these differences arose because accredited schools employ a differ-ent type of individual than a nonaccredited institution would. Exploring this possibility is the purpose of the subsequent section.
Propensity Score Matching
The preceding regression results capture the salary, teaching, and research differences between accredited and nonaccred-ited faculty far better than simple comparisons of means. However, it is difficult to infer causality due to strong po-tential for selection bias. Does the difference in publication rates arise from differences in productivity between similar individuals at accredited and nonaccredited institutions? Or, is it the result of accredited institutions preferentially hiring faculty who are more research-oriented?
The method of propensity score matching has been devel-oped to account for this type of nonrandom selection. This technique has been used in a growing number of econometric studies (e.g., Dehejia & Wahba, 2002; Eren, 2007; Fryer & Greenstone, 2007; Heckman, Ichimura, & Todd, 1997, 1998). Propensity score matching provides two benefits that linear regression models do not: It is a nonparametric estimation approach, so results are not influenced by functional form as-sumptions; and more importantly, it generates estimates that control for nonrandom selection into treatment (AACSB-accredited) and control (non(AACSB-accredited) groups. The purpose of this technique is to eliminate biases in nonexperimental studies that arise because individuals are not assigned ran-domly to treatment and control groups. These biases can be reduced by matching treatment and control participants based on observables that predict whether a participant is employed at an AACSB-accredited institution. If two individuals have identical characteristics other than salary and accreditation status, then the assignment of one of them to the AACSB group can be considered a random event and the observed salary difference can be attributed to accreditation status. The difficulty lies in identifying individuals who are sufficiently similar when the number of observed characteristics is large. Rosenbaum and Rubin (1983, 1984) showed that this prob-lem can be overcome by matching individuals on the basis of their propensity score, which is the predicted probability of treatment status given observables. Under certain conditions this method provides an unbiased estimate of the average treatment effect on the treated (ATT). The ATT is the mean difference in the outcome measure (salary, research output, or teaching load) for faculty members at AACSB-accredited schools compared to what the measure would have been had those individuals not been at accredited institutions. A necessary condition for this estimate to be unbiased is that the distribution of observed characteristics be similar for
THE EFFECTS OF AACSB ACCREDITATION 289
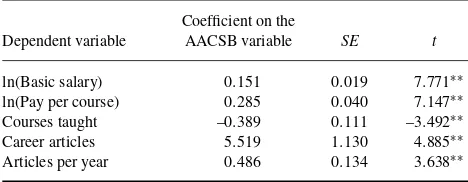
TABLE 4
Impacts of AACSB Accreditation:pScore Matching Results
Note. All matching models include all of the explanatory variables listed in Table 1. Full results are available on request. Total observations=810. Standard errors were calculated by bootstrapping. AACSB=Association to Advance Collegiate Schools of Business.
∗∗p<.01.
individuals with similar propensity scores. This is referred to as the balancing hypothesis.10
Following the guidelines provided by Becker and Ichino (2002), we implemented the matching procedure in the fol-lowing steps. First, using the explanatory variables employed in our regression models, we estimated a logit model to pre-dict the probability of being at an accredited institution. We then dropped variables for which the balancing property fails and re-estimated the logit until we arrived at a specification for which the balancing property is satisfied.11The propensity
scores from this final logit were saved. For each member of the treatment group, we then calculated a weighted average of the difference between that individual’s outcome mea-sure and the outcome meamea-sures for individuals in the control group, where the weights vary inversely with the difference between the propensity scores of the treated and control ob-servations.12We computed the ATT by averaging this mean difference across all individuals in the treatment group. Fi-nally, we estimated standard errors by bootstrapping, with 50 replications.
The ATT estimates are presented in Table 4. The results are quite close to the regression results of Table 3, suggesting that the latter are not subject to selection bias. We conclude that these estimates reflect differences between faculty with similar characteristics other than accreditation status, and does not merely reflect selection of higher paid or more pro-ductive faculty into accredited institutions. Together, the re-gression and matching results suggest an accreditation salary premium of about 12–15%. This is consistent with the results of Levernier and Miles (1992), who found a positive effect but did not estimate its magnitude.
DISCUSSION
The present study documented two findings. First, faculty compensation, research productivity, and teaching loads are significantly different at accredited schools than at nonac-credited schools. Second, these represent differences in the
circumstances of individual faculty members attributable to accreditation, rather than differences in the types of faculty at accredited versus nonaccredited schools. The latter result is not evident from simple comparisons of means, or even from regression analysis that corrects for a large number of fac-ulty and institutional characteristics. Rather, it emerges only after adequately correcting for the possibility of nonrandom selection of faculty between accredited and nonaccredited business schools.
It may be argued that differences in salaries, scholarly out-put, and teaching loads between accredited and nonaccred-ited schools are simply a consequence of hiring practices by schools seeking accreditation. According to this claim, schools attempting to meet AACSB scholarship standards may recruit more productive faculty with the lure of higher compensation and reduced teaching responsibilities. Our re-sults strongly suggest that this is at best only a partial ex-planation of the observed differences. Indeed, the coefficient estimates from the regression and matching models are sta-tistically equivalent, suggesting that the magnitude of any such selectivity effect is likely to be small.
Unfortunately, the data do not allow us to identify whether these differences are a consequence of accreditation, or a cause of it. Most likely causality runs in both directions. Cer-tainly, schools seeking accreditation are likely to put greater pressure on faculty to publish, perhaps facilitating those ef-forts by reducing teaching loads. This may result in higher salaries, perhaps through faster promotion. On the other hand, accreditation itself increases publication pressure for exist-ing faculty, while simultaneously strengthenexist-ing the case of deans who lobby administration for more resources. Those lobbying efforts may result in greater faculty compensation through both higher salaries and lower course loads. Regard-less of the direction of causality, it is evident that higher salaries, greater research productivity, and lower teaching loads at accredited institutions are not merely the result of changes in the composition of the faculty. For these reasons, we believe that our estimates provide upper bounds on the causal effects of accreditation.
There is another reason to believe that we have overes-timated accreditation’s impacts: We have not accounted for nonrandom selection of business schools themselves into ac-credited or nonacac-credited status. Because accreditation is costly, requiring the recruiting and retention of more produc-tive (and hence more costly) faculty, universities with more resources are more likely to seek and obtain accreditation. Because these schools have the ability to pay higher salaries and offer lower teaching loads, it would be likely to see sig-nificant differences between accredited and nonaccredited schools even if accreditation itself had no impact. Because we did not account for this, even the matching model that controls for nonrandom faculty selection is likely to overes-timate the effects of accreditation.
One of the goals of AACSB accreditation is to ad-vance business and management knowledge through faculty
scholarship (AACSB, 2009). We found that faculty in ac-credited institutions publish more refereed articles than their nonaccredited brethren, on an annual and career basis; hence, this objective appears to be met. On the other hand, two other accreditation goals are to provide high-caliber teaching of quality and current curricula and cultivate meaningful inter-action between students and a qualified faculty (AACSB). We lacked the data to determine whether these teaching-related goals were being met; however, our findings that faculty in accredited institutions teach fewer courses, and do so at a higher cost per course, suggest that conflicts over resource allocation between teaching and research objectives are likely to be heightened by accreditation. That being said, additional research is necessary to analyze the impacts of these higher instructional costs on such metrics as class size, student per-formance and retention, and the satisfaction of those who employ business graduates.
In deciding whether to obtain or maintain AACSB ac-creditation, university administrators should consider its full cost—which includes the cost of higher paid instructors teaching fewer courses. These costs may be especially sig-nificant for comprehensive institutions and liberal arts col-leges whose primary mission is instruction, rather than re-search, and particularly in difficult budgetary times. Impor-tantly, these are exactly the schools that are most likely to be seeking accreditation in the future. A dramatic shift in the types of institutions being accredited occurred in the late 1970s. Of approximately 180 institutions in the NSOPF that were AACSB-accredited before 1980, about 80% are doc-toral institutions. In contrast, of the roughly 150 accredited since 1980, about the same percentage are comprehensive and liberal arts schools. As more and more of these institu-tions become accredited, there will be increasing pressure on others to join the club. As Corcoran (2006) pointed out, “At the current pace of accrediting new programs, it’s become less an issue of the credibility conferred by accreditation and more an issue of why an institution is not accredited” (p. 41). Whether those institutions find succumbing to this pressure to be worth the costs remains to be seen. The question of what factors determine a business school’s decision to seek accreditation is one that deserves further research.
NOTES
1. The standards are available at http://www.aacsb.edu/ accreditation/standards.asp. The AACSB revised the standards following criticism that they had been too stringent. For background on the mission-linked stan-dards, see Yunker (2000) and Francisco, Noland, and Sinclair (2008).
2. At the first stage, doctoral institutions were oversam-pled relative to comprehensive and liberal arts insti-tutions. At the second stage, women and minorities were oversampled. All statistical results presented in
this article are based on methods that are robust with respect to sampling methods. Estimates that use sam-pling weights explicitly are numerically similar and produce the same conclusions, and are available on request.
3. Response rates ranged from 76% in the 2004 faculty survey to 84.4% in the 1993 survey. Nonresponse bias does not appear to be a significant issue. For example, based on data provided by their institutions, response rates were similar across gender and ethnic groups. As noted previously, statistical results reported in this article are similar to those based on sampling weights (which explicitly accounted for nonresponse). For a complete description of the NSOPF and the sampling methodology, see NCES (1997, 2002, 2006). 4. Carnegie classification data were drawn from the U.S.
Department of Education Integrated Postsecondary Education Data System, a division of the NCES (nces.ed.gov/IPEDS/). Further information about the classifications can be found at the Web site of the Carnegie Foundation for the Advancement of Teach-ing (www.carnegiefoundation.org/classifications/). 5. NSOPF sample sizes were rounded to the nearest 10
to comply with NCES disclosure requirements. 6. Simply examining basic real salaries may mask the
cost-of-living differences between accredited and nonaccredited campuses. Accordingly, following Du-mond, Hirsch, and Macpherson (1999), in our subse-quent regression analysis we included on the right-hand side a county-level median gross rent index to control for cost-of-living differences.
7. Our results are qualitatively similar for doctoral in-stitutions, albeit of (predictably) greater magnitude. Results disaggregated by Carnegie classification are available on request, as are results from the combined doctoral/comprehensive/liberal arts data.
8. Because information on contract length was not col-lected in the 1988 NSOPF survey, these observations were dropped in the regression analysis.
9. Full regression results are available on request. In ad-dition to an AACSB dummy variable, the independent variables include those reported in Table 1, as well as squared terms for the two experience variables. 10. In practice, this condition is tested by subclassifying
observations into blocks defined by intervals of the propensity score such that the mean propensity score is not statistically different between treated and con-trol groups, and then testing whether the mean value of each explanatory variable is the same for treatment and control observations within each block.
11. We deviated slightly from Becker and Ichino’s recom-mendation at this step. Becker and Ichino suggested first estimating a logit model including just the ex-planatory variables, and then adding interactions and higher order terms. We took the opposite approach,
THE EFFECTS OF AACSB ACCREDITATION 291
estimating at the first round a fully specified model that included all of the explanatory variables in the salary equation, their squares (for the continuous vari-ables), and their cross-products, and then testing down to a more parsimonious model that satisfied the bal-ancing condition.
12. This weighted average is a kernel estimator. We use a Gaussian kernel with a bandwidth of 0.06.
REFERENCES
Association to Advance Collegiate Schools of Business. (2009). Accredita-tion. Retrieved March 2, 2009, from http://www.aacsb.edu/accreditation/ Becker, S. O., & Ichino, A. (2002). Estimation of average treatment effects based on propensity scores [Electronic version].The Stata Journal,2, 358–377.
Corcoran, C. P. (2006). AACSB accredited business programs: Differences and similarities. Journal of Business & Economics Research, 4, 41– 48.
Dehejia, R. H., & Wahba, S. (2002). Propensity score-matching methods for nonexperimental causal studies.Review of Economics and Statistics, 84(1), 151–161.
Dumond, J. M., Hirsch, B. T., & Macpherson, D. A. (1999). Wage differ-entials across labor markets and workers: Does cost of living matter? Economic Inquiry,37, 577–598.
Ehie, I. C., & Karathanos, D. (1994). Business faculty performance eval-uation based on the new AACSB accreditation standards. Journal of Education for Business,69, 257–262.
Eren, O. (2007). Measuring the union-nonunion wage gap using propensity score matching.Industrial Relations,46, 766–780.
Francisco, W., Noland, T. G., & Sinclair, D. (2008). AACSB accreditation: Symbol of excellence or march toward mediocrity?Journal of College Teaching & Learning,5, 25–30.
Fryer, R. G., Jr., & Greenstone, M. (2007).The causes and consequences of attending historically Black colleges and universities. Washington, DC: National Bureau of Economic Research.
Heckman, J. J., Ichimura, H., & Todd, P. E. (1997). Matching as an econo-metric evaluation estimator: Evidence from evaluating a job training pro-gram.Review of Economic Studies,64, 605–654.
Heckman, J. J., Ichimura, H., & Todd, P. E. (1998). Matching as an econo-metric evaluation estimator.Review of Economic Studies,65, 261–294. Jantzen, R. H. (2000). AACSB mission-linked standards: Effects on the
accreditation process.Journal of Education for Business,75, 343–347. Lein, C. D., & Merz, C. M. (1977). Faculty evaluation in schools of business:
The impact of AACSB accreditation on promotion and tenure decisions. Collegiate News and Views, Winter, 21–24.
Levernier, W., & Miles, M. P. (1992). Effects of AACSB accreditation on academic salaries.Journal of Education for Business,68, 55–61. Mincer, J. (1974).Schooling, experience, and earnings. New York: National
Bureau of Economic Research and Columbia University Press. National Center for Education Statistics. (1997). 1993 National Study
of Postsecondary Faculty methodology report. Washington, DC: Au-thor. Retrieved March 30, 2010, from http://nces.ed.gov/pubsearch/ pubsinfo.asp?pubid=97467.
National Center for Education Statistics. (2002). 1999 National Study of Postsecondary Faculty methodology report. Washington, DC: Au-thor. Retrieved March 30, 2010, from http://nces.ed.gov/pubsearch/ pubsinfo.asp?pubid=2002154.
National Center for Education Statistics. (2006). 2004 National Study of Postsecondary Faculty methodology report. Washington, DC: Au-thor. Retrieved March 30, 2010, from http://nces.ed.gov/pubsearch/ pubsinfo.asp?pubid=2006179.
Rosenbaum, P. R., & Rubin, D. B. (1983). The central role of the propensity score in observational studies for causal effects.Biometrika,70(1), 41–55. Rosenbaum, P. R., & Rubin, D. B. (1984). Reducing bias in observational studies using subclassification on the propensity score.Journal of the American Statistical Association,79, 516–524.
Tong, H. M., & Bures, A. L. (1987). An empirical study of faculty evaluation systems: Business faculty perceptions.Journal of Education for Business, 62, 320–322.
Yunker, J. A. (2000). Doing things the hard way—problems with mission-linked AACSB accreditation standards and suggestions for improvement. Journal of Education for Business,75, 348–353.
Yunker, P. J. (1998). A survey of business school heads on mission-linked AACSB accreditation standards.Journal of Education for Business,73, 137–143.