Full Terms & Conditions of access and use can be found at
http://www.tandfonline.com/action/journalInformation?journalCode=cbie20
Download by: [Universitas Maritim Raja Ali Haji] Date: 19 January 2016, At: 19:49
ISSN: 0007-4918 (Print) 1472-7234 (Online) Journal homepage: http://www.tandfonline.com/loi/cbie20
Survey of recent developments
Kunal Sen & Liesbet Steer
To cite this article: Kunal Sen & Liesbet Steer (2005) Survey of recent developments, Bulletin of Indonesian Economic Studies, 41:3, 279-304, DOI: 10.1080/00074910500306577
To link to this article: http://dx.doi.org/10.1080/00074910500306577
Published online: 18 Jan 2007.
Submit your article to this journal
Article views: 123
View related articles
ISSN 0007-4918 print/ISSN 1472-7234 online/05/030279-26 © 2005 Indonesia Project ANU DOI: 10.1080/00074910500306577
SURVEY OF RECENT DEVELOPMENTS
Kunal SenUniversity of East Anglia, Norwich
Liesbet Steer The Asia Foundation, Jakarta
SUMMARY
In the second half of 2005 the government was reminded how difficult it is to gov-ern this vast and complex country. The most significant challenge came from the rise in world oil prices, which sharply increased fuel subsidies and generated considerable pressure to raise domestic fuel prices further. While the rising world oil price did not greatly threaten Indonesia’s budget deficit, negative perceptions (even though misguided) of its impact on the balance of payments and the budget, and a perceived lack of government resolve to deal with the issue, led to considerable investor unease. This, combined with Bank Indonesia’s delay in raising interest rates, resulted in a minor currency upheaval in late August. The government’s appearance of dithering has thus created doubts about its ability to manage the economy in times of crisis. Fuel prices were finally raised on 1 Octo-ber, accompanied by the introduction of a cash transfer program (the largest in the developing world) to cushion the impact on the poor.
Economic growth was sustained during the second quarter, though there is con-cern that this may falter in the aftermath of the fuel price shock. There has been a renewed sense of confidence in the economy (although the macroeconomic mis-steps in August and September somewhat dampened this new optimism). Recent surveys confirm that investors still consider the investment climate to be poorer than elsewhere in the region; macroeconomic instability, regulatory constraints and corruption are core concerns. In the past few months the government has worked on a number of laws to mitigate some of these constraints. The keystone legislation is the new investment law, the current draft of which reflects a shift from an approval to a registration approach to major investments, and aims to simplify registration procedures. The government is also working to make taxa-tion laws more business friendly. It has not yet been as successful as it would have liked in attracting private investment in key infrastructure projects, however.
Reconstruction in Aceh has been much slower than hoped, but there have been some promising signs of progress recently. Indonesia has differentiated itself from other tsunami-affected countries in designing a set of principles to guide the reconstruction process that emphasise locally led and community-driven approaches, and in establishing a special Rehabilitation and Reconstruction Agency, albeit at some cost in terms of significant delays. The government has also used the unique opportunity afforded by the disaster to negotiate a peace accord with the Free Aceh Movement, raising hopes for an end to 30 years of violence in the province.
1At the start of the year the parliament identified 55 laws to receive priority; to date none
has been passed.
INTRODUCTION
In October 2005, the new government led by Susilo Bambang Yudhoyono (SBY) completed one year in office. Its stated priorities were boosting investment, tack-ling corruption and reducing poverty. Judged by these goals, its first year was a moderate success. By June 2005, investment had risen by 13%, and as a share of GDP stood higher than at any time since 1997—though still well below pre-crisis levels. On the corruption front, the campaign to investigate and prosecute high-profile targets, including scores of governors, mayors and local legislators, is starting to bite, and businesses and corrupt government officials now appear to be acting with greater caution. The number of poor declined during the year, and on two occasions—associated with the two fuel price increases—dramatic new anti-poverty programs were put in place. In March, around $1 billion was allo-cated to provide free access to education and health care for the poor. And in October, a cash transfer system was introduced for the poorest 15 million house-holds, the largest such program in the developing world.
Despite some real achievements, the new government simply was not well organised enough to deliver disciplined and consistent implementation of eco-nomic reforms. Thus, the impressive ambition of January’s infrastructure summit is still far from realisation, and the streamlining of the regulatory environment has been much slower than hoped.1Despite high-profile prosecutions, a
compre-hensive anti-corruption strategy (including thorough-going civil service reform) is still lacking, and a comprehensive anti-poverty action plan is also still awaited. It would seem that reform on the scale promised during the election campaign makes impossible demands on bureaucratic capacity and on the new government itself—especially given that the cabinet was forged from several different politi-cal bases.
The government’s first year in office was made much harder by formidable shocks in the form of the tsunami tragedy of December 2004 and the rise in world oil prices (discussed in detail below). These events absorbed a great deal of man-agerial attention, and there were costly delays in decision making. In the second half of 2005, the government also faced serious public health threats, including severe malnutrition in Nusa Tenggara and other eastern provinces, a major polio outbreak and avian influenza. Having been polio-free for 10 years, Indonesia has faced the largest recorded polio outbreak in its history. With 231 recorded cases by early September, it had become the third worst infected country in the world (after Yemen and Nigeria), raising fears that Indonesia could transmit outbreaks throughout Asia. In late August the government, in collaboration with the United Nations, organised a massive vaccination campaign, targeting 24 million children under five years old. More than 750,000 vaccinators, health workers and volun-teers in 245,000 immunisation posts were employed for the task. The government also faced the alarming spread of avian influenza, which reappeared in Indonesia in March. Fears of a pandemic following laboratory confirmation of human cases heightened public concern. To control the outbreak, the government has so far relied on mass vaccinations of poultry in infected and immediately surrounding
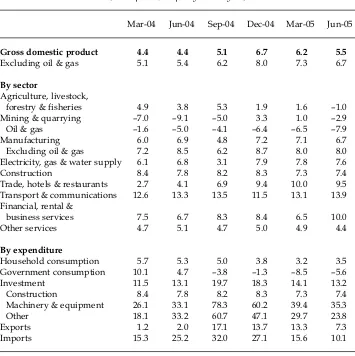
TABLE 1 Components of GDP Growth (2000 prices; % p.a. year-on-year)
Mar-04 Jun-04 Sep-04 Dec-04 Mar-05 Jun-05
Gross domestic product 4.4 4.4 5.1 6.7 6.2 5.5
Excluding oil & gas 5.1 5.4 6.2 8.0 7.3 6.7
By sector
Agriculture, livestock,
forestry & fisheries 4.9 3.8 5.3 1.9 1.6 –1.0 Mining & quarrying –7.0 –9.1 –5.0 3.3 1.0 –2.9 Oil & gas –1.6 –5.0 –4.1 –6.4 –6.5 –7.9 Manufacturing 6.0 6.9 4.8 7.2 7.1 6.7 Excluding oil & gas 7.2 8.5 6.2 8.7 8.0 8.0 Electricity, gas & water supply 6.1 6.8 3.1 7.9 7.8 7.6 Construction 8.4 7.8 8.2 8.3 7.3 7.4 Trade, hotels & restaurants 2.7 4.1 6.9 9.4 10.0 9.5 Transport & communications 12.6 13.3 13.5 11.5 13.1 13.9 Financial, rental &
business services 7.5 6.7 8.3 8.4 6.5 10.0 Other services 4.7 5.1 4.7 5.0 4.9 4.4
By expenditure
Household consumption 5.7 5.3 5.0 3.8 3.2 3.5 Government consumption 10.1 4.7 –3.8 –1.3 –8.5 –5.6 Investment 11.5 13.1 19.7 18.3 14.1 13.2 Construction 8.4 7.8 8.2 8.3 7.3 7.4 Machinery & equipment 26.1 33.1 78.3 60.2 39.4 35.3 Other 18.1 33.2 60.7 47.1 29.7 23.8 Exports 1.2 2.0 17.1 13.7 13.3 7.3 Imports 15.3 25.2 32.0 27.1 15.6 10.1
Sources: CEIC Asia database; authors’ compilations.
areas, but with limited culling and bio-security measures. There has been much criticism of the past government’s initial slow response to the virus when it first emerged two years ago, and concern persists that the current government is not acting with sufficient urgency.
MACROECONOMIC DEVELOPMENTS Economic Growth
The year-on-year growth rate for the second quarter of 2005 was 5.5%, down from the peak of 6.7% achieved in the December quarter of 2004 (table 1). Much of the increase in output occurred in the secondary and tertiary sectors, with the pri-mary sector (agriculture and natural resource-based activities) experiencing a contraction in the second quarter, following slow growth previously. It is
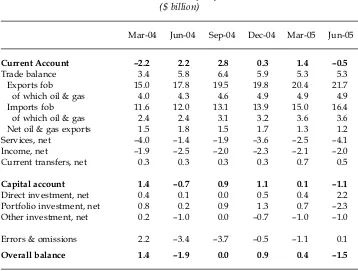
TABLE 2 Balance of Payments ($ billion)
Mar-04 Jun-04 Sep-04 Dec-04 Mar-05 Jun-05
Current Account –2.2 2.2 2.8 0.3 1.4 –0.5
Trade balance 3.4 5.8 6.4 5.9 5.3 5.3 Exports fob 15.0 17.8 19.5 19.8 20.4 21.7 of which oil & gas 4.0 4.3 4.6 4.9 4.9 4.9 Imports fob 11.6 12.0 13.1 13.9 15.0 16.4 of which oil & gas 2.4 2.4 3.1 3.2 3.6 3.6 Net oil & gas exports 1.5 1.8 1.5 1.7 1.3 1.2 Services, net –4.0 –1.4 –1.9 –3.6 –2.5 –4.1 Income, net –1.9 –2.5 –2.0 –2.3 –2.1 –2.0 Current transfers, net 0.3 0.3 0.3 0.3 0.7 0.5
Capital account 1.4 –0.7 0.9 1.1 0.1 –1.1
Direct investment, net 0.4 0.1 0.0 0.5 0.4 2.2 Portfolio investment, net 0.8 0.2 0.9 1.3 0.7 –2.3 Other investment, net 0.2 –1.0 0.0 –0.7 –1.0 –1.0
Errors & omissions 2.2 –3.4 –3.7 –0.5 –1.1 0.1
Overall balance 1.4 –1.9 0.0 0.9 0.4 –1.5
Source: CEIC Asia Database.
aging to see the non-oil and gas manufacturing sector show sustained growth rates of 8% and above in the three most recent quarters. Owing to the large increase in fuel prices on 1 October, growth forecasts for the whole of 2005 are in the 5.5–6% range, slightly down from earlier estimates. For 2006, most estimates (e.g. IMF, World Bank and Asian Development Bank) are in the same range, again representing a slight lowering of earlier forecasts.
The Balance of Payments
After being in surplus for four quarters from April 2004, the current account turned negative in the second quarter of 2005 (table 2). There has been a decline in both oil and non-oil export volumes, but export value continued to increase because of offsetting movements in commodity prices (including oil). The dete-rioration in the current account can be linked primarily to a worsening of the service account, reflecting higher transport charges associated with strong import growth, and lower tourism receipts (IMF 2005). In the second quarter of 2005, the capital account registered a deficit (of $1.1 billion) for the first time in a year. This was primarily due to a net outflow of portfolio investment, along with low disbursements of loans to the government, which led to the ‘other investments’ category being negative. As a consequence of both the current and capital accounts being in deficit, the overall balance of payments registered a deficit of $1.5 billion.
FIGURE 1 Consumer Price Inflationa (% p.a. year-on-year)
Sep–04 Nov–04 Jan–05 Mar–05 May–05 Jul–05 Sep–05 0
4 8 12
CPI Non-food
Food
aCPI = consumer price index.
Source: CEIC Asia Database.
Monetary Policy
The past few months have been a challenging period for Bank Indonesia (BI) on two fronts. First, after a period of falling inflation in 2003 and early 2004, there was a resurgence in the consumer price index (CPI) in 2005, with food prices, in particular, showing a large increase during May–August. The inflation rate rose to exceed 9% by September (figure 1). Second, the exchange rate has been under pressure from a combination of real, monetary and psychological factors. With respect to real factors, the current account fell from $8.1 billion in 2003 to $3.1 bil-lion in 2004, turning negative in the second quarter of 2005. The inflow of private capital has not been sufficient to compensate for the weakening current account. On the monetary side, real interest rates actually turned negative in March and April (figure 2), which led to a portfolio reallocation as the interest rate differen-tial between the US and Indonesia shrank. Finally, on the psychological front, the lack of clarity about how SBY would handle the oil price increase further height-ened uncertainty—in an already fragile environment—and was a key contributor to a ‘mini currency crisis’ at the end of August.
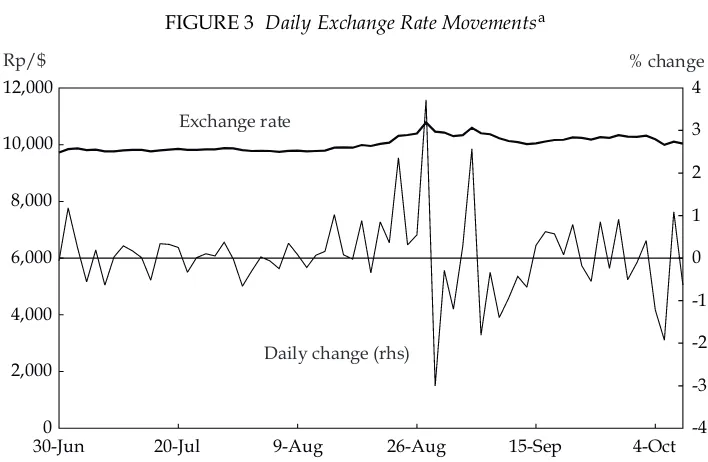
BI sought to balance the need to rein in monetary growth against concern that excessive tightening may have an adverse impact on investment, which had finally shown signs of turning the corner. In the June–August period it got this balance wrong, allowing interest rates to become sufficiently out of line with international rates so that its sales of rupiah increased markedly, and a run on the currency became a reality. In the second half of August the exchange rate crossed the Rp 10,000/$ barrier, and kept falling to reach a low of Rp 10,935/$ on 30 August (figure 3). It recovered quickly to Rp 10,400/$ when BI belatedly raised interest rates (the SBI [Bank Indonesia certificate] rate was increased from 8.5% to
Rp/$ % change
30-Jun0 20-Jul 9-Aug 26-Aug 15-Sep 4-Oct 2,000
4,000 6,000 8,000 10,000 12,000
-4 -3 -2 -1 0 1 2 3 4
Exchange rate
Daily change (rhs)
FIGURE 3 Daily Exchange Rate Movementsa
a% change is relative to previous trading day.
Sources: CEIC Asia Database; Pacific Exchange Rate Service.
Sep–040 Nov–04 Jan–05 Mar–05 May–05 Jul–05 Sep–05 10
20 30 40
-2 0 2 4 6 8 10 12 14
$ billion % p.a.
Reserves
30-day SBI rate (rhs)
Real 30-day SBI rate (rhs)
FIGURE 2 Interest Rates and International Reserves
aSBI: Bank Indonesia certificate.
Source: CEIC Asia Database.
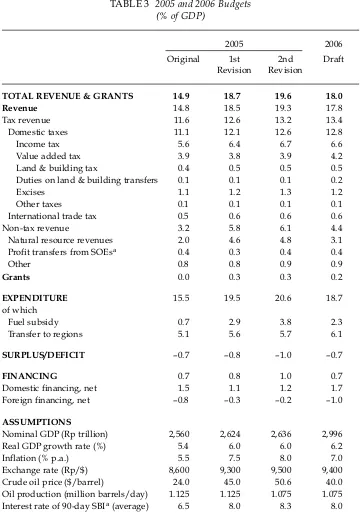
2Because the second 2005 budget revision and the 2006 budget presented in table 3
pre-date the October domestic fuel price increase, the fuel subsidy estimates shown will be revised downwards substantially.
9.5% during August, and then to 10% shortly afterward) (figure 2). But the dam-age in the minds of some market participants was already done, and Indonesia had again lost its reputation (at least temporarily) for disciplined macroeconomic management. At the same time, the sharp fall in international reserves (figure 2), beginning in April, indicated that BI was intervening quite significantly in the foreign exchange market to support the weakening rupiah, thus moving away from its declared floating exchange rate policy.
Finally, in an effort to calm the foreign exchange markets, BI introduced meas-ures in June to restrict rupiah transactions and foreign currency lending by banks. One of the measures, which lowered the daily swap transaction ceiling from $3 million to $1 million, unintentionally placed further pressure on the rupiah, as hedging options for buyers of the currency were reduced.
Fiscal Policy
The government submitted a second revision of the 2005 budget and a 2006 budget in mid-August, only a month after the parliament had approved the first 2005 revised budget (table 3). The second revision is more substantial than the first, because assumptions on key macroeconomic variables adopted previ-ously—in particular, on the world price of oil—had to be changed significantly.2
Thus, expenditures have been set at 20.6% of GDP in the second 2005 revision, compared with 19.5% in the first, owing mainly to the increase in the fuel subsidy from 2.9% to 3.8% of GDP. Revenues are now projected to increase from 18.5% to 19.3% of GDP, mainly due to an upward revision in tax revenues by 0.6% of GDP. The overall fiscal deficit is projected to be 1.0% of GDP, underscoring the govern-ment’s commitment to fiscal prudence. A positive aspect of fiscal policy in 2005 has been the relatively modest impact of tsunami-related transactions on the budget, with the effect on the overall fiscal balance predicted to be –0.3% of GDP (IMF 2005). This is because the financing needs arising from the reconstruction have been met largely from international financial assistance.
THE FUEL PRICE INCREASE
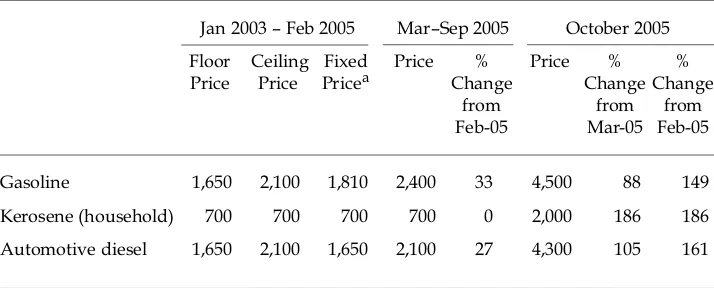
On 1 October 2005, fuel prices were raised by a weighted average of 114%, with household kerosene prices, which had been protected in earlier increases, nearly tripling from Rp 700/litre to Rp 2,000/litre (table 4). There were also increases in the other highly subsidised categories of premium gasoline and automotive diesel; the cumulative effect of price rises for the year to date is similar for the three categories—186% for kerosene, 149% for gasoline and 161% for automotive diesel. As a result of the increases, domestic fuel prices are now significantly closer to—though still well below—international prices: gasoline, kerosene and automotive diesel are now 68%, 31% and 68% of international prices, respectively (World Bank 2005b).
TABLE 3 2005 and 2006 Budgets (% of GDP)
2005 2006
Original 1st 2nd Draft Revision Revision
TOTAL REVENUE & GRANTS 14.9 18.7 19.6 18.0
Revenue 14.8 18.5 19.3 17.8
Tax revenue 11.6 12.6 13.2 13.4 Domestic taxes 11.1 12.1 12.6 12.8
Income tax 5.6 6.4 6.7 6.6
Value added tax 3.9 3.8 3.9 4.2 Land & building tax 0.4 0.5 0.5 0.5 Duties on land & building transfers 0.1 0.1 0.1 0.2
Excises 1.1 1.2 1.3 1.2
Other taxes 0.1 0.1 0.1 0.1
International trade tax 0.5 0.6 0.6 0.6 Non-tax revenue 3.2 5.8 6.1 4.4 Natural resource revenues 2.0 4.6 4.8 3.1 Profit transfers from SOEsa 0.4 0.3 0.4 0.4
Other 0.8 0.8 0.9 0.9
Grants 0.0 0.3 0.3 0.2
EXPENDITURE 15.5 19.5 20.6 18.7
of which
Fuel subsidy 0.7 2.9 3.8 2.3
Transfer to regions 5.1 5.6 5.7 6.1
SURPLUS/DEFICIT –0.7 –0.8 –1.0 –0.7
FINANCING 0.7 0.8 1.0 0.7
Domestic financing, net 1.5 1.1 1.2 1.7 Foreign financing, net –0.8 –0.3 –0.2 –1.0
ASSUMPTIONS
Nominal GDP (Rp trillion) 2,560 2,624 2,636 2,996 Real GDP growth rate (%) 5.4 6.0 6.0 6.2 Inflation (% p.a.) 5.5 7.5 8.0 7.0 Exchange rate (Rp/$) 8,600 9,300 9,500 9,400 Crude oil price ($/barrel) 24.0 45.0 50.6 40.0 Oil production (million barrels/day) 1.125 1.125 1.075 1.075 Interest rate of 90-day SBIa(average) 6.5 8.0 8.3 8.0
aSOE: state-owned enterprise; SBI: Bank Indonesia certificate.
Sources: Ministry of Finance; authors’ compilations.
TABLE 4 Developments in Regulated Fuel Product Prices (Rp per litre)
Jan 2003 – Feb 2005 Mar–Sep 2005 October 2005 Floor Ceiling Fixed Price % Price % % Price Price Pricea Change Change Change
from from from Feb-05 Mar-05 Feb-05
Gasoline 1,650 2,100 1,810 2,400 33 4,500 88 149 Kerosene (household) 700 700 700 700 0 2,000 186 186 Automotive diesel 1,650 2,100 1,650 2,100 27 4,300 105 161
aGovernment regulations specify floor and ceiling prices; in practice, however, prices were
fixed during this period.
Sources: Keppres (Presidential Decree) 90/2002; Keppres 22/2005; Perpres (Presidential Regulation) 55/2005; World Bank (2005b).
The question of how much domestic fuel prices should be increased had become a major economic and political issue, dominating the agenda for the gov-ernment during the survey period. There were strong and conflicting views on the implications of the oil price increase for the economy in the short to medium term, and on the possible impact of a rise in domestic fuel prices on the poor. Therefore, the government’s decision to take the politically difficult step of rais-ing domestic fuel prices to the extent it has is indeed creditable. Nevertheless, many observers would argue that much of the economic uncertainty that pre-vailed in the survey period could have been avoided with an earlier announce-ment of the price increases.
The view that the increase should have been implemented much earlier ignores the political economy dimensions of the issue. Such a policy move would have been extremely difficult to justify if the government had not provided com-pensation for the poor, particularly since the product that needed the biggest price adjustment was kerosene, the major fuel used for cooking purposes by poor households. Arguably, it would have been premature to implement an increase in fuel prices before the government had a system in place to identify poor house-holds, and a mechanism by which the cash transfers could be made without delay.
The argument in favour of the increases was complicated by the perception that the rise in world oil prices (and the associated increase in the fuel subsidy) would seriously threaten Indonesia’s macroeconomic stability. In fact, the avail-able evidence suggests that the fuel subsidy did not fundamentally threaten the budget or the balance of payments. In terms of the latter, the impact of rising world oil prices is almost negligible. Recent estimates suggest that an increase in
3The Supreme Audit Agency (BPK) found that at least one-eighth of last year’s Rp 80.42
trillion ($7.9 billion) fuel subsidy was lost to smuggling (JP, 11/10/2005).
world oil prices is positive for the trade account, and very slightly negative for the overall balance of payments, under the assumption that foreign oil compa-nies take most of their profits out of the country. In terms of the budget, the impact of higher world prices is clearly negative, but relatively modest. The best estimates suggest that each $1/barrel increase results in a $100 million increase in the central government’s budget deficit (World Bank 2005b). In simple terms, roughly half of this $100 million is in the form of the legal requirement to increase block grants to the regions, which is potentially beneficial for the econ-omy given the need for greater regional government spending on infrastructure. The other $50 million results from the fact that the subsidy increases more rap-idly than revenues. A $10/barrel increase in the world price of oil would thus increase the central government budget by $1 billion (0.3% of GDP), whereas the whole-of-government budget deficit would increase by only about $500 million (0.15% of GDP). While these impacts were not trivial, and needed to be addressed, they were not a fundamental threat to macroeconomic stability.
The primary arguments for the fuel price increase were thus twofold. First, government spending of approximately $13 billion on fuel subsidies was regarded as regressive and distortionary, helping neither growth nor poverty reduction goals, but rather leading to wasteful over-consumption of oil, to mas-sive smuggling, and to local shortages of fuel products.3 Spending this money
instead on pro-growth and pro-poor investments—infrastructure, education, health and targeted poverty programs—was seen by the government as much more in line with its development objectives.
Second, there was a recognition that failure to implement an increase would cast doubt on the government’s commitment to economic reform. The pressure on the rupiah in July–August 2005 could be seen as a reflection of the weakening confidence of investors in the government’s willingness to take tough economic policy decisions. If the recent gains in investment were not to be lost, it was imperative for the government to demonstrate to the business community its capacity to act, even when politically risky.
The government also announced that, beginning in 2006, the remaining sub-sidy on oil prices will be phased out, and that a new system for calculating domestic fuel prices will be established. When domestic prices reach interna-tional prices, the price of gasoline, diesel and kerosene will rise and fall in line with international prices. With this announcement, it is hoped that the saga of the fuel subsidy will finally be over for the SBY government.
The Cash Compensation Program for the Poor
Along with the sharp increase in fuel prices, the government announced an unprecedented cash compensation program for poor and near-poor households. It estimated the budgetary saving for the remainder of the fiscal year (i.e. Octo-ber–December 2005) from the fuel price increases at approximately Rp 25 trillion (about $2.5 billion). Of this, Rp 4.7 trillion—about one-fifth—was allocated to the cash transfer program, under which Rp 300,000 per quarter per household began
flow to 15.5 million poor and near-poor target households, starting in October. With over 60 million people covered, the cash transfer program would be the largest such scheme in the developing world.
Identifying the 15.5 million poorest households was a huge challenge, under-taken under great pressure. The central statistics agency (BPS) developed the nec-essary database by first interviewing village leaders and cross-checking other sources to develop a list of potential poor and near-poor households. A survey was undertaken of these households to ascertain key economic and social charac-teristics. Poverty rankings were then determined using a proxy means test that correlated observable household characteristics with household income. Finally, the budgetary allocation for each region’s cash transfer was determined from the previous household survey data, with eligibility set by the household’s score on the proxy means test. Identity cards for these households were printed at the rate of over 1 million per day during the second half of September. The post office was selected as the delivery mechanism for the cash transfers (World Bank 2005b).
Early implementation of the scheme has, predictably, faced significant prob-lems. There have been numerous cases in which the poor have not received iden-tity cards, while the non-poor have. And there have been many examples in which officials at the lowest levels of government have been found to be extort-ing payments (of up to Rp 100,000 for each Rp 300,000 received) from beneficiar-ies. Each day in the early weeks, newspapers brought stories of both kinds of problems. In some situations these abuses led to small-scale riots and even the destruction of the local post offices from which the benefits were being disbursed (e.g. JP, 19/10/2005). The existence of such problems is not remarkable or unex-pected; they were widely predicted, including by government officials. What matters is how the government responds to them. It has put systems in place to monitor and rectify errors and punish abuses. If this mechanism of learning and correction fails, the entire program could collapse. If it succeeds, the program could be hailed as one of the more pro-poor measures introduced in any country in 2005.
The success of the program will depend critically on the involvement of NGOs, the press, activists and universities, to monitor outcomes and to ensure that the targeting of households is appropriate. In the next few months and years it will become clearer whether this remarkable experiment with a radical and far-reach-ing anti-poverty program will indeed deliver tangible benefits to the poor, and whether such an experiment can be replicated in other countries that share many of Indonesia’s institutional weaknesses.
The program raises several issues.
First, was it really necessary? As Liddle (2005, this issue) argues, President Yudhoyono realised, following the vociferous public protests against the much more limited fuel price increases in March, that a further, more dramatic, price increase could have significant political costs. It was essential to signal to the elec-torate that the government took its pro-poor credentials seriously, but at the same time was serious about economic reform. Furthermore, poverty head-count ratios are at last back at pre-crisis levels (World Bank 2005c), and any new set-back on the poverty reduction front would not have been desirable. Empirical studies suggest that the price increases that occurred during the 1997 financial crisis had a greater negative impact on poor households, especially those living in urban
areas, than on non-poor households (Levinsohn et al. 1999; Friedman and Levin-sohn 2001). While it is difficult to predict what the full effect of the October fuel price increase on the poor would have been in the absence of the cash compensa-tion program, it is clear that it would have been negative. Thus a compensacompensa-tion mechanism for poor and near-poor households was needed at the time of the fuel price increase.
Second, could the poor have been compensated more efficiently? The government could have opted for increasing in-kind transfers to the poor in the form of entitlements to free or subsidised education and health services, as it had done following the March price increase. There was a strong view among some econo-mists that in-kind transfers would be more beneficial to poor households in the long run, supplying productive assets to help them climb out of poverty in a sus-tainable manner (McLeod 2005: 140–1). Under this view, cash transfers could be seen as no more than a temporary solution to the poverty-exacerbating impact of a cut in fuel subsidies. There was also concern that the cash transfer mechanism may lead to increased corruption at the local level, and be used for political pur-poses.
There were, however, two important arguments in support of the cash transfer option. First, it was necessary for benefits to go to the poor almost immediately, to match the immediate decline in real income. The cash transfer represented per-haps the onlypractical way to compensate the poorest 25% of the population for a tripling of kerosene prices. Indirect subsidies, by their very nature, take a long time to filter through: following the March fuel price increase, $1 billion was allo-cated to provide free access for the poor to education and health care, but these funds were only slowly beginning to be disbursed by the last quarter of 2005.
A second argument, on economic efficiency grounds, in support of cash trans-fers is that they do not directly influence market prices in the way that in-kind transfers do. Resources are used more inefficiently when policy makers inter-vene to set prices that are different from marginal social benefit or marginal social cost, as occurs in the case of in-kind transfers. Moreover, cash subsidies provide recipients with greater freedom of choice than in-kind transfers, and consequently give them a higher level of satisfaction for a given size of transfer (Tabor 2002).
Third, could the government have introduced conditional cash transfers? The gov-ernment could have chosen to provide cash to the poor conditional upon school attendance, participation in nutrition programs, and so on, on the part of their children. Such conditional schemes meet short-term income support objectives as well as promoting longer-term accumulation of human capital, by serving as a demand-side complement to the supply of health and education services. There is clear evidence in many Latin American countries that conditional cash transfers can increase school enrolment rates, improve preventive health care and raise household consumption (Rawlings 2004). The government has indi-cated that it will move towards a conditional cash transfer scheme in later years. However, its implementation at this juncture was impractical. Apart from the need to cushion poor households immediately from the adverse effects of the fuel price increase, a conditional cash transfer needs a more sophisticated insti-tutional structure to monitor household behaviour than is necessary for an unconditional system. Given that this is Indonesia’s first attempt to implement
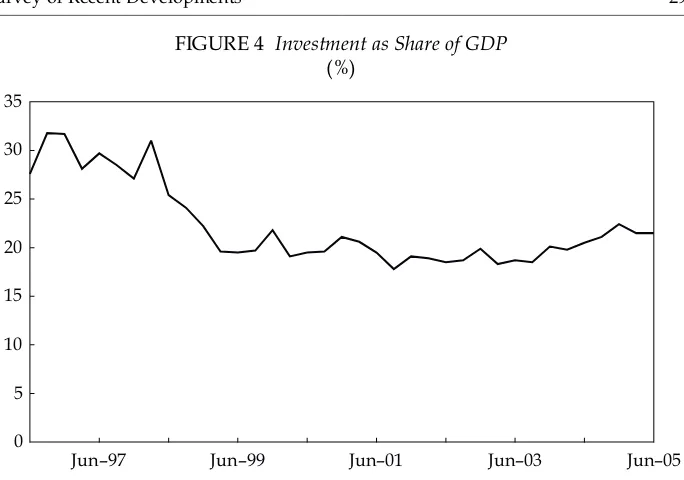
FIGURE 4 Investment as Share of GDP (%)
Jun–97 Jun–99 Jun–01 Jun–03 Jun–05 0
5 10 15 20 25 30 35
Source: CEIC Asia Database.
a cash transfer program to the poor, and given the program’s size, the set-up costs are enormous. Thus, it would make sense to introduce conditional cash transfers after an initial period of experimentation and ‘learning by doing’ with the current cash transfer system.
THE INVESTMENT CLIMATE
Since its inauguration, the SBY government has recognised that a higher rate of investment is essential for achieving most, if not all, of its development objec-tives. Investment as a share of GDP fell from 30% to 20% at the time of the crisis, and has remained stubbornly flat until recently. Indeed during the Megawati administration’s ‘Year of Investment’ (2003–04), the rate actually fell to below 19%. With China’s rate at 45%, and Vietnam’s at over 30%, the new administra-tion recognised that any hope of economic success was forlorn in the absence of real progress on this front.
Judged by outcomes and perceptions, the past year has seen relative success, though it remains unclear whether recent macroeconomic missteps will under-mine this trend. The rate of investment rose significantly in the first two quarters of 2005 to reach 22% of GDP in the June quarter (figure 4). Capital goods imports rose by 46% in the first half of 2005 over one year earlier. Unlike the previous three years, when new investment was heavily concentrated in sectors such as real estate development, over recent months a greater share has been in non-property activities such as machinery and transport, suggesting an expansion in production capacity. There are even signs of new vitality in the small and
4This is significantly higher than in the non-SME sector: total credit extended by
commer-cial banks rose by just 29% during the same period.
medium enterprise (SME) sector, with credit extended to SMEs rising by 40% in the first six months of 2005.4
Some of these gains are due to cyclical factors. Evidence on capacity utilisation is hard to come by, but estimates indicate that capacity utilisation at the end of 2004 was higher than at any time since the crisis in the late 1990s (World Bank 2005b), and in some sectors there was, for the first time since then, no way of expanding output without new investment. But some of the gains clearly also indicate a renewed sense of confidence. This is reflected, for example, in changes in sovereign risk ratings: all the major ratings agencies have upgraded their Indo-nesia assessments since the SBY administration came to office—Standard & Poor’s from B to B+ in December; Fitch from B+ to BB- in January; Moody’s to ‘positive’ in February (while holding the rating at B2); and the leading Japanese agency (Rating and Investment Information) from B to BB- in August. In early October the government also made its second overseas bond issue for the year, and raised $1.5 billion. The bonds were more than four times oversubscribed, drawing a total of $4.25 billion worth of bids from 386 investors. While this money is not cheap (an 8.6% yield for 30-year funds, a 7.6% yield for 10-year funds), it suggests increasing international confidence in the long-term prospects of the economy, and approval of recent government and central bank policy deci-sions (JP, 7/10/ 2005).
Successful Persuasion Campaign but Investor Concerns Persist
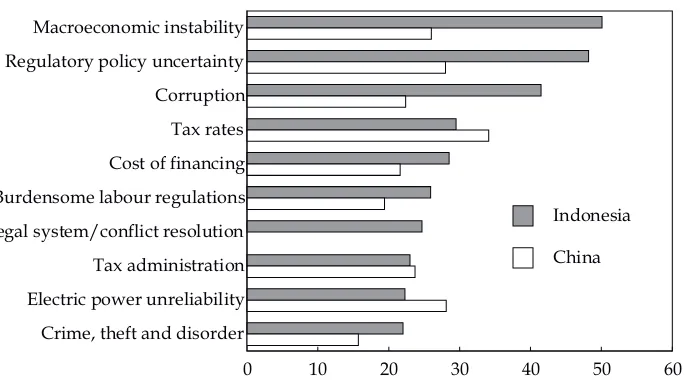
The government has had some success in convincing investors that Indonesia is ‘open for business’. At home as well as abroad it has been able to create an atmos-phere of optimism (Hill 2005). Presidential trips to Australia, the US, Japan and China have all placed investment issues at centre stage. At home the president and his economics ministers have engaged in a closer dialogue with investors, both directly and through the foreign and domestic chambers of commerce, including personal engagement at gatherings such as the Foreign Investors Forum at the end of August. However, despite these achievements and promises, whether the government can actually deliver a business-friendly environment remains an open question. The backlog of regulatory and policy reform impera-tives inherited by the new administration was huge, and the business community is growing increasingly frustrated about the lack of concrete progress in invest-ment climate reforms. Surveys have consistently shown that businesses consider the domestic investment climate to be poorer in Indonesia than in other countries in the region, including its major new competitor, China (figure 5).
A new terrorist bombing in Bali on 1 October, and various kinds of harass-ment of both the Christian community and parts of the Islamic community in recent months, have fuelled worries about rising Muslim radicalism and intoler-ance (box 1). While this might be expected to impact on the investment climate, it appears that security concerns are not the major preoccupation of the business community. Firms cite macroeconomic instability and regulatory uncertainty as
FIGURE 5 Constraints on Doing Business in Indonesia and Chinaa (% of respondents)
Crime, theft and disorder Electric power unreliability Tax administration Legal system/conflict resolution Burdensome labour regulations Cost of financing Tax rates Corruption Regulatory policy uncertainty Macroeconomic instability
0 10 20 30 40 50 60 Indonesia
China
aChart shows top 10 constraints rated ‘major’ or ‘very severe’ in Indonesia, with
compar-ative data for China.
Source: World Bank (2005d).
5The World Bank’s Doing Business survey estimates that it takes 151 days on average to
establish a business (World Bank 2005a). The difference between this and the LPEM sur-vey lies in the methodology. While the Doing Business figure is based on conservative measures by lawyers in Jakarta, the LPEM figure is based on a survey of notaries. The dif-ference suggests that such data should be interpreted with extreme caution.
6The time needed to obtain local permits varies between 16 (work safety permit) and 43
(environment permit) days. Firms could spend up to 180 days if they obtained local per-mits sequentially.
core problems, while crime, theft and disorder rank far behind (figure 5). Even though broad improvements in macroeconomic performance have occurred in the past two years, firms are worried about the continuing vulnerability of the macro framework. More importantly, many firms also feel that regulatory uncer-tainty and corruption are seriously hampering their growth.
A recent survey by the University of Indonesia’s Institute for Economic and Social Research (LPEM–UI) confirms that such problems remain. It estimates that it takes on average 80 days just to register a firm.5Obtaining sectoral and local licences could add up to a further 180 days.6With 12 procedures to be undertaken (some countries require only two), Indonesia has the most complex business start-up process in the region. The registration process involves contact with no fewer
BOX1 A CONSERVATIVE TRAJECTORY ININDONESIANISLAM?
The international media and some academics have recently warned of rising Islamic radicalism and intolerance in Indonesia. As evidence they have cited such things as attacks by militant Muslims on campuses of the Ahmadiyah sect (regarded by some Muslims as heretical), the forced closure of unregistered churches, fatwas from the Indonesian Ulama Council (MUI) proscribing inter-faith marriages, liberalism, plu-ralism and secularism, and conservatives’ attempts to shut down the high-profile Liberal Islamic Network (JIL). None of this is good for business confidence in a country still struggling to restore pre-crisis levels of investment.
These developments are undoubtedly setbacks for religious pluralism, but do they represent or forebode a deeper shift in the character of Indonesian Islam towards fundamentalism? I would argue no. In order to explain why, a broader his-torical and political perspective is needed.
For more than a century, Indonesian Islam has been subject to competing conser-vative and reformist forces. The exact nature of these conserconser-vative and reform agen-das has varied over time, but in general the former have sought to defend or restore what they see as the essential teachings and traditions of the faith, whereas the lat-ter have argued for changes in Islamic thought and practice, often with the aim of allowing their community to better meet the demands of the modern age. The events of the past year should be seen as part of this longer-term, dynamic process. At present, Indonesia is experiencing a conservative turn. This is evident not only in the events described above, but also in developments within mainstream Islamic organisations. The nation’s two biggest Muslim groups, Nahdlatul Ulama and Muhammadiyah, have had their respective five-yearly congresses in the past 10 months and in both cases conservative leaders were ascendant and liberal thinkers marginalised. This does not mean that Indonesian Islam has lost its tolerance or mod-erateness, but it does signal a reaction against the more controversial liberal Muslim agenda and a ‘return to basics’ sentiment within the mainstream. Many Islamic lead-ers complain, for example, that some liberal proposals, such as banning polygamy and distributing inheritance equally between male and female heirs, are contrary to explicit teachings of the Qur’an and may thus lead Muslims into sin if enacted.
Such religious conservatism is not unique to contemporary Indonesia or even to other Muslim societies. Conservative Christianity has grown in political influence in many Western countries, including the US and Australia, in recent years and simi-lar trends can be seen in some majority Hindu, Jewish and Buddhist communities. The bigger question is how far-reaching Indonesia’s conservative trend will be. Many observers have noted that Indonesian Muslims are becoming more pious and have assumed that this will lead to growing radicalism. But greater Islamic self-consciousness does not automatically lead to greater militancy.
Present-day Indonesian Muslims tend to be more devout than past generations. Higher mosque attendance, the growing popularity of distinctively Islamic dress and the burgeoning market for Islamic books and education attest to this. It has not led, however, to rising support for Islamist parties advocating an Islamic state or the com-prehensive implementation of Islamic law. At the 2004 general election, Islamist par-ties gained only 22% of the vote, and Islam played only a peripheral role in both the 2004 presidential election and the 2005 regional polls. So, despite the growing Islami-sation, most Muslims still support pluralist or secular nationalist parties.
On present indications, there is little evidence to support the view that Indo-nesian Islam is set on a long-term conservative or radical trajectory. The nation is going through a conservative phase, but history suggests that this will ebb over time as the more moderate tendencies in mainstream Islam reassert themselves.
Greg Fealy, ANU
than eight government agencies at different levels, although the largest bottle-necks are caused by only a few of these procedures. Of the start-up time, 60% is taken by the two-step registration procedure at the Ministry of Justice and the Ministry of Trade. In other countries a single authority has responsibility for this procedure. Firms also estimate that informal payments ‘to get things done’ amount on average to 6.4% of production costs, and corruption at customs to 2.3% of import value. Complicated tax regulations require businesses to file seven dif-ferent tax returns every month, needing 45 person-days on average to complete. Stringent labour regulations severely constrain flexible access to human resources. Finally, weak infrastructure creates important additional costs: it takes two weeks on average to obtain an electricity connection, and firms lose about 6% of their sales as a result of power outages (LPEM-UI 2005).
Major Legislation: The New Investment Law
In the past few months the government has been working on a number of laws aimed at mitigating some of the regulatory constraints, but few concrete actions have been taken and several issues within the laws remain controversial. The keystone legislation is the investment law. The new administration quickly decided to rewrite the existing draft (already under preparation for two years) to ensure a more genuine transition from a focus on approval to one on registration. At the time of writing, the law still awaited submission to parliament. The deci-sion on such a fundamental change of approach has proven harder to implement than expected. Only in late August did the likely final shape of the legislation become clearer, when the president presented the main principles of the new draft law to the business community (GOI 2005a), putting an end to several weeks of speculation about its direction after some apparent disagreements between the Ministry of Trade (formally in charge of drafting the law) and the Investment Coordination Board (BKPM). The success of the law in achieving the objectives set out by the president will depend very much, however, on the implementing regulations.
The new law aims to unify Law 1/1967 on Foreign Investment and Law 6/1968 on Domestic Investment, providing equal treatment to all investors regardless of their country of origin. It represents a shift away from a highly con-trolled approval regime to a more responsive registration process. Currently for-eign investors have to go through a lengthy and non-transparent approval process that takes an average of seven weeks; investors’ applications are rejected twice on average before gaining approval. Under the new law, investments would no longer be pre-approved, but evaluated against a clear and publicly available negative list of prohibited investments specified in as yet unavailable accompanying regulations.
The law would eliminate the approval power of BKPM, whose role would be redefined. It is envisaged that BKPM would be responsible for coordinating the implementation of national and regional investment policies, formulating norms and standards and promoting investment opportunities. BKPM’s role has been perhaps the most contentious issue in the legislation. The most recent debate has been about whether it should be limited to the functions described above, leav-ing specific licensleav-ing (in relation to environmental safeguards and land-use plan-ning, for example) to other ministries or local governments, or whether it should
7Current business registration procedures are governed mainly by the Company Law of
1995 and the Business Registration Law of 1982, and various decrees on their implemen-tation.
become a central ‘one-stop shop’. Some observers fear that the ‘one-stop’ approach, while superficially appealing, risks undermining the desired shift from an approval to a registration culture, and implicitly reversing the transformation of BKPM into a true investment promotion agency.
The draft law also provides the basis for simplifying and streamlining the company registration process. In his address to the foreign business community the president vowed to reduce registration time to a maximum of 30 days (GOI 2005a). At the time of writing, it remains unclear how this will be done, and whether the government will find the necessary political support in the various ministries affected. Business groups and donor agencies have suggested spe-cific cuts to procedures and documentation requirements, and have recom-mended imposing a ‘silence is consent’ rule, whereby once the deadline to process the application has passed the business is automatically registered. Other suggestions under discussion include lowering registration fees, restrict-ing the involvement of public notaries and eliminatrestrict-ing minimum capital requirements. Indonesia’s minimum capital requirements impose significant obstacles on would-be entrepreneurs and informal sector firms wanting to for-malise their operations. Many countries in East Asia—Malaysia, Singapore, Thailand and Vietnam, for example—impose no such capital requirement (FIAS 2005).
Reducing both the time needed to complete registration procedures and the costs they impose will have a significant impact on foreign and, perhaps more importantly, domestic firms.7A study of regulation of entry in 85 countries
sug-gests that countries that regulate the entry of new firms more heavily tend to have higher corruption and larger unofficial economies, but not better quality of public or private goods (Djankov et al. 2002). Recognising this, some local govern-ments have started experimenting with ‘one-stop shops’ (OSS) for the establish-ment of new firms. These institutions aim to centralise registration and licensing procedures under one roof. If implemented well, OSS have been shown to have a positive impact on the business environment, and especially on SMEs (ADB and TAF 2005).
Major Tax Changes
In late August the government submitted revisions to three tax laws to the State Secretariat: General Taxation Arrangements and Procedures (Law 16/2000), Income Tax (Law 17/2000), and VAT and Luxury Tax (Law 18/2000). The goal is to make the taxation system more business friendly, and to broaden the tax base in the medium term. The revised laws introduce a simpler tax rate structure and improved tax administration—in particular, for VAT refunds. The top personal income marginal tax rate is set at 35%, and will be reduced to 33% in 2007 and 25% in 2010. The maximum individual income exempt from tax will be raised from Rp 2.88 trillion to Rp 12 trillion. The present multiple corporate income tax rates will be unified at 30% in 2006 and further reduced to 28% in 2007 and 25%
in 2010. Importantly, the income tax law also introduces an amnesty under which taxpayers will be allowed to revise their previous tax statements so as to report their true earnings from the 2001 fiscal year until 2005, without having to pay penalties or face criminal charges for previous under-reporting. Successful imple-mentation of the law will, however, hinge on significant improvements in admin-istration capacity.
While most of the provisions in the revised laws have been supported by the business community—indeed, the chamber of commerce (Kadin) and the interna-tional business community were part of the initial design team—there is one major area in which disagreement remains intense. This relates to the increased power given to the tax department. Concern is strong that the revisions will make relations between taxpayer and tax collector even more asymmetrical than in the past, with power being shifted further to the latter, which is perceived to be cor-rupt and predatory. The business community, led by Kadin, has launched a major lobbying campaign within parliament to rewrite these sections. The largest party, Golkar, appears supportive of this business position, and it is now possible that the revisions will not be passed until 2007 (JP, 22/10/2005).
Taxation by local authorities also remains a major business concern, owing to the multiplicity of local taxes and charges, and the associated complexity and uncertainty, that have arisen since decentralisation. Local licensing requirements are a particular source of disquiet: fees have been introduced for licences that were previously provided without charge, and new licensing requirements (usu-ally for specific sectors) are being introduced where previously there were none. In a survey of local government officials, 75% said that licences were the main source of local revenue (pendapatan asli daerah, PAD) in their area (ADB and TAF 2005). These findings were confirmed by Henderson and Kuncoro (2004), who found a significant relationship between increased regulations and levies on the one hand and fiscal constraints faced by the local governments in question on the other.
Some of the fiscal constraints spurring excessive local taxation have been addressed in the revised decentralisation laws (Soesastro and Atje 2005), but the government is now also revising Law 34/2000 to clarify further the permissible sources of local tax revenue. Law 34/2000 authorised local governments to create their own taxation instruments, and stipulated procedures to allow the central government to review or rescind problematic regulations, but the central review mechanism has been largely ineffective (Ray 2003: 261–2). Moreover, the law did not allow local governments to apply taxes to the same tax bases as the central government. This restriction has kept them away from potentially high-yield taxes and those with lower compliance and administration costs. As a conse-quence, most of the new taxes have very low revenue yields, and many have cre-ated extraordinarily high compliance and transaction costs for local businesses, thus contributing to an anti-business climate at the local level. The draft revision of Law 34/2000 intends to address these problems by introducing a closed list of taxes and user fees that can be imposed locally, with specified maximum levels. Local governments would also be given more tax autonomy—for example, through introduction of a surtax, allowing local governments to collect an addi-tional 30% of the amount generated by the current central government property tax (Martinez-Vasquez 2005).
8McLeod (2005: 145–6) highlights government pricing policy as the core explanation for
the lack of private sector interest. Unless prices are raised to profitable levels, private investors will not be interested to participate in infrastructure.
9Road Law 38/2004 (and regulation 15/2005), Water Resources Law 7/2004 (and
regula-tion 16/2005) and laws on maritime, railway, aviaregula-tion and road transport are being drafted.
Addressing the Looming Infrastructure Crisis: Progress since the Summit The infrastructure summit in January 2005 highlighted the huge need for invest-ment in infrastructure if growth is not to be stunted. A major blackout in August, which led to factories and workshops closing for seven hours throughout Java, was a reminder of how little safety margin there is for accommodating even mild shocks to the system.
Attracting private investors is a core part of the government’s infrastructure strategy. The required infrastructure investment to sustain a 6% annual rate of economic growth was estimated at the summit to be approximately $20 billion annually. By contrast, the available state budget resources available for capital expenditure on infrastructure were estimated at just $4 billion. Thus Indonesia will need to raise $4 of third-party funding (from donors and the private sector) for each $1 of public money.
At the summit, 91 infrastructure projects were offered to private investors. In August the government requested bids on the first six (of 38) toll road projects. Two of these received no bids at all, one received one bid, and the remaining three received two bids each. These poor results illustrate the necessity for proj-ects to be prepared with much more attention to an investor’s need to reap returns commensurate with risk. In the case of toll roads, issues related to land acquisition, the setting of toll fees8 and the extent of government guarantees
pro-vided by the finance ministry all need to be thought through very carefully. There is recognition of this, and some progress has already been made. For example, Presidential Regulation 36/2005 on eminent domain (the power of the state to appropriate property for public use) was passed in May (McLeod 2005: 146–7).
To move forward, progress is urgently required in four areas.
Regulatory Framework. Success in private–public partnerships in infrastructure is still seriously hampered by the lack of a modern regulatory framework. Key laws related to roads, water and sanitation have been issued, but most are not yet fully operational due to slowness to finalise the implementing regulations, and to establish and staff the related institutional structure.9The single biggest set-back
has been the annulment by the Constitutional Court of the new electricity law in December 2004 (Soesastro and Atje 2005: 28–9).
A key element in most of these laws, as part of the effort to ensure fairness and create a more attractive climate for private investment, has been the establish-ment of a number of regulatory agencies. In late June the Ministry of Public Works established a Toll Road Regulatory Agency (BPJT) responsible for regulat-ing and supervisregulat-ing the provision of toll roads. A similar agency was set up in the water supply sector, although in contrast to BPJT this agency is much more an advisory board than a truly independent regulator. Both agencies represent an
important trend towards removing regulatory functions from state-owned enter-prises, such as the toll road operator PT Jasa Marga, and moving them into line ministries or independent regulatory bodies. This step is essential to eliminating conflicts of interest and creating a more level playing field for state and private enterprises.
Risk Management. Most investors are requesting some form of public guaran-tee to mitigate the risks associated with government policies. At the January sum-mit the government indicated that it would be willing to consider providing partial guarantees against policy risk, while leaving commercial risks to be borne by private investors. At the time of writing, however, no clear framework for pro-viding guarantees had emerged, prompting a wait-and-see attitude on the part of potential investors. The fact that some infrastructure investments from Chinese companies appear likely to proceed without any government comfort may have reduced the sense of urgency about developing a risk management policy. It is unlikely that many other investors will have the same appetite for risk, however. Coordination. A third factor holding back private sector participation in infra-structure has been weak central coordination. So far the process of project prepa-ration and execution has been decentralised among various line ministries, and has involved little coordination among key core ministries on issues such as risk sharing and land acquisition, resulting in promising projects being delayed. In response to this problem the government has significantly increased the powers of the inter-ministerial National Committee for the Acceleration of Infrastructure Provision (KKPPI) in the past few months. Chaired by the economics coordinat-ing minister and managed by the planncoordinat-ing minister, KKPPI reports directly to the president, and is empowered to make policy and investment decisions rather than just facilitating them.
High-profile Disputes. Private sector confidence is also influenced by develop-ments in high-profile disputes such as that between Pertamina and ExxonMobil over the Cepu oil field in Central Java, one of the largest known undeveloped fields in Indonesia. ExxonMobil discovered major new reserves under its existing Cepu field several years ago, but exploitation of the find required an extension of its contract beyond 2010. Pertamina had refused the extension, asserting that it would develop the field itself when it regained control after 2010. The ensuing dispute went on for nearly three years, becoming a potent symbol of Indonesia’s unfriendly environment for foreign investment. The two parties reached an agreement in principle on resolution of the issue in early July, and signed a 30-year product-sharing contract to develop the Cepu block in September (JP, 14/9/2005).
Other high-profile cases remain unresolved, notwithstanding the new govern-ment’s promises to address them. Despite a great deal of activity, neither the Karaha Bodas case (a dispute over compensation for sunk investment in a geo-thermal plant that the government cancelled at the outset of the 1997–98 crisis) nor the Cemex–Semen Gresik case (in which local authorities blocked Cemex from exercising its option to purchase a controlling interest in the cement pro-ducer from the central government) has been resolved.At the same time, the civil and criminal trials of PT Newmont Minahasa Raya and its chief executive (for alleged toxic pollution of the sea off North Sulawesi) are still proceeding through the court system, watched closely by other large investors.
10The survey reports a decline in corruption from 10.8% in 2001 to 6.4% recently. Even
though these results need to be treated with considerable caution because of differences in sample characteristics, further research by LPEM in collaboration with the National Bureau of Economic Research (NBER) using more comparable samples has confirmed the downward trend.
11Indonesia’s score increased from 1.9 in 2001 to 2.2 in 2005; <http://www.ICGG.org>.
ANTI-CORRUPTION INVESTIGATIONS AND THE NEW JUDICIAL COMMISSION
Addressing corruption was a centrepiece of SBY’s election campaign. By end-August the Corruption Eradication Commission (KPK) and the newly estab-lished Team for Eliminating Crimes of Corruption (Tipikor) had handled 25 cases, while the attorney general’s office had submitted 233 cases to the district courts, several of which were high profile and politically sensitive (GOI 2005b). These cases illustrate the government’s belief that demonstrating an ability to put well-connected people behind bars is an important element in breaking down the overall culture of corruption.
According to anti-corruption activists, the public shaming and arrests of sus-pects are starting to have some effect. They and donor agencies have noted that there is now a greater cautiousness on the part of government officials. Prelimi-nary data from the LPEM survey in May also indicate that informal payments by firms to government officials, particularly at the local level, seem to be lower than in the first years of decentralisation (LPEM–UI 2005).10A more stringent
anti-cor-ruption drive, combined with increased inter-regional competition to attract investors, is probably influencing these trends. Recent data from Transparency International also show a slight absolute improvement in the Corruption Percep-tions Index since 2001, although Indonesia remains one of the more corrupt coun-tries in the world.11
It is far too early to tell whether these early signs are indicative of a long-term change. Much will depend on whether the high-profile investigations can be matched by deeper and broader institutional reforms encompassing the civil service, the judiciary and the law enforcement apparatus, but the government has yet to give its full attention to these important areas.
Corruption of judges remains a particularly insidious phenomenon, because its presence makes dealing with all forms of corruption more difficult. In June, for example, former Aceh governor Abdullah Puteh’s lawyer was caught red-handed trying to bribe a Jakarta High Court clerk to influence an appeal on the court’s ruling against Puteh, who had been sentenced to 10 years in jail for misappropri-ating state funds (Suid 2005).
A hopeful sign is the long-awaited establishment of the Judicial Commission in August. The commission has been given a mandate to monitor the perform-ance of Indonesia’s courts and judges, and to advise on Supreme Court appoint-ments. It will draft a code of conduct for judges and develop a database on them, to be used as a monitoring system. However the power the commission has been given falls somewhat short of expectations. For example, it has authority only to advise the Supreme Court on punishments, not to impose them, and it has no authority to annul verdicts influenced by corrupt practices, a responsibility that will continue to rest with the Supreme Court. With its powers curtailed, much
12Transport prices increased by 23.8% and food prices by 28.2% in the first eight months
of 2005.
will depend on the authority and integrity of its members. There are also con-cerns about implementation, and about exactly how the new commission will uphold discipline. Its first test involves scrutinising five judges of the West Java High Court in relation to a controversial decision to overturn the outcome of the district-head election for the Jakarta suburb of Depok (Baskoro et al. 2005).
RECONSTRUCTION AND PEACE IN ACEH
Over the past 10 months Aceh has begun to be transformed slowly from a scene of tragic devastation to the largest mass building site in the world. A total of $2.9 billion has already been programmed for reconstruction, and another $773 mil-lion for broader development programs. The total reconstruction program is pro-jected to amount to $7.5–9 billion over a five-year period (BRR and World Bank 2005). Millions of families all over the world have given cash for the rebuilding of Aceh, many of whom had never given to charity before. Because of this unprecedented outpouring of generosity, there is likely to be intense international scrutiny of the recovery effort. As the first anniversary of the disaster approaches, there is great concern that progress will be regarded as inadequate.
Further and more rapid progress in reconstruction is essential to revitalise the local economy. While the negative impact on the growth rate of the country as a whole is estimated to be no more than 0.2% in 2005, the local impact is much more substantial. The economy is predicted to contract by 14%, and an additional 600,000 people are likely to fall into poverty. Unemployment in Aceh is well above the national average, and rapidly rising prices are of serious concern (BRR and World Bank 2005).12
When former US president Bill Clinton (UN Secretary General Kofi Annan’s Special Envoy for the Tsunami) visited Aceh in late May he noted that there were two reasons why Indonesia’s approach to post-tsunami reconstruction may be more effective than that of the other affected countries. First, Indonesia has agreed upon a clear set of principles to guide the reconstruction, emphasising Acehnese-led and community-driven approaches. Second, unlike the other coun-tries, Indonesia has set up a special Rehabilitation and Reconstruction Agency (the BRR, or Badan Rehabilitasi dan Rekonstruksi) to coordinate the work of all agencies and donors involved in Aceh.
These are indeed potential strengths. Despite early fears of a top-down, Jakarta-driven reconstruction strategy (Athukorala and Resosudarmo forthcom-ing), the government adopted an approach that gives communities pride of place in decision making about where, how and by whom houses and other buildings are to be reconstructed. Early plans called for tough land-use zoning, mandatory set-back from the sea, relocation of central business districts and so on, but these were abandoned after it was recognised that the citizens directly affected were better equipped to make such judgments than bureaucrats in Jakarta. This deci-sion made good sense, substantively and politically.
The establishment of the BRR was also an important achievement, enabling the president to demonstrate a concern for transparency and avoiding corruption, as
13Of these 6,000 are temporary and 4,000 permanent (BRR and World Bank 2005). 14Donors under the Multi Donor Trust Fund (MDTF) agreed to finance the issuing of land
titles, but regulations to endorse this ‘free’ issue of titles had yet to be issued by the Min-istry of Finance at the time of writing.
well as for efficiency. As director of the BRR he appointed Kuntoro Mangkusub-roto, a former mines and energy minister with a reputation for toughness and honesty. He was given cabinet rank and a free hand in hiring staff and setting salaries. Kuntoro has recruited a team of seven deputies, most of whom are regarded as imaginative and strong. He has required all staff to sign integrity pacts, and has created an anti-corruption division. The president also established an independent Oversight Board (Dewan Pengawas), consisting of prominent Indonesians (half of them Acehnese) to monitor and evaluate the activities of the BRR and handle complaints about the reconstruction effort.
Both of these strengths are also responsible for delays, however. It has taken time to reassemble the communities devastated by the tsunami, and to seek their views as to the direction they would like the recovery effort to take. As a result, by the end of September about 10,000 houses had been rebuilt,13whereas more
than 100,000 are needed. Community-driven mapping of who owned which land parcel (almost all land ownership records having been destroyed) has been com-pleted in just 200 (of 680) villages. Moreover, the regulation for the free issuing of land titles has been long delayed.14
Setting up the BRR and making it operational also caused some delay. While most experts believe that the BRR will ultimately result in greater effectiveness, it was not able to be formally established until May, and staffing it with new recruits rather than individuals seconded from the bureaucracy has led to further delays. An unexpected problem is that establishment of the BRR, its recruitment of staff outside normal civil service processes, and its decision to pay salaries well above those in the civil service have caused line ministries such as public works to feel marginalised and disinclined to work hard.
At the time of writing there were 125 international and 430 local NGOs work-ing in Aceh (BRR and World Bank 2005). The top 10 of these control well over $1 billion in funds. The Red Cross alone has over $600 million to spend in Aceh— twice the amount for any previous natural disaster. These agencies have been the champions of the first phase of rehabilitation, working at maximum pace to rebuild schools, clinics, houses and livelihoods. The official bilateral donors, sub-ject to many more restrictions, are next in line. Many of these only received autho-risation from their own parliaments for the expenditure of reconstruction funds—as opposed to relief funds—in the middle of the year, and did not begin to break ground until the August–October period.
Some donors (such as the US, Australia and certain UN agencies) execute their own projects, giving them an advantage in avoiding the delays associated with government bureaucracy. Others (Japan, some European countries, and the multilateral agencies such as the World Bank and the Asian Development Bank) prefer to work through the government’s slower moving budgetary systems on the grounds that this promotes ownership and capacity-building. Unfortunately, the tsunami happened to coincide almost precisely with the introduction of an entirely new system of budget processes on 1 January 2005. While these will