1
USAID KINERJA
FROM THE AMERICAN PEOPLE IMPROVING PUBLIC SERVICES
REPORT ON ANALYSIS OF REGIONAL BUDGETS 2008-2011
Findings of a Study of Local Budget Management in 20 Kabupatens and Cities
Participating in the
Kinerja
Program
Seknas FITRA The Asia Foundation
Jakarta May 2012
2
Table of Contents
TABLE OF CONTENTS ... 2
GLOSSARY OF TERMS AND ABBREVIATIONS ... 4
LIST OF TABLES ... 6
LIST OF GRAPHS ... 7
1. PREFACE ... 9
1.1INTRODUCTION ... 9
1.2RESEARCH OBJECTIVES ... 9
1.3RESEARCH BENEFITS ... 9
1.4RESEARCH METHODOLOGY ... 10
a. Scope of Analysis ... 10
b. Mothods of Data Collection and Analysis ... 11
2. LOCAL BUDGET INCOME ... 13
2.1OVERVIEW OF LOCAL GOVERNMENT BUDGET INCOME ... 13
2.2COMPOSITION OF LOCAL GOVERNMENT INCOME ... 14
2.3REGIONAL FISCAL BALANCE FUNDING (DANA PERIMBANGAN) ... 15
2.4OTHER LAWFUL LOCAL INCOME ... 17
2.5OWN-SOURCE LOCAL REVENUE ... 19
3. LOCAL BUDGET EXPENDITURE ... 21
3.1OVERVIEW OF LOCAL GOVERNMENT BUDGET EXPENDITURE ... 22
3.2ANALYSIS OF COMPOSITION OF LOCAL BUDGET EXPENDITURE ... 23
3.3ANALYSIS OF CIVIL SERVICE EXPENDITURE... 23
3.4ANALYSIS OF EXPENDITURE ON SOCIAL AID AND GRANTS ... 25
4. LOCAL BUDGET FINANCING ... 26
4.1FISCAL SPACE ... 26
4.2BUDGET SURPLUSES/DEFICITS ... 27
4.3BUDGET FINANCING ... 28
5. ANALYSIS OF LOCAL BUDGET PLANNING, REVISION AND REALIZATION ... 31
5.1ANALYSIS OF PLANNING AND REVISION OF LOCAL BUDGET INCOME ... 31
5.2ANALYSIS OF PLANNING AND REVISION OF LOCAL BUDGET EXPENDITURE ... 34
6. ANALYSIS OF EDUCATION-RELATED BUDGETS ... ..37
6.1GENERAL ANALYSIS OF EXPENDITURE ON EDUCATION ... 37
6.2ANALYSIS OF COMPONENTS OF EDUCATION EXPENDITURE AND PUPIL/TEACHER RATIOS ... 39
6.3ANALYSIS OF EXPENDITURE ON EDUCATIONAL PROGRAMS ... 40
6.4ANALYSIS OF EXPENDITURE ON THE 9YEARS OF OBLIGATORY EDUCATION PROGRAM ... 41
6.5ANALYSIS OF PLANNED BUDGETS AND REALIZED BUDGET EXPENDITURE OF SCHOOLS ... 42
7. ANALYSIS OF HEALTH BUDGETS ... 45
7.1ANALYSIS OF EXPENDITURE ON HEALTH ... 45
3
8. ANALYSIS OF BUDGETS FOR PUBLIC WORKS ... 51
8.1ANALYSIS OF EXPENDITURE ON PUBLIC WORKS ... 51
8.2ANALYSIS OF PUBLIC WORKS EXPENDITURE BY ECONOMIC CATEGORY ... 52
8.3ANALYSIS OF EXPENDITURE ON ROADS AND BRIDGES ... 53
4
Glossary of Terms and Abbreviations
AAD Analasis Anggaran Daerah—analysis of local budgets
Adjustment funds Dana penyesuaian—a form of fiscal transfer from the Center to regions: a source of ―other local own -source revenue‖ (LPDS)
APBD Angga ra n Penda pa ta n dan Belanja Da er ah—local government budget as approved by DPRD
APBD-M Angga ra n Penda pa ta n dan Belanja Da er ah-Mur ni—(unaltered) original local government budget as approved by DPRD and not yet revised: same as APBD
APBD-P Angga ran Pendapatan dan Belanja Daerah-Peruba han—(mid-year) revised local government budget as approved by DPRD
APBD-R Angga ran Pendapatan dan Belanja Daerah -Realisa si—realized local government budget (end-of-year
local budget outcomes)
APBN An g g a r a n P en d a p a ta n d a n Bel a n ja Neg a r a—State budget as approved by parliament (DPR) AP M An g ka P a r ti sip a si Mu r n i—net enrollment ra tio, indicating the nu mber of school
children stu dying at edu cation levels corresponding to their a ge. APS An g ka P a r ti sip a si Seko la h—school participation rate
Da na perimba nga n Fisca l ba la nce tra nsfers from the Center to local governm ents in regions to redu ce fiscal imbala nces betwee n the Center a nd regions a nd a mong regions
D ek onsentra si the delega tion of au thority (a nd fu nds) from the Center to a regiona l governme nt or a centra l government officia l stationed in a region to perfor m a not yet decentra lized fu nction
Direct expenditure Belanja langsung (BL): also known as ―development expenditure‖: costs incurred by a work unit in implementing a specific program or activity (cf. indirect expenditure)
DISP Dana Infrastruktur Sarana dan Prasarana—Fund for Infrastructure and Public Facilities, a dana
penyesuaian program
DJ PK D i r ekt o r a l -Jendral Perimbangan Keuangan—D-G of Regional Fiscal Balance (Ministry of Finance) DPD Dewan Per wakilan Daerah—Regional Representative Council, the 2nd (―upper‖) chamber of Indonesia’s
bicameral Parliament
DPDF PPD Dana Penguatan Desentralisasi Fiskal Percepatan Pembangunan Daerah—Fund to Strengthen Fiscal Decentralization to Speed up Regional Development, a dana penyesuaian program
DPID Dana Infrastruktur Daerah—Fund for the Strengthening of Local Infrastructure, a dana penyesuaian
program
DPIP Dana Percepatan Infrastruktur Pendidika n—Fund to Speed up Development of Educational Infrastructure, a
dana penyesuaian program
DPIPD Dana Penguatan Infrastruktur dan Prasarana Daerah—Fund to Strengthen Local Infrastructure and Public
Facilities, a dana penyesuaian program
D PR D e wa n P er wa kil a n Ra kya t—the H ou se of Representatives (Indonesia’s national legisla ture)
D PRD Dewa n Per wa kilan Ra kya t Da era h—regional representative assembly: the legislative wing of government at the provincial, kabupaten and city level
FG D Focus group discussion
Fiscal Index See footnote No. 1 p. 17 of text for explanation of how this is calculated
Fiscal space a government’s degree of spending discretion (see page 26)
FoI Freedo m of information
G D P Gross D om estic Produ ct
5
H DI Hu ma n D evelopment Index
Indirect expenditu re Belanja tidak langsung (BTL): also termed ―routine expenditure‖: common costs incurred by a work unit in implementing the whole gamut of its programs (cf. direct expenditure)
IPKM In d eks P e mb a n g u n a n Keseh a ta n Ma sya r a ka t—Co m mu nity H ea lth D evelop ment Index
Ka bu paten One of three terms for sub-national governments in Indonesia, the other two being provinces and cities
Kecamatan sub-district: units of government administration that constitute kabupatens and cities
KIBBLA Keseha ta n Ibu, Ba yi Ba ru La hir dan Ana k—maternal, newborn and child health
KiPAD Kiner ja Pengelola an Anggar an Daera h—local government budget performance
Kota City: one of three terms for sub-national governments in Indonesia, the other two being provinces and
kabupatens
LBA Local Budget Analysis
LBI Local Budget Index
LBS Local Budgets Study
Local government Pemer intah daer ah—any sub-national government (provincial, kabupaten or city)
LKPD Laporan Keuangan Pemerintah Daerah—report on local government finances (issued by the national
Audit Board (BPK))
LPDS Lain Pendapatan Daerah yang Sah—other lawful local revenue
MoF Indonesian Ministry of Finance
Otsus Otonomi khusus—special autonomy
PAD Pendapatan Asli Daerah—local own-source revenue
PDDA Pembangunan Daerah Dalam Angka: Regional Development in Figures (a government publication)
PDRB Produk Domestik Regional Bruto—regional gross domestic product
PMK Peraturan Menteri Keuangan—regulation issued by the Minister of Finance
RAPBS Renca na Angga r a n P enda pa ta n da n Bela n ja Sekola h—school budget
Region any sub-national government area (province, kabupaten and city) in Indonesia
SiKPA Sisa Kekura ngan Penggunaa n Anggar an—overall budget deficit
SiLPA Sisa Lebih Pengguna an Angga r an—overall budget surplus carried forward to next fiscal year
TAF The Asia Foundation
TNP2K Tim Na siona l Percepa ta n Pena nggula ngan Kemiskinan—National Team for Accelerating Poverty
Reduction
6
List of Tables
Table 1.1 General Statistical Data on Regions Studied……….10
Table 1.2 Data Used and Its Sources……….11
Table 2.1 Total DAK Allocations by Program Area to 20 Kinerja Regions, 2008-11 (Rp Million,
Based on Current Prices) …..………. 16
Table 4.1 Surpluses/Deficits as a Proportion of Local Budget Income, 2008-2011……….. 28
Table 4.2 Receipt and Repayment of Borrowings in Five Kinerja Regions Studied,
2008-2011 (Rp Million)………. ……….. 29
Table 4.3 Regions with Overall Budget Deficits Carried Forward (SiKPA)………. 29
Table 4.4 Summary of Local Budgets of Simeulue, 2008-2011 (Rp Million)………. 30
7
List of Graphs
Graph 2.1 Average Per Capita Local Budget Income, 2008-2011 (Rp million/person/year, Based on Constant 2008 Prices)………...13 GRAPH 2.2HIGHEST AND LOWEST LEVELS OF REAL INCOME GROWTH IN KINERJA REGIONS STUDIED,2008-11. 14
GRAPH 2.3AVERAGE COMPOSITION OF INCOME IN 20KINERJ A REGIONS,2008-2011 ... ….….. 14 GRAPH 2.4AVERAGE COMPOSITION OF LOCAL INCOME IN 20KINERJA REGIONS,2008-2011 ...15
Graph 2.5 Average Per Capita Transfers of DAU to 20 Kinerja Regions, 2008 dan 2011 (Constant 2008 Prices) 15
Graph 2.6 Comparison of Regions’ Level of Central Government Transfers Per Capita (2008-2011, at Constant 2008 Prices) and Their 2009 Human Development Indices (HDIs) ... 17
Graph 2.7 ―Adjustment‖ and Special Autonomy (Otsus) Funding Compared to DAK Transfers (2008 and 2010) & as a Proportion of Total Budget Income (2010) in 20 Regions Studied 18
Graph 2.8 Shared Provincial Taxation Revenue as a Proportion of Local Budget Income,2008-2011 (%) 19
GRAPH 2.9AVERAGE PAD/PERSON/YEAR,2008-2011(RP MILLION,CONSTANT 2008PRICES) ... …….. 199
and Revised Budget (APBD-P) Targets in Nine Kinerja Regions Studied, 2008-2010 ………. 33
GRAPH 5.4ACTUAL END-OF-YEAR (APBD-R)EXPENDITURE COMPARED TO ORIGINAL BUDGET (APBD-M) AND
REVISED BUDGET (APBD-P)EXPENDITURE TARGETS IN 20KINERJA REGIONS,2008-2010 ... 35
GRAPH 5.5ACTUAL END-OF-YEAR (APBD-R)CAPITAL EXPENDITURE COMPARED TO ORIGINAL BUDGET
(APBD-M) AND REVISED BUDGET (APBD-P)EXPENDITURE TARGETS IN 20KINERJA REGIONS,2010 ... 36
GRAPH 6.1SPENDING ON EDUCATION AS A PROPORTION OF LOCAL EXPENDITURE,2008-2011 ... 37 Graph 6.2 Average Education Allocations per Child in School Aged 7-18 in Regions Studied, 2008-2011 (Rp
Million/Child) ……… 38
Graph 6.3 Average Contributions of DAK and ―Adjustment‖ Funding to Educational Expenditure, 2009-2010 38
GRAPH 6.4INDIRECT EXPENDITURE AS A PROPORTION OF TOTAL EDUCATION BUDGET (2008-11)&PUPIL/TEACHER
(PERMANENT)RATIOS IN STATE ELEMENTARY SCHOOLS (SDN)&STATE JUNIOR SECONDARY SCHOOLS
8
GRAPH 6.6EXPENDITURE PER PUPIL ON 9YEARS OF OBLIGATORY EDUCATION PROGRAM COMPARED TO
NET JUNIOR STATE SECONDARY SCHOOL PARTICIPATION RATES (2010) ... 41 GRAPH 6.7CONTRIBUTIONS PER STATE PRIMARY SCHOOL (SDN) AND STATE JUNIOR SECONDARY (SMPN) TO
THE 9YEARS OF OBLIGATORY EDUCATION PROGRAM COMPARED TO PUPIL/CLASSROOM RATIOS IN SDNS AND SMPNS,(2008-09) ... 42 GRAPH 6.8 COMPONENTS OF INCOME OF 15PRIMARY SCHOOLS (SND) IN THREE KABUPATENS IN WEST
KALIMANTAN,2011(%) ...422 Graph 6.9 School Income and Expenditure (excl. Civil Service Salaries) in 15 Schools in 3 Kabupatens in West
Kalimantan, 2011 (Rp Million/Pupil; Current Prices) ………. 443
GRAPH 6.10 COMPONENTS OF NON-SALARY SCHOOL INCOME IN 15SCHOOLS IN 3KABUPATENS IN
WEST KALIMANTAN,2011,CURRENT PRICES (%) ... 44
GRAPH 7.1PROPORTION OF PROPOSED EXPENDITURE IN ORIGINAL BUDGET (APBD-MS)EARMARKED FOR
HEALTH PROGRAMS,2008-11(%) ... 45 Graph 7.2 Average Expenditure/Person on Health (2008-2011) Compared to 2009 Community Health
Development Indices 46
Graph 7.3 Average Proportion of Direct and Indirect Expenditure, Original Budgets (APBD-Ms) 2008-2011 47 Graph 7.4 Expenditure per Capita on KIBBLA and KIBBLA Expenditure as Proportion of Total Spending on
Health, 2011 (current 2011 prices) 49
GRAPH 7.5 PROPORTION OF MEDICALLY ASSISTED BIRTHS COMPARED TO DEATH RATES OF NEWBORNS ... 50 GRAPH 8.1 BUDGET ALLOCATIONS ON PUBLIC WORKS AS A PROPORTION OF TOTAL LOCAL GOVERNMENT
EXPENDITURE,2008-2011 ... 51 Graph 8.2 Average Public Works Allocations per Geographic Area (Rp/Km²), 2008-2011 (Constant 2008
Prices)………...52
GRAPH 8.3 PUBLIC WORKS EXPENDITURE BY CATEGORY OF ACTIVITY,2008-2011 ... 53 GRAPH 8.4 LEVEL OF MOBILITY AND ROAD CONNECTIVITY … ... 53 Grafik 8.5 Graph 8.5 Average Allocations for Roads/Bridges per Road Length and Allocations for Road
Development as a Proportion Total Budgets for Roads/Bridges, 2008-2011 (Constant 2008 Prices)…… 54
Graph 8.6 Average Allocation of Funding for Road/Bridge Development (2008-11, Constant 2008 Prices), and
Length of Unsealed Roads (in kms)……………. 55
Graph 8.7 Average Allocations for Road Rehabilitation and Maintenance per Unit of Damaged Road, 2008-11
9
1.
Preface
1.1
Introduction
Budgets are instruments used by government to implement policies and action programs. The essential aims of decentralization in Indonesia are to bring the delivery of public services closer to the people, and to stimulate regional economic development more in accord with local conditions. Budgets translate government policies and plans into programs and activities; they also reflect the extent to which a particular local government provides for—or fails to provide for—local economic growth and more effective delivery of public services attuned to the needs of the poor and—via gender-sensitive
budgeting—of women.
The National Secretariat, Indonesian F orum for Budget Transparency (Seknas F ITRA), in
cooperation with local civil society organizations (CSOs) and The Asia F oundation (TAF ), has already completed two studies of local budgets. This third study was undertaken under the aegis of the Kinerja
program (funded by USAID)—part of a consortium led by Research Triangle Institute (RTI) International. The hope is that this study will provide basic data before implementation of the consortium’s program. The Local Budgets Study (LBS) project has two components:
(i) Local Budget Management Performance (KiPADfor short), also known as the Local
Budget Index (LBI): This is a study of the extent to which local governments applied
principles of good governance—transparency, participation, accountability and gender
equality—in their management of four key parts of the budget cycle—planning, framing
& adoption, implementation and accountability.
(ii) Analyses of Local Budgets (AAD for short), also known as Local Budget Analysis (LBA):
This part of the study assesses how efficiently and effectively local budgetary policies respond to people’s needs.
This document only presents the findings of the AAD study. KiPAD is the subject of a separate report.
1.2
Research Objectives
The aims of the AAD study were:
1. To identify general trends and policy frameworks of local budget income, expenditure and
financing; and to compare original budgets to mid-year revised budgets and end-of-year budget outcomes;
2. To make a particular study of the effectiveness of budget policies on education, health and public
works;
3. To compare trends in budget policies adopted across regions studied;
4. To provide a snapshot of local government budgeting and what might be done to improve it in
the future.
1.3
Research Benefits
This study will hopefully be of benefit to both central and local governments, as well as CSOs; and will also help Kinerja to sharpen the focus of its assistance programs. But those who stand to benefit most
from AAD—indeed LBS as a whole—are local governments, regional representative councils (DPRDs)
10
will use the report’s findings as a tool for monitoring and evaluating local governments and for helping them to improve budgetary policies. We also hope our study will provide useful information to those
implementing Kinerja programs: particularly those engaged with education, health and climate change
(the Business Enabling Environment (BEE) Program).
1.4
Research Methodology
a. Scope of Analysis
The focus of AAD was a general analysis of overall budgets of kabupatens and cities studied and specific analyses of budgeting for three strategic sectors. The overall analysis looked at patterns and trends evident in budget income, expenditure and financing. Sector-specific analysis focused on expenditure on education, health and public works.
The study covered 20 kabupatens and cities in four provinces participating in Kinerja programs.
Particular kabupatens/cities were chosen at random—within the provinces of Aceh, East Java, West
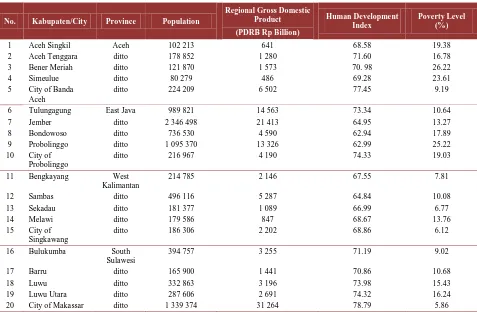
Kalimantan and South Sulawesi—from interested Kinerja participants. Table 1.1 lists the 20 regions
chosen and provides some basic statistical information on them.
Table 1.1 General Statistical Data on Regions Studied
No. Kabupaten/City Province Population
Regional Gross Domestic
Source: Central Bureau of Statistics (BPS) Results of 2010 census and PDRB Statistics 2009)
11
b. Methods of Data Collection and Analysis
Data on APBDs and regional development was collected both at the local level and nationally. In regions, information was brought together via formal freedom of information (FoI) processes (similar to
those used in KiPAD), and informally by local researchers with the help of Kinerja local public service
specialists. To supplement that information, researchers had recourse to the APBD database within the Directorate-General of Regional Fiscal Balance (Ministry of Finance (MoF)) and reports of local
government finances (LKPD for short) done by the national Audit Board (BPK). Information on regional development was gathered from various sources: the Central Bureau of Statistics (BPS); the National
Team for the Acceleration of Poverty Reduction (TNP2K for short); the publication Regional
Development in Figures (PDDA); local governments (provinces, kabupatens and cities); the World Bank;
and relevant central government ministries.
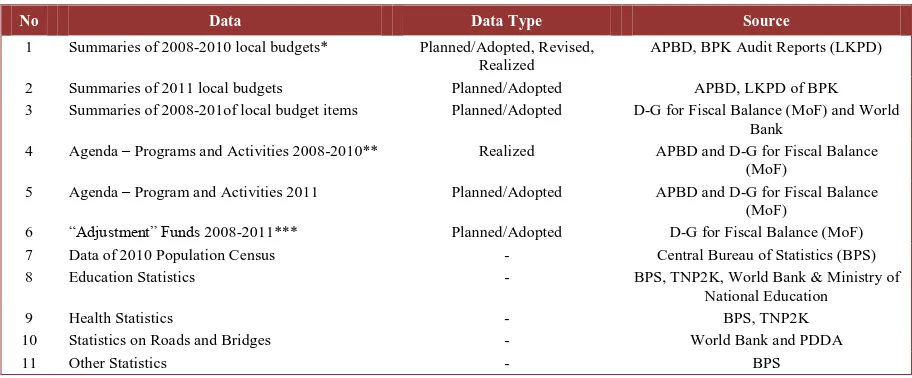
Table 1.2 Data Used and Its Sources
No Data Data Type Source
1 Summaries of 2008-2010 local budgets* Planned/Adopted, Revised, Realized
APBD, BPK Audit Reports (LKPD)
2 Summaries of 2011 local budgets Planned/Adopted APBD, LKPD of BPK
3 Summaries of 2008-201of local budget items Planned/Adopted D-G for Fiscal Balance (MoF) and World Bank
4 Agenda – Programs and Activities 2008-2010** Realized APBD and D-G for Fiscal Balance
(MoF)
5 Agenda – Program and Activities 2011 Planned/Adopted APBD and D-G for Fiscal Balance
(MoF)
6 ―Adjustment‖ Funds 2008-2011*** Planned/Adopted D-G for Fiscal Balance (MoF)
7 Data of 2010 Population Census - Central Bureau of Statistics (BPS)
8 Education Statistics - BPS, TNP2K, World Bank & Ministry of
National Education
9 Health Statistics - BPS, TNP2K
10 Statistics on Roads and Bridges - World Bank and PDDA
11 Other Statistics - BPS
Rema rks:
* 2010 APBD-Ps were not a va ila ble for the city of Ba nda Aceh or Bulukumba ; those for Aceh Tengga ra , Simeulue, Bengka ya ng a nd Sekada u were una ble to be a ccessed.
** APBD-Ms were used in Jember, Bondowoso and Probolinggo.
*** Funds referred to a re: Fund for Infra structure a nd Public Fa cilities, 2008 (Minister of Fina nce Regulation (PMK).81/PMK 07/20 08); Deta ils of Fund to Strengthen Fisca l Decentra liza tion to Speed up Regiona l Development, 2009 and 2010 (PMK 42/PMK 07/2009 a nd PMK 118/PMK 07/201 0); Additiona l Income for Tea chers, 2009 and 2010 (PMK 223/PMK 07/2009 a nd PMK 119/PMK 07/2010); Regiona l Incentives Fund, 2010 a nd 2011 (PMK 198/PMK07/2009 a nd PMK 61/PMK 07/2011); Fund to Strengthen Loca l Infra structure a nd Public Fa cilities, 2010 a nd Fund for Accelera tion of Development of Loca l Infra structure, 2011 (PMK 140/PMK.07/2011; a nd Fund for the Strengthening of Loca l Infr a structure 2011 (PMK 25/PMK07/2011).
12
•Growth and shape of budget income,
expenditure and financing
•Development of education, health
and public works programs Trends
• Relevance to issues faced locally • Emphases in local expenditure Proportions
•Relationship between local expenditure and local development indicators
Corrleations
Analytical techniques used included identification of trends, calculating proportions and establishing correlations, along the lines of the following flow chart.
Researchers analyzed overall budgets, but focused particularly on education, health and public works. The aim of the broad analysis was to gain an overview of trends of budget income, expenditure and financing. Sector-specific analyses honed in on the composition and growth of general expenditure in the sectors concerned. To position each region nationally, regions studied were compared to each other and against national averages. Comparisons were also made between budget data and various development indicators.
13
2.
Local Budget Income
It is important to study local budget income in order to gauge local fiscal capacity to finance budget programs. According to Law No. 33/2004 concerning Fiscal Balance between the Center and Regions
there are three principal sources of local government income:
(i) Regional fiscal balance funding (dana perimbangan in Indonesian) consisting of the General
Allocation Fund (DAU), the Special Allocation Fund (DAK) and the Revenue Sharing Fund (DBH);
(ii) Local own-source revenue (PAD for short) consisting of local taxes, local fees and charges,
revenue from management of locally owned assets and other lawful PAD;
(iii) Other lawful local revenue (LPDS for short) consisting of grants, emergency funding, tax
revenue shared with provinces and other local governments, ―adjustment‖ funding, special autonomy grants, financial aid from provinces and other local governments, and other LPDS.
2.1
Overview of Local Government Budget Income
Levels of per capita budget income in the 20 Kinerja regions studied varied greatly: from very high in the kabupatens and cities in Aceh to low in East Java. All regions studied in Aceh had high average levels of revenue per capita: the kabupaten average was Rp 2.1 million/person/year between 2008 and 2011, with Simeulue leading the others with Rp 3.6 million/person/year over the period. In East Java, by contrast, average revenue levels were low: less than Rp 1 million/person/year; the only exception was the city of Probolinggo (Rp 2 million/person/year).
Graph 2.1 Average Per Capita Local Budget Income, 2008-2011 (Rp million/person/year, Based on Constant 2008 Prices)
Source: ABPD-Rs 2008-2010, APBD-Ms 2011 a nd 2010 Census Population Statistics (BPS), processed by Sekna s FITRA a nd TAF Rema rks: All Rupiah a mounts in this ta ble a nd henceforth a re in rea l terms (a t constant 2008 prices)
In the a bove gra ph a nd elsewhere in this report “Kota” before a place name=”city of..”; places not preceded by “Kota” are kabupatens.
In most Kinerja regions surveyed (except Bondowoso and Bengkayang) year-on-year variations of average budget income were not large: only about 10% over the 4 years studied. In 2010 Bondowoso’s income was Rp 0.96 million/person (constant 2008 prices)—3% more than its average over the four years
studied (2008-11); for its part, Bengkayang’s income in 2008 was Rp 2.09 million/person, 15% higher
than its average over the four years (2008-11).
Budget income (at current prices) in the 20 Kinerja regions studied grew over most of the period, although, in real terms, growth was negative in 2008-09. Regions studied had average growth rates of budget income of -6.1% in 2008-09, rising to 11.9% in 2010 and falling slightly to 6.8% in 2011. In real
3,6 2,7 2,6 2,4 2,2 2,2 2,2 2,1 2,0 1,9 1,8 1,6 1,4 1,3 1,2 0,9 0,9 0,9 0,7 0,6
14
terms, the growth rate was reduced by very high inflation in 2008 (10.3%) and further inflation of 6.1% in 2010 (6.1%) (both rates averaged across regions): That contributed to average real growth rates of -3.8%
in 2008-09 and just 0.6% in 2010-2011.
Graph 2.2 Highest and Lowest Levels of Real Income Growth in Kinerja Regions Studied, 2008-11
Source: ABPD-Rs 2008-2010 and APBD-Ms 2011, processed by Sekna s FITRA a nd TAF
Remarks: “Rerata KINERJA”=Kinerja Regions Average.
F our kabupatens—Simeulue, Bangkayang, Melawi and Tulungagung—had overall negative budget income growth rates for the period studied. The first three named experienced negative growth over the two-year periods 2008-09 and 2009-10, but were in the black—especially in the case of Simeulue and Bengkayang—over the following period (2010-11); but even so, all three of them were in negative territory over the four years studied. As for Tulungagung, it experienced positive rates of budget income growth in the first two periods (2008-09 and 2009-10), but those gains were insufficient to cancel out the negative growth over the third two-year period (2010-11); and thus it was in negative territory overall.
On the other hand, five kabupatens—Probolinggo, Jember, Bulukumba, Aceh Singkil and Sambas— experienced quite high rates of budget income growth over the period studied. The first three named had a negative growth rate, in real terms, in 2008-09, but in 2010 and 2011 they experienced average growth rates of at least 5%, bringing their average over the four year period to 3% pa. The pattern in the other
two regions—Aceh Singkil and Sambas—was different but they too ended up achieving an average
growth rate over the four years of 3% pa.
2.2 Composition of Local Budget Income
Overall, during the years surveyed, regional fiscal balance funding (dana perimbangan) tended to decline as a proportion of local budget income, while other lawful local revenue (LPDS) increased.
Between 2008 and 2010, dana
perimbangan’s contribution to budget
income in the 20 Kinerja regions
studied declined, on average, from 87% to just 77%. At the same time, LPDS’s share increased from 8% to 18%; and
local own-source revenue (PAD)’s
share was steady. In 2011, however, original budget (APBD-M) figures indicated that all 20 regions were expecting LPDS’s contribution to decrease and PAD’s to increase.
-20%
15
Except for the three city governments outside East Java and four of five governments studied in East Java, local Kinerja governments surveyed depended to a very high degree on dana perimbangan and LPDS. The seven exceptions had a relatively high average level of PAD: over 5% of all local budget income. The rest of the regions studied obtained more than 95% of their budget income from central
government transfers in the form of both dana perimbangan and LPDS. The latter contributed as much
as 20%-21% in three regions—the cities of Makassar and Probolinggo and kabupaten of Barru—but less than 15% in other regions. Indeed, in 2010 around 25% of budget income in the three regions just mentioned came from LPDS.
Graph 2.4 Average Composition of Local Income in 20 Kinerja Regions, 2008-2011
Source: ABPD-Rs 2008-2010 and APBD-Ms 2011, processed by Sekna s FITRA a nd TAF
2.3 Regional Fiscal Balance Funding (Dana Perimbangan)
General Allocation F und (DAU) transfers—regions’ principal source of dana perimbangan—did not grow to any meaningful extent, in real terms, over the four years studied. Overall DAU transfers contributed around two thirds of regions’ budgetary income over the period; the city of Makassar was the only exception: less than half of its income in 2010 and 2011 derived from the DAU. Despite not
growing markedly in real terms, DAU transfers (in nominal terms) grew steadily over the period except in 2008-09 in Tulungagung, Jember and Bengkayang and in 2009-10 in Melawi and the city of Makassar.
Thus by 2011 per capita DAU transfers (in real terms) in the Kinerja regions studied were only 1.3%
higher than in 2008.
In eleven of the regions studied, DAU receipts, in real terms, declined between 2008 and 2011. Aceh Singkil was a standout exception, receiving 29% more DAU in real terms in 2011 than in 2008. But most
other regions experienced little change, except for 11 that experienced negative growth—mainly in East
Java (except for the city of Probolinggo) and West Kalimantan (except for Sambas). 0%
10% 20% 30% 40% 50% 60% 70% 80% 90% 100%
16
Graph 2.5 Average Per Capita Transfers of DAU to 20 Kinerja Regions, 2008 dan 2011 (Constant 2008 Prices)
Source: ABPD-Rs 2008-2010 and APBD-Ms 2011, processed by Sekna s FITRA a nd TAF
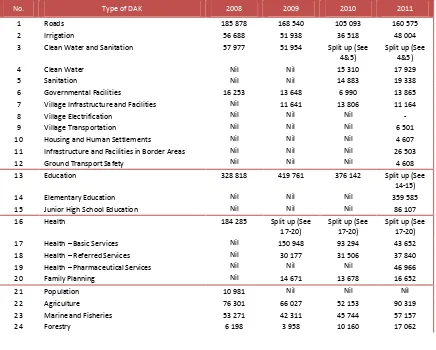
The range of sectoral funding provided by the Special Allocation Fund (DAK) expanded over the period, but amounts of funding in real terms tended to decline. In 2008 only eleven sectors received DAK funding; by 2011 the number had jumped to twenty two. Thus, while in 2008 just four different activities bearing on public works and transportation were funded, by 2011 the number had risen to eleven, one of which—village electrification infrastructure and facilities—was not funded at all in the 20
Kinerja regions studied. So too in the area of health: just one area of funding in 2008 turned into 4 by
2011 (including family planning).
Table 2.1 Total DAK Allocations by Program Area in 20 Kinerja Regions, 2008-11 (Rp Million, Based on Current Prices)
No. Type of DAK 2008 2009 2010 2011
11 Infrastructure and Facilities in Border Areas Nil Nil Nil 26 503
17 Rema rks: Ba sed on APBD-Ms a nd current prices.
Two of the 20 Kinerja regions studied—Simeulue and Barru—had fiscal indices 1higher than one but nonetheless received DAK allocations. Under the DAK’s ―general‖ criterion only regions with fiscal indices lower than one are eligible to receive DAK transfers, but two other criteria—―special‖ and ―technical‖—make it possible for regions with fiscal indices greater than one to receive DAK funds. These latter criteria, which easily ruled out other regions studied, made it possible for Simeulue and Barru to receive DAK allocations. In 2010 both these kabupatens received thirteen different types of funding— not including for governmental facilities or commerce—to the tune of Rp 33.8 billion (Simeulue) and Rp 32.6 billion (Barru). In 2011, further DAK funding worth no less than Rp 50 billion was provided for 16 program areas in Simeulue and Rp 39 billion for thirteen different sectors in Barru.
Overall, central government transfers to regions studied were not linked to local community welfare levels. We calculated total central government transfers to each region by adding together dana
perimbangan and LPDS derived from the Center in the form of grants, emergency funding, ―adjustment‖
funds and special autonomy grants; and comparing that total for each regions with its Human Development Index (HDI). Graph 2.6 tabulates the results: It shows that there was no correlation between a region’s average per capita transfers during 2008-11 and its HDI index. Regions with high HDIs such as the city of Banda Aceh still received quite substantial amounts of central government
transfers; and three regions in East Java—Probolinggo, Bondowoso and Jember—and Sambas (West
Kalimantan), all with low HDIs, received low levels of central government transfers.
Graph 2.6 Comparison of Regions’ Central Government Transfers Per Capita (2008-2011, at Constant 2008 Prices) and
Their 2009 Human Development Indices (HDIs)
Source: ABPD-Rs 2008-2010, APBD-Ms 2011 a nd HDI (2009, Na tiona l Tea m for Accelera ting Poverty Reduction (TNP2K), processed by Sekna s FITRA a nd TAF
1
18
2.4 Other Lawful Local Income (LPDS)
“Adjustment” funding and special autonomy grants increased in importance over the four years studied. In 2008 they contributed an average of just 2% of total budget income in the 20 Kinerja regions surveyed; by the end of the period their share had risen to 9% (2010) and 7% in 2011. These increases resulted from acceleration of regional infrastructure funding in 2008-11, regional incentive scheme
payments in 2010 and 2011 and increased payments for teachers in 2009-102.
Graph 2.7 “Adjustment” and Special Autonomy (Otsus) Funding Compared to DAK Transfers (2008 and 2010) and as a
Proportion of Total Budget Income (2010) in 20 Regions Studied
Source: ABPD-Rs 2008-2010 and APBD-Ms 2011, processed by Sekna s FITRA a nd TAF
In 2010 “adjustment” and special autonomy (otsus) funding eclipsed DAK allocations in thirteen Kinerja regions studied. All five regions in East Java and four regions in South Sulawesi (Luwu being
the exception) benefitted from ―adjustment‖ and otsus allocations that exceeded their DAK receipts and
contributed a minimum of 9% to total local budget income. In three cities—Makassar, Probolinggo and
Singkawang—―adjustment‖ and otsus funding was triple that received under the DAK. By contrast, still
in 2010, four of the five regions surveyed in Aceh (Aceh Tenggara was the exception) and three kabupatens in other provinces received only small amounts of ―adjustment‖ and otsus funding.
Another important component of LPDS, particularly in the city of Makassar and Kinerja regions studied in East Java, was tax revenue sharing with provincial governments. The biggest single contributor to this revenue stream was taxation on motor cycles; and the sharing of that revenue
contributed an average of 3.5% to total local income in 2008-11 in the regions just referred to. There was one interesting feature of this situation: in Bener Meriah, shared provincial tax revenue contributed 3.9% to local budget income in 2010, much more than in the three preceding years.
2 Fund for Infrastructure and Public Facilities, 2008 (Minister of Finance Regulation (PMK).81/PMK 07/2008); Fund to Strengthen Fiscal Decentralization to Speed up Regional Development, 2009 and 2010 (PMK 42/PMK 07/2009 and PMK 118/PMK 07/2010); Increased Paym ents for Teachers, 2009 and 2010 (PMK 223/PMK 07/2009 and PMK 119/PMK 07/2010); Regional Incentives Scheme, 2010 and 2011 (PMK 198/PMK07/2009 and PMK 61/PMK 07/2011); Fund to Strengthen Local Infrastructure and Public Facilities, 2010 and Fund for Acceleration of Development of Local Infrastructure, 2011 (PMK 140/PMK07/2011; and Fund for the Strengthening of Local Infrastructure 2011 (PMK 25/pmk07/2011).
) Dana Penyesuaian & Otsus/DAK 2008 - Sumbu Kiri
Dana Penyesuaian & Otsus/DAK 2010 - Sumbu Kiri Dana Penyesuaian/Total Pendapatan 2010 - Sumbu Kanan
19
Graph 2.8 Shared Provincial Taxation Revenue as a Proportion of Local Budget Income, 2008-2011 (%)
Source: ABPD-Rs 2008-2010 and APBD-Ms 2011, processed by Sekna s FITRA a nd TAF
2.5 Own-Source Local Revenue (PAD)
Per capita own-source local revenue (PAD) was significant only in city areas. Graph 2.9 shows that of
the 20 Kinerja regions studied only the four city governments had meaningful levels of PAD: an average
of over Rp 120 000/person/year. Other regions collected low levels of PAD: indeed, the kabupaten of Probolinggo had just Rp 35 000/person/year of PAD. By contrast, the national average for
PAD/person/year was Rp 93 000 in 2010.
Graph 2.9 Average PAD/person/year, 2008-2011 (Rp Million, Constant 2008 Prices)
Source: ABPD-Rs 2008-2010, APBD-Ms 2011 a nd 2010 Census Population Statistics, processed by Sekna s FITRA a nd TAF Rema rks: Rera ta= Avera ge;
Six regions estimated PAD for 2011 at much higher levels than in preceding years. These were the city
of Makassar and the kabupatens of Aceh Singkil, Bener Meriah, Bulukumba, Sedakau and Aceh
Tenggara: all of them estimated that their 2011 PAD would be 40% higher than in 2010. A closer look at
the data reveals that the increase was not because of the entry into force of Law No. 28/2009 on Regional
Taxes, Fees and Charges. Only in Aceh Singkil and the city of Makassar did local taxes become the
major contributor to PAD in 2011; in the other four ―other lawful PAD‖ continued to contribute most to PAD.
Apart from two provincial capital cities—Makassar and Banda Aceh—Aceh Tenggara derived most income from taxation revenue. The former are large cities with an extensive tax base—hotels,
20
restaurants, places of entertainment—while Aceh Tenggara is a relatively isolated area; but it nonetheless
managed to increase its proportion of PAD from taxation from 18% in 2008-09 to 34% in 2011.
Fees & charges and “other PAD” were the most important contributors to PAD in most regions
studied. Fees and charges contributed most to PAD in Probolinggo, Bulukumba, Sambas, Luwu,
Bondowoso, Luwu Utara and Bener Meriah, and the cities of Singkawang and Probolinggo. Most of this
revenue came from health and local marketplace charges mostly borne by the lowest echelons of society.
Other regions—Jember, Sedakau, Tulungagung, Melawi, Aceh Singkil, Simeulue and Bangkayang—
relied on ―other PAD‖ for their PAD revenue. This was noteworthy given that the revenue in question
came either from interest on bank deposits—evidence that money available to local governments to spend
was being put aside rather than spent on development—or from charges for services provided by local
community service agencies (known as BLUDs). Given that local governments often use BLUDs for establishing hospitals or community health centers, this means health service users (read the poor) are major contributors to PAD.
Graph 2.10 Percentage Contribution to PAD by Source, 2010
Source: ABPD-Rs 2008-2010 and APBD-Ms 2011, processed by Sekna s FITRA a nd TAF
0% 20% 40% 60% 80% 100%
Lain-lain PAD
Hasil Kekayaan Daerah
Retribusi Daerah
Pajak Daerah Other PAD
Income from Locally Owned Assets Local Fees & Charges
21
3.
Local Budget Expenditure
It is important to analyze overall local government expenditure to get a quick feel for the quality of local budget policies. A general analysis can pinpoint whether a local government emphasizes spending on delivery of public services and economic development— that is, on capital expenditure and provision
of goods and service— or tends to focus instead on meeting the needs of its own bureaucracy (only some
which doubles as expenditure on public services). A quick analysis will also reveal amounts spent on
grants and social aid (bansos) both of which can ―gobble up‖ budgets.
Based on Home Affairs Minister regulation No. 13/2006, local budget expenditure can be reduced to two broad categories:
(i) ―Indirect‖ expenditure: including civil service costs, interest payments, grants, social aid, spending shared with provinces/kabupatens/cities & villages, and unanticipated expenditure;
(ii) ―Direct‖ expenditure: consisting of spending on civil servants, goods and services and capital
expenditure.
3.1
Overview of Local Government Budget Expenditure
Kinerja regions studied exemplified a very wide range of budgetary expenditure, with the five regions in Aceh province at the high end of the scale and four of the five in East Java at the low end. Over the four years (2008-11) the five governments surveyed in Aceh spent an average of Rp 2
million/person/year (constant 2008 prices); Simeulue—the biggest per capita spender of all the regions
studied—reached an average of Rp 3.5/million/person/year. Apart from the five Aceh governments,
Barru, Melawi and city of Singkawang also spent in excess of Rp 2 million/person/year. But, in East
Java, four of the five regions studied—the city of Probolinggo being the only exception—spent less than
Rp 1 million/person/year (with Jember spending least: just Rp 561 000/person/year).
Graph 3.1 Average Local Government Expenditure, 2008-2011 (Rp Million/Person, Based on Constant 2008 Prices)
Source: ABPD-Rs 2008-2010, APBD-Ms 2011 a nd 2010 Census Population Statistics, processed by Sekna s FITRA a nd TAF Rema rks: Rera ta= Avera ge
Average expenditure over the period studied fluctuated by approximately 10% in only five of the regions surveyed. On the high side, in Simeulue, spending in 2009 reached Rp 3.9 million/person/year, far more than its average for 2008-11(Rp 3.5 million); so too in Probolinggo and Jember (both in East Java) 2011 APBD-M spending targets were 12-13% above their 4-year average. But, on the low side, in Barru and Bener Meriah, spending virtually plummeted at times: in the former it fell (in 2009) to just
3,5 2,7 2,6 2,6 2,2 2,2 2,2 2,1 2,0 2,0 2,0 1,6 1,4 1,3 1,3 0,9 0,9 0,9 0,7 0,6 0,0
1,0 2,0 3,0 4,0
22
Graph 3.3 Average Overall Composition of Kinerja Kabupaten/City Expenditure, 2008-2011
Lain-lain
Modal
Barang/Jasa
Pegawai 17% of the kabupaten’s yearly average for 2008-11; and in Bener Meriah in 2008 it was just 11% of its four year average.
After experiencing negative growth in real terms in 2008-09, budgetary spending in Kinerja regions studied grew by an average of 4% over the following two years. In nominal terms, regions’ expenditure rose consistently at an average of 8% in 2008-09, 7.6% in 2010 and 10.8% in 2011. But high rates of
inflation in 2008—an average of 10.3% in the 20 regions studied—reduced real expenditure growth rates
in 2008-2009 to –2.8% p.a. Lower inflation in 2010-11—3.7% in 2010 and 6.1% in 2011—contributed to
positive growth of expenditure at an average rate of 3.7% in 2010 and 4.4% in 2011.
City governments’ expenditure budgets tended to grow more strongly than those of kabupatens. Of the five top spenders among regions studied three were city governments: Makassar, Probolinggo and Singkawang; they all notched up average expenditure growth rates of 4% over the four years surveyed;
another city—Banda Aceh—also achieved quite high levels of expenditure growth (an average of 2.3%
over the four years). Two of the five top spenders—the kabupatens of Probolinggo and Jember—were
located in East Java: their spending grew by approximately 6% over the period studied. By contrast, three
regions in West Kalimantan—Bengkayang, Melawi and Sekadau—as well as Simeulue (in Aceh), on
average, experienced negative growth rates in expenditure; and Bondowoso, despite having positive rates
of expenditure growth, ranked fifth lowest for spending among the 20 Kinerja regions studied.
Graph 3.2 Highest and Lowest Rates of Growth in Budgetary Expenditure among Kinerja Regions Studied, 2008-2011
Source: ABPD-Rs 2008-2010 and APBD-Ms 2011, processed by Sekna s FITRA a nd TAF
3.2
Analysis of the Components of Local
Government Expenditure
Spending on local civil services increased over the period studied, causing capital expenditure to decline. In 2008-09 civil service expenditure— ―direct‖ and―indirect‖3—constituted, on average, less
than 50% of government expenditure in Kinerja
regions studied. By 2010-11 the proportion had risen to 55%-56%. With expenditure on goods & services
3
23
and ―other items‖4 remaining constant at around 17%-19% and 8% respectively, capital expenditure felt the squeeze and declined over the period. In 2008 regions studied spent an average of 27% of their budgets on capital expenditure, but that proportion had fallen to around 19% by 2010 and 2011.
Half of the regions studied allocated more than 50% of their budgets to fund civil service costs
(calculated from average expenditure for the period (2008-11)). Among these were the four kabupatens studied in East Java and three regions in South Sulawesi: Bulukumba, Luwu and the city of Makassar. Of all regions studied the city of Banda Aceh spent most on its civil service (as much as two thirds of its
entire budget). On the more economical side were three regions in West Kalimantan—Bengkayang,
Melawi and Sekadau: they expended less than 42% of their budgets on civil service costs; and the lowest spender of all was Sekadau (just 30-31% between 2008 and 2010, rising to 38% in 2011).
Graph 3.4 Average Composition of Expenditure of Kinerja Governments Studied, 2008-2011
Source: ABPD-Rs 2008-2010 and APBD-Ms 2011, processed by Sekna s FITRA a nd TAF
With the exception of just three kabupatens in West Kalimantan, spending on goods & services and on capital items—counted on to stimulate local economies and deliver public services—trended
downwards in regions studied. The exceptions—Bengkayang, Melawi and Sekadau—appropriated, on average, more than half of their budget for goods & services and capital items over the four years surveyed; indeed, in Sekadau, capital expenditure did not drop below 50% of budget expenditure in any of the years studied. By contrast, in the city of Banda Aceh and in the kabupatens of Tulungagung and Bondowoso, expenditure on goods & services and capital items was less than 30% of budget expenditure; indeed, in 2011 they each only allocated ¼ of their budgets for those purposes.
3.3
Analysis of Public Service Expenditure
Some Kinerja regions studied spent more on their civil services that they received for that purpose via the General Allocation F und (DAU). Overall, regions spend ―just‖ 69% of their DAU allocations on civil service costs in 2008; the proportion rose to 76% in 2009 and 87%-88% in 2010 and 2011. But our study found that, on the basis of 2010 realized budget figures, five regions—two relatively large cities (Makassar and Banda Aceh) and three kabupatens in East Java (Tulungagung, Bondowoso and
Jember)— spent more on civil service costs than their total DAU receipts. By contrast, Melawi and
Sekadau expended less than two thirds of their DAU transfers on civil services costs.
4
24
Graph 3.5 Proportion of DAU Spent on Civil Service Costs in 20 Kinerja Regions Studied, 2010
Source: ABPD-Rs for 2010, processed by Seknas FITRA and TAF
In several regions studied—particularly in East Java—there was a high ratio between the number of civil servants and total population. Nationwide it is estimated that there is one local government civil
servant per every 63 people5. Based on that figure, seven regions studied— the four kabupatens surveyed
in East Java, the city of Makassar and the kabupatens of Melawi and Sekadau— did better than the
national average by having more than 63 people per civil servant. Six of the seven—Melawi being the
exception—appropriated relatively low levels of civil service spending per local inhabitant: on average, less than Rp 650 000/person/year; for its part, Melawi appropriated quite a substantial amount (Rp 900 000/person/year).
On the other hand, governments studied in Aceh and some governments in other provinces had low civil service to population ratios and spent sizeable amounts per local inhabitant on civil service costs. In Aceh, the five regions studied all had very high levels of civil service expenditure per local inhabitant:
Rp 1.1 million/person/year, and a relatively low public servant to population ratio (below 1:42)—a sign
of inefficient government). Other regions in a similar situation—low civil servant/population ratios and
sizeable civil service expenditure/local inhabitant—were Barru, Singkawang and the city of Probolinggo.
Graph 3.6 Average Civil Service Expenditure per Local Inhabitant (2008-2011, Constant 2008 Prices) and Civil Servant/Population Ratios in the 20 Kinerja Regions Studied
Source: ABPD-Rs for 2008-2010, APBD-Ms 2011, Population Census for 2010 (BPS) a nd Civil Service Numbers 2009 (MoF), processed by Sekna s FITRA a nd TAF Rema rks: Da ta on number of civil serva nts in Aceh Tenggara was taken from “Aceh Tenggara Dalam Angka” and for Sambas from a sta tement by the hea d of
Sambas’ Regional Civil Service Agency quoted in www.equator-news.com (7 Octoboer 2011).
5
According to the Ministry of Administrative Efficiency and Bureaucratic Reform, as of May 2011 there were 3.79 million local government civil servants in Indonesia; and according to the 2010 Census Indonesia’s population totaled 237.56 million people.
25
3.4
Analysis of Expenditure on Social Aid and Grants
Overall expenditure on social aid (bansos) and grants6 over the period in the Kinerja regions studied rose between 2008 and 2010. These line items are often not drafted with the benefit of public
participation and are not well accounted for. Nevertheless, in regions studied, spending on them rose, on
average, from 4.3% of total local expenditure to 4.9% in 2010; but it declined to 3.7% in 2011.
Some regions—particularly in Aceh—allocated substantial amounts for spending on social aid (bansos) and grants. Examples of this were the four kabupatens in Aceh: they spent between 5.7% and 7.1% of their budgets on these two line items between 2008 and 2011 and averaged between Rp 17.5 and Rp 22.9 million p.a. (constant 2008 prices). Other regions allocating more than 5% of their total
expenditure for bansos and grants were Sekadau, Jember and the city of Makassar. In fact, the last two
named spent quite substantial amounts: an average of Rp 74.4 billion pa (Jember) and Rp 59.7 pa (Makassar) over the four years studied. By contrast, Barru allocated just 2% of its annual spending on these two types of expenditure.
Graph 3.7 Average % of Total Local Budgets of Kinerja Regions Studied Spent on Social Aid and Grants (2008-2011)
Source: ABPD-Rs for 2008-2010 a nd APBD-Ms 2011, processed by Sekna s FITRA a nd TAF
F indings of the national Audit Board (BPK) have exposed a number of issues around expenditure on social aid and grants in regions studied. For example, it found that in 2009 in Sekadau Rp 376 million of social aid had not been distributed to beneficiaries and of that an amount Rp 300 million had been
accounted for in a ―pro forma‖ way. Also, in 2008 in Simeulue, as much as Rp 1.18 billion worth of
social aid earmarked for community organizations was found to have been dispersed to parent
departments in the central government; and supporting evidence was incomplete in the case of a further
Rp 6.5 billion. In Aceh Singkil as well, in 2009, Rp 7.05 billion earmarked for social aid and ―unforeseen
items‖ was found to have not been properly accounted for.
6
Home Affairs Minister regulation No. 32/2012 specifies ―grants‖ (hibah) as being assistance in cash or kind paid by a local government to the central government, other local governments, a local company, the community or community organizations for purposes tha t have been clearly specified. For its part, ―social aid‖ (bansos) can take the form of payments in cash or kind to individuals, families groups or the community. Neither form of payment is obligatory or binding, or paid on a continuing basis.
5,5%
26
4.
Local Budget Financing
An analysis of budget financing is necessary to establish how local governments finance their deficits and make use of budget surpluses. Local government expenditure budgets are generally framed to have deficits—expenditure exceeding income—made up for by various streams of financing. Some, however, manage to have budget surpluses which they carry forward into the next budget year.
Budget financing consists of two components: inflows and outflows. The difference between these two is called ―net financing‖; and the difference between net financing and a deficit/surplus—the
difference between budget income and expenditure—is either a ―budget surplus‖ if positive (called
SiLPA in Indonesian) or a ―budget deficit‖ if negative (SiKPA in Indonesian).
(i) The inflows side of the financing ledger encompasses budget surpluses carried forward from
the previous fiscal year (SiLPA), liquidation of reserves, revenue from the sale of locally-owned assets, funds realized from local government borrowings and bonds, repayment of local government loans, funds obtained via local government borrowing and bonds, payment of local government accounts receivable and ―other‖ items;
(ii) The outflows side of the financing ledger includes establishment of fiscal reserves,
investment in local ventures, repayments of principle of monies borrowed, disbursement of local government loans and ―other‖ outgoings.
4.1
Fiscal Space
F iscal space (discretion) goes to a government’s degree of flexibility in setting priorities in program financing. It is calculated by subtracting the following from total budget revenue: earmarked funding— DAK transfers, grants, emergency funding, ―adjustment‖ and special autonomy transfers—and non-discretionary spending (civil service costs and interest payable on borrowings).
Overall, fiscal space in the 20 Kinerja regions studied declined between 2008 and 2011. In 2008 the
average was 39% but it declined to 35% in 2009; it went down more markedly in 2010—except in the
city of Banda Aceh— to 29%; and fell again in 2011 to just 27%.
27
Graph 4.1 Average Fiscal Space in 20 Kinerja Regions, 2008-2011
Source: ABPD-Rs for 2008-2010 a nd APBD-Ms 2011, processed by Sekna s FITRA a nd TAF
4.2
Budget Surpluses/Deficits
The Ministry of F inance sets annual ceilings for local government deficits (expenditure in excess of income). Law No.17/2003 concerning State Finances stipulates that national and local government deficits should not exceed 3% of Gross Domestic (or Regional) Product. In implementing this law, the Minister of Finance places ceilings on local government deficits to ensure that they do not violate the
law: the 2009 ceiling was 3.5% of local budget income and 4.5% in both 2010 and 2011.7
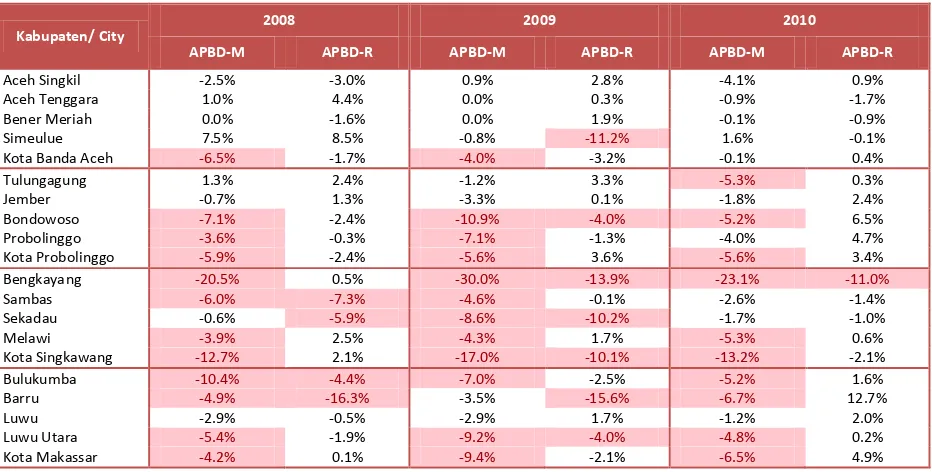
Quite a few of the regions studied had original budgets (APBD-Ms) incorporating deficits in excess of set ceilings. Table 4.2 shows that twelve regions infringed the 3.5% ceiling set for 2008 and 2009; and, in 2010, ten regions studied exceeded the ceiling even though it had been increased to 4.5%. This situation was evidence of carelessness about balancing the budget on the part of regions concerned; it also highlighted the need for provincial governments to take a closer interest, given their role of checking kabupaten/city budgets before their adoption. That said, four kabupatens in Aceh and the kabupatens of Jember and Luwu did not once exceed set deficit ceilings. By contrast, Bengkayang consistently had annual budget deficits in excess of 20% between 2008 and 2010.
Control over deficits at the budget formulation stage (APBD-Ms) was not always reflected in end-of-year realized budgets (APBD-Rs). In 2008-09, twelve regions built a deficit of more than 3.5% into their APBD-Ms, but by end year their situation was different: only three of them in 2008 and five in 2009 had end-of-year (APBD-R) budget deficits; and in 2010 just one of ten regions with APBD-M deficits in excess of 4.5% had an APBD-R in the red. But several regions projecting low deficits in their APBD-Ms ended up with very sizeable end-of-year deficits: Simeulue (in 2009), Sekadau (in 2008) and Barru (in 2009). This finding indicates that local governments need to keep deficits in control throughout the whole fiscal year, not just at the budget planning/formulation stage.
7 See following Minister of Finance regulations (PMK): PMK No.123/PMK.07/2008 (for fiscal year 2009); PMK No.138/PMK.07/2009 (for 2010); and PMK No.149/PMK.07/2010 (for 2011).
49% 46% 38% 37% 37% 35% 34% 34% 34% 33% 33% 30% 29% 28% 27% 27% 26% 25% 24% 22%
0% 10% 20% 30% 40% 50% 60%
28
Table 4.1 Surpluses/Deficits as a Proportion of Local Budget Income, 2008-2010
Kabupaten/ City
Source: ABPD-Rs for 2008-2010 a nd APBD-Ms 2011, processed by Sekna s FITRA a nd TAF
Rema rks: Shading indica tes ca ses of deficits in excess of limits set by the Minister of Fina nce;
4.3
Budget Financing
Budget deficits were made up for by budget financing mainly from budget surpluses carried forward (SiLPA) from the preceding year. But the proportion of budget financing coming from SiLPA declined steadily over the period from 11% in 2008 to just 3% in 2011. Even so, five regions—Bengkayang,
Bondowoso and Probolinggo and cities of Makassar and Probolinggo—consistently used SiLPA to
finance more than 5% of their total budgetary expenditure. Indeed Bengkayang, although using progressively less SiLPA over the period , nonetheless used it to finance more than 30% of its budget spending in 2008-09. This was the result of local government failure to spend budgets effectively, resulting in carry-overs (SiLPA) from one year to the next.
Graph 4.2 SiLPA as a Proportion of Budget Expenditure in 9 Kinerja Regions Studied, 2008-2011 (%)
Source: ABPD-Rs for 2008-2010 a nd APBD-Ms 2011, processed by Sekna s FITRA a nd TAF.
-5%
Bengkayang Barru Simeulue Sekadau Bondowoso Bulukumba Luwu Utara Probolinggo Kota
Makassar Kota Probolinggo
29
In addition to SiLPA, five governments used borrowing to finance sizeable amounts of expenditure. Barru borrowed heavily between 2008 and 11—as much as Rp 113.3 billion; but over the same period paid back only Rp 32.3 billion (a sign that its loans were long term). Several other regions used short term borrowing to finance their budgets; Simeulue, Sambas and Sekadau were clear cases in point, fully repaying in one year money they had borrowed the year before.
Table 4.2 Borrowing Inflows and Outflows in Five Kinerja Regions Studied, 2008-2011 (Rp Million)
Year Budget Line Simeulue Sambas Sekadau City of Singkawang Barru
2008
Source: ABPD-Rs for 2008-2010 a nd APBD-Ms 2011, processed by Sekna s FITRA a nd TAF.
Several regions studied were unable to finance spending deficits and thus at end year had unfunded budget deficits (SiKPA). Ideally, a surplus or deficit should be identified either during budget
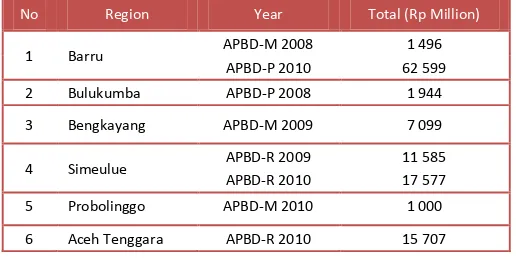
planning/formulation (APBD-M) or revision (APBD-P) and should be fully made good with ―net financing‖ (the difference between inflows and outflows in the financing ledger)—effectively keeping SiLPA for the year at zero. But several kabupatens studied—Barru, Bulukumba, Bengkayang and Probolinggo—failed to do that, even though they knew that both in their original budgets (APBD-Ms) and their revised APBD-Ps income was insufficient to fund proposed expenditure; and that, accordingly, a budget deficit was looming. In the event, however, all four regions ended up having budget surpluses. Not so lucky were Simeulue and South East Aceh: these governments did not manage to finance deficits in their realized budgets (APBD-Rs) and had to carry forward deficits to be financed in the ensuing year.
Table 4.3 Regions with Overall Budget Deficits Carried Forward (SiKPA)
No Region Year Total (Rp Million)
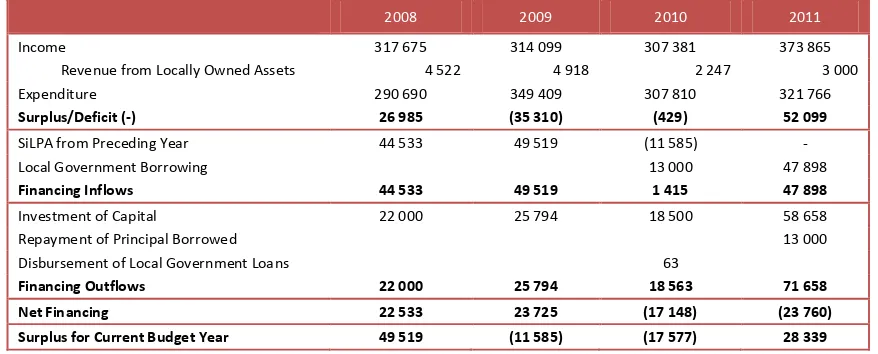
In Simeulue, local government investment in local enterprises undermined the health of the
kabupaten’s budget. The investments cost Simeulue dearly: around Rp 18.5 billion in 2010 and as much as Rp 58.7 billion in 2011. Reports of the national Audit Board (BPK) on fiscal years 2008 and 2009 (the 2010 report was not available) indicate that more than 90% of local government investment was directed into a local government company (called PDKS), while the remainder was channeled into the Regional
30
Development Bank (BPD) of Aceh and the Regional Water Supply Authority. Up to 2007, Simeulue had invested Rp 125.5 billion in PDKS and Rp 11.6 billion in BPD Aceh. But own-source revenue (PAD)
data under ―income from local assets‖ indicates that revenue from these three local ventures only
amounted to around Rp 4.9 billion in 2009 and Rp 2.2 billion in 2010. Furthermore, these investments resulted in unfinanced budget deficits (SiKPA) to the tune of Rp 11.6 billion in 2009 and Rp 17.6 billion in 2010. Indeed, in 2010, Simeulue had to borrow Rp 13 billion, repaying it in full the following year. All this is evidence enough of high costs piling up from local investments that yielded little concrete return.
Table 4.4 Summary of Local Budgets of Simeulue, 2008-2011 (Rp Million)
2008 2009 2010 2011
Income 317 675 314 099 307 381 373 865
Revenue from Locally Owned Assets 4 522 4 918 2 247 3 000
Expenditure 290 690 349 409 307 810 321 766
Surplus/Deficit (-) 26 985 (35 310) (429) 52 099
SiLPA from Preceding Year 44 533 49 519 (11 585) -
Local Government Borrowing 13 000 47 898
Financing Inflows 44 533 49 519 1 415 47 898
Investment of Capital 22 000 25 794 18 500 58 658
Repayment of Principal Borrowed 13 000
Disbursement of Local Government Loans 63
Financing Outflows 22 000 25 794 18 563 71 658
Net Financing 22 533 23 725 (17 148) (23 760)
Surplus for Current Budget Year 49 519 (11 585) (17 577) 28 339
31
5.
Analysis of Local Budget Planning, Revision and Realization
It is important to compare and contrast original budgets Ms), mid-year revised budgets (APBD-Ps) and realized budgets (APBD-Rs) to assess the quality of budgetary processes and to identify the most strategic point for advocacy interventions. APBD-Ms are drawn up on the basis of relatively participative planning and discussion processed over a whole year before the start of the fiscal year in question. Nonetheless Seknas FITRA’s Local Budgets Study for 2010 (published in 2011) found that local
governments studied often did not plan their budgets well. The blame for this situation cannot be ascribed to local governments alone; it is also caused by unpredictable additional fiscal transfers from the central government. Mid-year budget revision processes—theoretically completed in August-September—are important: it often involves significant changes leading to wide gaps between revised budget proposals and end-of-year budget outcomes (APBD-Rs). Another issue is the usually transparent and non-participative nature of budget revision processes. This chapter examines the extent to which budget outcomes reflect the content of original and revised budgets in 20 Kinerja regions studied.
5.1
Analysis of Planning and Revision of Budget Income
Overall, budget income planning processes in the 20 Kinerja regions studied were reasonably good, except in 2010. Average actual end-of-year budget income (APBD-R figures) in the 20 regions over
three fiscal years surveyed (2008-10) was around 100%—more precisely between 99% and 103%—of
original budget (APBD-M) projections and revised budget (APBD-P) targets. The only exception was 2010 when realized income in APBD-Rs was 113% of APBD-M targets.
Graph 5.1 Comparison of Income Targets in APBD-Ms and APBD-Ps with Realized Income in APBD-Rs in 20 Kinerja
Regions Studied (Averaged), 2008-2010
Source: ABPD-Ms, APBD-Ps a nd APBD-Rs for 2008-2010 in 20 Kiner ja Regions, processed by Sekna s FITRA a nd TAF.
Remarks: APBD-Ps for 2010 for Aceh Tenggara, Simeulue, Bengkayang and Sekadau were not available and are excluded from these calculations.
These relatively accurate budget planning and revision processes were attributable to the regional fiscal balance transfer (dana perimbangan) system that contributed more than 75% of budget income in regions studied. In the four fiscal years studied, realized budgets (APBD-Rs) showed that actual
income from dana perimbangan was, on average, between 98% and 100% of amounts projected in
original budgets (APBD-Ms); that showed that local governments had reliable information on income
from dana perimbangan at both the budget planning and revision stages. Aceh Tenggara was alone
among governments studied in significantly miscalculating its likely level of dana perimbangan receipts:
in 2008 its realized income from this source was 89% of its mid-year revised budget (APBD-P) targets; in 2009, it was 84% of both APBD-M and APBD-P estimates; while it 2010 its estimating was quite good because it achieved 102% of its APBD-M projection.
50%
32
Estimation of levels of “other lawful local revenue” (LPDS) was quite a different story: clearly local governments studied were incapable of accurately estimating LPDS at the budget planning/
formulation stage—with unfortunate consequences, especially in 2010. Graph 5.1 illustrates the problem: in 2008, on average across the 20 governments studied, realized (APBD-R) LPDS was 88% more than that projected in APBD-Ms, but 100% of revised budget (APBD-P) targets; in 2009-10, the situation was even worse: with realized LPDS being 240% (2009) and 308% (2010) higher than APBD-M targets. It must be said, however, that because LPDS contributed an average of just 8% of total local income in 2008 in regions studied, the ill-effects of this poor planning were not really felt until 2010 (when LPDS, on average, represented 23% of local income).
In 2010, in twelve Kinerja regions studied, realized LPDS was more than double APBD-M projections; indeed in Aceh Tenggara it was nine times greater (Graph 5.2). Melawi was closest to achieving 100% of APBD-M targets for LPDS, but even in its case end-of-year revenue was almost 50% more than original estimates. When compared to revised budget (APBD-P) projections, however, realized LPDS was closer to what was targeted: in most regions studied actual LPDS was approximately 10% of
APBD-P targets; the exceptions were Luwu Utara and Melawi and the city of Banda Aceh—which realized less
than 90% of APBD-P targets for LPDS—and Probolinggo and Bondowoso (which exceeded APBD-P
targets). These findings indicate that local governments can make accurate estimates of LPDS only
during mid-year budget revision processes.
Graph 5.2 Actual End-of-Year LPDS Compared to Original Budget (APBD-M) and Mid-Year Revised Budget (APBD-P) Targets in 20 Kinerja Regions Studied, 2010
Source: ABPD-Ms, APBD-Ps a nd APBD-Rs for 2010 in 20 Kiner ja Regions, processed by Sekna s FITRA a nd TAF.
Remarks: APBD-Ps for 2010 for Aceh Tenggara, Simeulue, Bengkayang and Sekadau were not available (and thus APBD-R/APBD-P is not zero).
The cause of this poor estimation of LPDS in original 2010 budgets (APBD-Ms) was the existence of
“adjustment” funding for regional infrastructure development and its allocation only during mid-year budget revision processes. In 2010, there were two adjustment funds in play in regions studied: the Fund to Strengthen Fiscal Decentralization to Speed up Regional Development (DPD-FPPD for short) and the Adjustment Fund for Regional Infrastructure (DPID). Funding under these two schemes—the outcome of ―budget optimization‖ discussions within the House of Representatives and distributed for inclusion in
mid-year revised budgets (APBD-Ps)—do not form part of dana perimbangan but are subsumed under
LPDS. Thus, although these ―adjustment‖ funds are helpful to regional infrastructure development, their allocation mid-year, at budget revision time, undermines local government budget planning processes.
As for own-source revenue (PAD), it was evident that local governments studied grew more optimistic each year about their capacity to increase levels of PAD. Although PAD contributed only modest amounts to budget income of regions studied—on average, less than 10% in 2010—it is important,