PHYSICAL CHARACTERIZATION OF Ni(II) DOPED TiO
2NANOCRYSTAL
BY SOL-GEL PROCESS
Prasetyo Hermawan
1,2,*, Harno Dwi Pranowo
3, and Indriana Kartini
31
Student of Doctorate Program, Department of Chemistry, Faculty of Mathematics and Natural Sciences, Universitas Gadjah Mada, Indonesia
2
Department of Leather Tannery, Academy of Leather Technology, Jl. ATK, Bangunharjo, Sewon, Bantul, Yogyakarta
3
Department of Chemistry, Faculty of Mathematics and Natural Sciences, Universitas Gadjah Mada, Jl. Sekip Utara Bulak Sumur, Yogyakarta 55281
Received February 10, 2011; Accepted July 29, 2011
ABSTRACT
Ni(II) doped titanium dioxide has been prepared by using sol-gel process. Ni(II) ion was incorporated into titanium dioxide by reacting Ni(II) chloride with titanium tetraisopropoxide (TTiP)-acetyl acetone mixture in isopropanol solvent. The effects of transition metal ion doping on the physical properties have been investigated. UV/Vis spectrophotometer, TGA-DTA, X-ray diffraction (XRD) and DR-UV/Vis were used to investigate the spectra absorption of nanosol, nanoparticle thermal transition, structure of crystal and band edge absorption, respectively. The results at addition of 5% Ni/Ti revealed that absorbance of nanosol increased from 0.811 (λmax: 342 nm) to 2.283
(λmax: 350 nm). The crystallization temperature transition from anatase to rutile decreased from 500 °C to 475 °C.
The particle size increased from 18.51 nm to 20.35 nm, while the band gap energy (Eg) decreased from 2.73 eV to 2.51 eV.
Keywords:TiO2photocatalyst, Ni(II) doped, sol-gel
INTRODUCTION
Photocatalytic technology has been applied widely in various fields such as environmental purification, anti-bacterial uses and self cleaning. Titanium dioxide (TiO2)
is well known as chemically stable and harmless photocatalyst. Because of these robust photocatalytic properties, application of TiO2 spreads increasingly [1].
However, ultraviolet-light irradiation is necessary to fulfill its photocatalytic functions, so TiO2photocatalyst holds
limitation of application range and effective use of light. The effective photoexcitation of TiO2 semiconductor
particles requires application of light with energy equal to or higher than its band gap energy (Eg). For anatase the band gap energy is 3.2 eV and for rutile is 3.02 eV, which correspond to the absorption thresholds of 380 nm and 410 nm for the two polymorphs of titania, respectively. In order to improve the photocatalytic efficiency and to expand the application fields, development of visible-light or natural sunlight responsive photocatalyst is demanded. Currently, visible light photocatalytic materials can be surmounted by modifying the surface of the semiconductor, by using transition metals or non-metallic elements doped into TiO2, by preparing semiconductors from noble metal
oxides with narrow band gap or composite
semiconductors, and by surface sensitization with adsorbed dyes [2].
Transition metal ions are commonly employed as dopants due to their strong absorption of visible light and their similar ionic radius to the parent titanium ion. Nickel is one of transition elements used to modify the titania surface. The effects of Ni2+on the photocatalytic properties of TiO2 have been investigated by several
authors [3,4]. However, as far as we know Ni doped TiO2systems is sparsely studied compared to the other
areas of transition metal doping, so do the information of their physical properties. In this paper, we want to report the preparation of Ni(II) doped TiO2 by sol-gel
process and their physical properties. Ni(II) was selected as dopant because Ni2+ has similar radius as Ti4+ (the effective ionic radii are 72 pm and 68 pm, respectively). Ni(II) can also form octahedral coordination as Ti4+. The concentration of the beneficial transition metal should be very small. Large concentrations will be detrimental. It has been argued that although impurity energy level would lead to visible light response for wide band gap semiconductor photocatalyst, it could also act as recombination centers leading to increasing recombination of e-/h+.
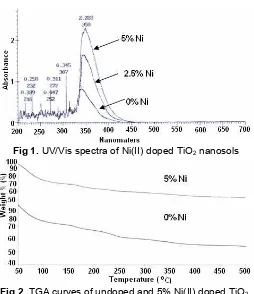
Fig 1.UV/Vis spectra of Ni(II) doped TiO2nanosols
Fig 2.TGA curves of undoped and 5% Ni(II) doped TiO2
Table 1. The spectra absorption of nanosol Ni doped TiO2
TiO2 λ max (nm) absorbance
undoped 342 0.811
2.5% Ni doped 345 1.563
5% Ni-doped 350 2.283
distribution of the dopant in the host matrix, providing good stoichiometry control and ease of processing [5]. It will be shown that Ni(II) doping into TiO2 crystal affects
the absorption spectra of titania nanosol, anatase to rutile temperature phase transformation, particle size and the band gap energy of the resulted photocatalyst.
EXPERIMENTAL SECTION
Materials
All chemicals were analytical grade and used without further purification. Titanium tetraisopropoxide (TTiP) was purchased from Aldrich, acetylacetone (Acac-H), isopropanol, hydrochloric acid (HCl), nickel (II) dichloride (NiCl2.6H2O) were obtained from Merck. The
solvent used was deionized water.
Instrumentation
UV/Vis spectra of nanosol was monitored using a UV/Vis spectrophotometer (Milton Roy, Spectronic 3000
Array) in the wavelength region of 200–700 nm. Thermal analysis was carried out on a thermal gravimetric analyzer/TGA and differential thermal analyzer/DTA (Shimadzu, TGA/DTA-60) under the flow of N2 atmosphere (60 mL/min) at a heating rate of
20 °C/min from 50 °C to 500 °C. The X-ray diffraction pattern of the resulted materials were obtained using an XRD (Rigaku D MAX III VC) of Ni-filtered Cu K α radiation (: 1.54056 Å) at a scan rate of 4°/min. Reflectance and absorbance of powder photocatalyst spectra were recorded by an SR UV/Vis spectrophotometer (Pharma Spec. Shimadzu 1700) in the wavelength region of 300–800 nm.
Procedure
Preparation of Ni-doped TiO2Powder
Preparation of Ni-doped TiO2 powder by sol-gel
process at room temperature was adopted from Maeda et al. [6] with several change and modification. The molar ratio of each reagent was TTiP: isopropanol: acac-H: HCl: H2O: Ni = 1: 20: 2: 0.5: 3.2: (0, 0.025, and
0.05). The sol solution was prepared as follows; the mixture of TTiP, acac-H and half volume of isopropanol was stirred for 1 h. Nickel salt was dissolved in the mixture of deionized water, HCl and the other half volume of isopropanol. The nickel salt solution was then stirred for 1 h. Titania sols and nickel salt solutions were mixed and stirred for at least 12 h. Sol solutions were dried at 80 °C for 6 h and then calcined at 500 °C for 1 h to obtain photocatalyst powder.
RESULT AND DISCUSSION
Nanosol properties
Hydrolysis of TTiP resulted in a polydispersed sol (nanosol) composed of 10–20 nm particles [7]. The UV/Vis spectra of nanosol was monitored to studied the effect of Ni(II) concentration in its nanosol spectra. The spectra were presented in Fig. 1.
Data from Fig. 1 indicates that all TiO2 samples
behave similarly. The addition of 5% Ni/Ti resulted in larger red shifting of the maximum of the absorption wavelength (λmax) and its absorbance. This phenomena is possibly because of induced photoactive transitions of Ni2+ in the nanosols. Table 1 shows the electronic absorption data of the Ni(II) doped and undoped TiO2
nanosols.
Thermal properties
The thermogravimetric analysis (TGA) was done to study the weight loss of the pure TiO2 compare to
Table 2.The lattice parameters of undoped and Ni-doped TiO2
3.769 9.448 18.510 93.98%, Anatase
6.02% Rutile
3.789 9.528 18.505 95.28% Anatase
4.72% Rutile
3.791 9.528 20.355 96.35% Anatase
3.65% Rutile
a)
calculated with Bragg's equation with tetragonal system[14] b)
calculated with Scherrer equation [14] c)calculated with Spur-Myers equation [14]
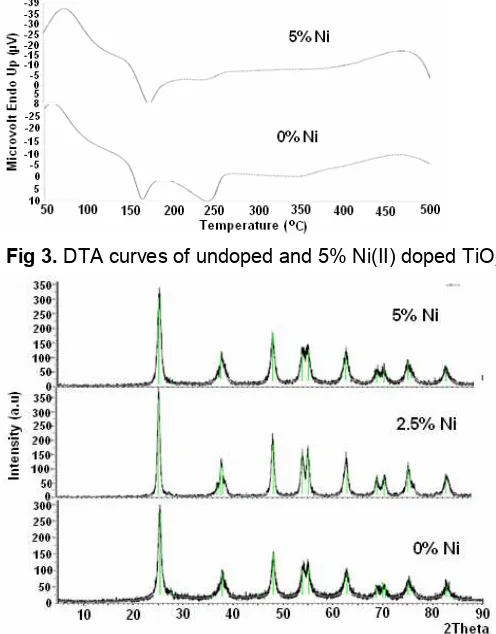
Fig 3.DTA curves of undoped and 5% Ni(II) doped TiO2
Fig 4. XRD patterns of Ni(II)-doped and undoped TiO2
after calcination at 500 °C
undoped and 5% Ni/Ti doped TiO2. The total weight loss
in the whole temperature range was 40% for undoped and 45% for 5% Ni/Ti doped. Both thermogram showed that significant decrease of weight occurred at temperature ranging from 50 to 200 °C due to the desorption of physisorbed water (Tbp:100 °C), Acac-H
(Tbp:138 °C) and isopropanol (Tbp:82 °C). Relatively
small decrease of weight after 200–350 °C was possibly resulted from desorption of unhydrolyzed precursor remained in TiO2 [8]. From temperature 350 to 500 °C,
there is much slower of about 5 and 8% weight loss of
the undoped and Ni doped TiO2, respectively due to
crystallization of these nanoparticles.
The DTA curve in Fig. 3, showed endothermic peaks up to 150 °C due to the desorption of the physisorbed water and solvent. The relatively small endothermic peak at 250 °C is possibly resulted from desorption of unhydrolyzed TTiP. This curve also shows a small exothermic peak at about 350 °C, which is possibly because of the phase transformation from amorphous to anatase. The DTA curve also shows a significant exothermic peak start at about 500 °C, which is possibly due to the phase transformation from anatase to rutile crystalline phase of TiO2 and this
result is consistent with the XRD data. The temperature transformation crystallization from anatase to rutile of Ni(II) doped TiO2 was ~475 °C slightly lower than that
of undoped TiO2 (~500 °C). Crisan et al. [9] reported
that the exothermic effect without mass loss, at about 675 °C was assigned for transformation of crystal phase from anatase to rutile.
Lattice parameter characterization
The crystalline phase and composition of Ni-doped TiO2 were studied by X-ray powder diffraction
(XRD). Fig. 4 showed XRD patterns for Ni-doped TiO2
after calcination at 500 °C. The particle size of the prepared samples and crystal phase were determined from XRD data using Scherrer’s formula and Spur-Myers equation respectively, as shown in Table 2. The XRD pattern of 2.5% Ni doped TiO2 shows that the
peak intensity of anatase increases and the width of the [101] diffraction peak of anatase phase
(2θ = 25°–26°) becomes narrower. This suggests that the particle size of Ni-doped TiO2 nanoparticles
increases by doping Ni(II) at certain concentration. The lattice parameters of doped and undoped TiO2 are listed in Table 2. It is shown that Ni(II)-doped
TiO2 resulted in the increased average particle size
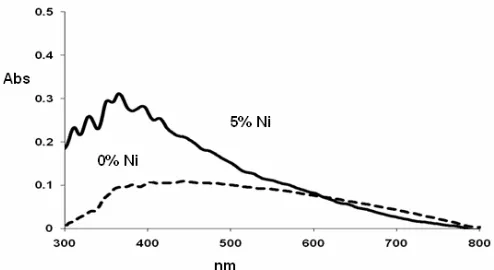
Fig 5. UV-Vis absorption spectra of Ni doped and undoped TiO2
resulted in an enlargement of the average particle size since the radius of Ni2+ (72pm) is higher than Ti4+(68 pm).
Ni2+ would increase the number of oxygen vacancies in the TiO2 crystal structure. These oxygen
vacancies are responsible for the enhancement of the transformation from anatase to rutile. Therefore Ni doped TiO2 should have increased ratio of rutile to
anatase, however our results are contrary. This is possibly due to the calcination temperature at 500 °C. Crisan et al. [9] reported that transformation from anatase to rutile assigned at temperature about 675 °C.
Band Edge Characterization
The UV-Vis absorption spectra in Fig. 5 showed that both the undoped and 5% Ni doped TiO2 are
photoactive under visible light irradiation. Usually, band gap energy (Eg) values reported in the literature for anatase are around 3.2 eV, whilst 3.0 eV for pure rutile phase [2]. In this work, the addition of 5% mol Ni(II) in TiO2 resulted slightly lower band gap and higher
absorption than the undoped TiO2. The band gap of the
samples was determined by the equation of
Eg = 1239.8 /λ [11]; where Eg is the band gap (eV) andλ (nm) is the wavelength of the absorption edge in the spectrum. The absorption edge of the undoped TiO2
occurs at 453 nm, and its band gap energy is estimated about 2.73 eV. While the absorption edge of the 5% Ni(II) doped TiO2 is 495 nm, and its corresponding
band gap energy is estimated of 2.51 eV.
Mu et al. [12] reported that a comparison of optical energy gap between undoped TiO2 and Ni-doped TiO2
thin films by using chemical solution deposition shows an obvious red shift in Ni doped TiO2 (band gap of
undoped is 3.67 eV and 15% Ni doped is 3.36 eV). Kim et al. [13] with computer simulation reported that when Ni2+atom was substituted for Ti4+site of TiO2lattice, two
additional unoccupied 3d states appeared as defect states in band gap, and occupied 3d states were
hybridized with oxygen 2p states. From the calculation of band decomposed charge density and density of states, it was found that the lower defect state (D1), a Ni 3d-orbital, was hybridized with unoccupied oxygen 2p states and the higher one (D2), localized 3d-orbital of Ni, was located at the middle of band gap. Carp et al. [5] reported that substitution of Ti4+ by dn metallic ions in the TiO2 lattice creates allowed energy
states in the band gap of TiO2, which may induce
photoactive transitions in the visible light, due to an excitation of an electron from this energy level into TiO2
conduction band.
CONCLUSION
Ni(II) doped TiO2 nanoparticles exhibiting
photoactive absorption under visible light irradiation were successfully prepared by sol-gel technique followed by calcination at 500 °C. Clearly, concentration of Ni(II) plays a significant role in the spectra absorption of nanosol, formation of the crystal structure, particle size and band edge absorption. Addition of 5% Ni/Ti revealed that absorbance of the corresponding nanosol spectra increased from 0.811 (λmax: 342 nm) to 2.283 (λmax: 350 nm). Crystallization temperaturen from anatase to rutile decreased from 500 °C to 475 °C. The particle size increased from 18.51 nm to 20.35 nm, while the band gap energy decreased from 2.73 eV to 2.51 eV.
ACKNOWLEDGEMENT
This work has been supported by the Ministry of Industrial of Indonesia under the enhancement of human resources program.
REFERENCES
1. Fujishima, A., Hashimoto, K. and Watanabe, T., 1996, TiO2 Photocatalysis Fundamentals and
Applications, BKC inc., Tokyo.
2. Linsebigler, A.L., Lu, G., and Yates, J.T., 1995,
Chem. Rev., 95, 735–758.
3. Hwang, K.S., Jeong, J.H., Ahn, J.H., and Kim, B.H., 2006,Ceram. Int., 32, 935–937.
4. Wilke, K., and Breuer, H.D., 1999, J. Photochem. Photobiol. A, 121, 5, 49–53.
5. Carp, O., Huisman, C.L., and Reller, A., 2004,
Prog. Solid State Chem., 32, 1-2, 33–177.
6. Maeda, M., and Yamada, T., 2007,J. Phys. Conf. Ser., 61, 755–759.
8. Huang, Y.U., Xuxu, Z., Zhongyi, Y., Feng, T., Beibei, F., and Keshan, H., 2007,Chin.J. Chem. Eng., 15, 6, 802–807.
9. Crisan, M., Jitianu, A., Crisan, D., Balasoiu, M., Dragan, N., and Zaharescu, M., 2000, J. Optoelectron Adv. Mater., 2, 4, 339–344.
10. Jing, D., Zhang, Y., and Guo, L., 2005,Chem. Phys. Lett.,415, 1-3, 74–78.
11. Skoog, D.A., and West, D.M., 1980, Principles of Instrumental Analysis, 2nded., Saunders College.
12. Lim, Y-M., Jeong, J-H., An, K-H., Jeon, Y-S., Jeon, K-O., Hwang, K-S., and Kim, B-H., 2005,J. Ceram. Process. Res., 6, 4, 302–304.
13. Kim, Y.S., Chung, Y.C., and Lee, K.S., 2006, J Electroceram., 17, 2-4, 951–953.