CYTOTOXIC ISOBRACTATIN (PRENYLATED XANTHONE) EPIMER MIXTURE
OF
Garcinia eugenifolia
Sri Hartati
1,*, I Ketut Triyono
2, and Sri Handayani
31
Research Center for Chemistry - Indonesian Institute of Sciences (LIPI), Kawasan PUSPIPTEK Serpong, Tangerang Selatan, Banten 15314, Indonesia
2
High School 96 Jakarta, Jl. Jati Raya No. 40, Cengkareng Barat, Jakarta Barat, DKI Jakarta 11840, Indonesia
3
Research Center for Chemistry - Indonesian Institute of Sciences (LIPI), Jl. Cisitu – Sangkuriang Bandung 40135, Indonesia
Received February 13, 2014; Accepted July 23, 2014
ABSTRACT
In search of bioactive anti-cancer compounds from natural products has been found isobractatin from n-hexane extract of Garcinia eugenifolia. Isolation was done through the stages of maceration and column chromatography. Elucidation of the structure was analyzed by spectroscopy of UV-Vis, FTIR, LC-MS, NMR proton and carbon one and two dimension data. The results found three compounds isolated from G. eugenifolia. The three compounds were stigmasterol, prenylated xanthone isobractatin and its epimer (in a mixture). The mixture of isobractatin and its epimer showed cytotoxic activity against breast cancer cell line T47D with IC50= 17 µg/mL.
Keywords:Garcinia eugenifolia; isobractatin; epimer; breast cancer; T47D cells
ABSTRAK
Dalam penelitian senyawa bioaktif anti kanker dari bahan alam telah ditemukan isobractatin dari ekstrak n-heksana Garcinia eugenifolia. Isolasi dilakukan melalui tahap-tahapan maserasi dan kromatografi kolom. Elusidasi struktur dilakukan melalui analisa data spektroskopi UV-Vis, FTIR, LC-MS dan NMR proton, karbon satu dan dua dimensi. Hasil isolasi dari G. eugenifolia diperoleh tiga senyawa. Ketiga senyawa tersebut adalah stigmasterol, xanton terfrenilasi (adalah campuran) isobractatin dan senyawa epimernya. Senyawa isobractatin dan campuran epimernya menunjukkan aktivitas sitoksit terhadap sel kanker payudara T47D dengan IC50= 17 µg/mL.
Kata Kunci:Garcinia eugenifolia; isobractatin; epimer; kanker payudara; sel T47D
INTRODUCTION
Cancer is a class of diseases characterized by out-of-control cell growth. Any practical solution in combating this disease is importance to public health. Many herbs have been evaluated in clinical studies and are currently being investigated phytochemically to understand their anti-tumor actions against various cancers [1]. Breast carcinoma (BC) is commonest cancer among women and the second highest caused of the cancer death [2]. Worldwide, breast cancer accounts for 22.9% of all cancer (excluding non melanoma skin cancer) in women [3]. Most cases occur during age 45–55. It also occurs in men but is more than 100-fold less frequent than in women [4-5]. The genus Garcinia (Clusiaceae) which is encountered mainly in lowland rain forests of the tropical World has been extensively investigated from phythochemical and biological point of view. This family rich source benzophenone and xanthones [6], phrenylated xanthones, triterpenes and biflavonoids
Table 1. δ 13C-NMR data compound 1 compared with δ 13
C-NMR Stigmasterol data [9] C
the bark of G. eugenifolia. The development of new therapeutic approach to breast cancer remains one of the most challenging areas in cancer research. Many tropical plants have interesting biological activities with potential therapeutic applications [3].
In this paper, we report the isolation, structure elucidation and biological evaluation on T47D cell culture of the mixture compound.
EXPERIMENTAL SECTION
Materials
Plant material of bark of G. eugenifolia was taken from the village Kalampangan, District Sebangau, District Palangkaraya, Central Kalimantan. The voucher specimen was identified and deposited in Herbarium Bogoriense Research Center for Biology LIPI, Cibinong Bogor Indonesia.
Instrumentation
Melting point was determined by using melting point apparatus and was uncorrected, UV spectra were
measured on Hewlett-Packard (HP) 8453A, IR spectra was measures on diode array spectrophotometer FTIR Prestige-21, Shimadzu. NMR Spectra were recorded on 500 MHz for 1H-NMR and 125 MHz for 13C-NMR), Varian, Inova Plus, With TMS as internal standard in CDCL3 as solvent. For molecule weight was measure
on LC-MS, mariner Biospectrometry spectrometer using ESI system (electro ionization) and positive ion mode, Hitachi L-6200, Asquire 3000 plus-01073, Shimadzu.
Procedure
Extraction and isolation
The ground dried stem barks of G. eugenifolia (2.507 kg) was maceration withn-hexane (3 x 3 L), the n-hexane soluble part was evaporated under reduce pressure to give a yellow solid (23 g). This was further fractionated (20 g) by column chromatography to yield five fractions. Fraction 1 (2.14 g), fraction 2 (3.87 g) contain white crystal less soluble on MeOH further soluble compound be separated by decantation gave pure white crystal (0.125 g), fraction 3 yellow powder (4.32 g), fraction 4 (5.05 g) and fraction 5 (3.18 g). Fraction 3 subjected to column chromatography on silica gel 60 and eluted withn-hexane : ethyl acetate as gradient resulting yellow crystal isobractatin and epi-isobractatin (2,3) (0.754 g).
Sulphorhodamine B colorimetry for cytotoxic assay The quantitative sulphorhodamine B (SRB) colorimetric assay was used to determine the anticancer activity of T47D human breast cancer cells. Cells were seeded into a 96-well plate with 3000 cells per well and incubated at 37 °C for 24 h. The cells were treated with various concentrations of the sample (0-100 µg/mL) with doxorubicin as a positive control for another 24 h. After that, the cells then fixed with 10% trichloro acetic acid for 30 min at 4 °C, followed by drying in oven 50 °C for 1 h and staining for 30 min at room temperature with 4 mg/mL SRB solution. Afterwards, the cells were washed with 1% acetic acid for 4 times, followed by drying in oven 50 °C for 1 h and dissolved with 200 µL 10 mM buffered Tris base pH 8. Cell viability was measured by the optical density at 515 nm. The wells without samples were used as negative controls.
Percent viability was calculated as follows:
OD c
s
OD media
c % 100%
OD cell OD media ell ample
ell viability
OD = Optical Density
While the IC50 was calculated by linear regression
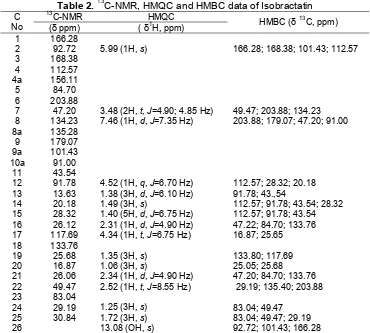
Table 2.13C-NMR, HMQC and HMBC data of Isobractatin
2 92.72 5.99 (1H,s) 166.28; 168.38; 101.43; 112.57 3 168.38
4 112.57 4a 156.11
5 84.70
6 203.88
7 47.20 3.48 (2H,t,J=4.90; 4.85 Hz) 49.47; 203.88; 134.23 8 134.23 7.46 (1H,d,J=7.35 Hz) 203.88; 179.07; 47.20; 91.00 8a 135.28
9 179.07 9a 101.43 10a 91.00
11 43.54
12 91.78 4.52 (1H,q,J=6.70 Hz) 112.57; 28.32; 20.18 13 13.63 1.38 (3H,d,J=6.10 Hz) 91.78; 43.,54
14 20.18 1.49 (3H,s) 112.57; 91.78; 43.54; 28.32 15 28.32 1.40 (5H,d,J=6.75 Hz) 112.57; 91.78; 43.54 16 26.12 2.31 (1H,d,J=4.90 Hz) 47.22; 84.70; 133.76 17 117.69 4.34 (1H,t,J=6.75 Hz) 16.87; 25.65 18 133.76
19 25.68 1.35 (3H,s) 133.80; 117.69
20 16.87 1.06 (3H,s) 25.05; 25.68
21 26.06 2.34 (1H,d,J=4.90 Hz) 47.20; 84.70; 133.76 22 49.47 2.52 (1H,t,J=8.55 Hz) 29.19; 135.40; 203.88 23 83.04
24 29.19 1.25 (3H,s) 83.04; 49.47
25 30.84 1.72 (3H,s) 83.04; 49.47; 29.19
26 13.08 (OH,s) 92.72; 101.43; 166.28
drug control was 16 nM on T47D cells.
RESULT AND DISCUSSION
Spectra UV, IR1H,13C-NMR and MS data
Compound (1): white crystal (needles) 125 mg, melting point 138-140 °C; UV spectra at max. 229 nm,
The IR spectra bend absorption at the frequencies () 3402-3226 cm-1, GC-MS (m/z=412). The 13C-NMR (CDCl3; 125 MHz) DEPT (δC=ppm); 12.29 (CH3); 12.50 gave molecular appear at m/z=464 (LC-MS). The
spectrum UV-Vis showed the absorbance maximum peak 355; 327; 259 and 247 nm. Melting point 191-192 °C. The IR spectrum are showed at () 3460 cm-1, 2908-2929 cm-1, 1637 and 1741 cm-1. The spectra 1H-NMR, 13C-NMR, HMQC and HMBC data were on Tables 2 and 3.
Compound (1): stigmasterol; white crystal (needles) 125 mg, melting point 138-140 °C. The UV absorption band at max 229 nm. The IR spectra
indicated the present of hydroxyl group bend absorption at the frequencies () 3402-3226 cm-1, molecule weight 412 and molecule formula is C29H48O. 13
C-NMR contain double bond at chemical shift (δ) 121.90 and 140.90 ppm was confirmed by1H-NMR at (δ) 5.16 ppm (dd, J=7.30 Hz) and 5.12 ppm (dd, J= 9.15 Hz). The present of hydroxyl on carbon number 3 confirmed by13C-NMR at (δ) 71.8 ppm with β hydroxy.
1
H-NMR (CDCl3, 500 MHz) have four methyl singlet at
(δH, ppm); 0.69 (3H, s); 0.78 (3H,s); 0.80 (3H, s) and
O
OH O
O
O O H
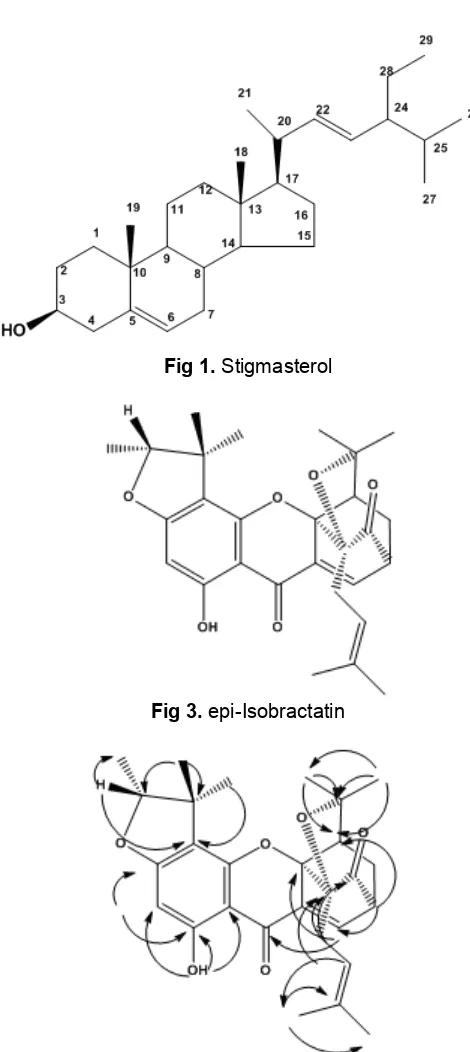
Fig 1.Stigmasterol Fig 2.Isobractatin
Fig 3.epi-Isobractatin Fig 4.HMBC correlation of Isobractatin
Fig 5.HMBC correlation of epi-Isobractatin
carbon with -hydroxyl group. Base on spectroscopic data (UV-Vis, FT-IR, 1H-NMR and 13C-NMR) and compared with authentic sample also compared with literature data as Table 1 [17], that compound concluded as stigmasterol.
Compounds (2) and (3): 0.754 g yellow crystal gave molecular peak at m/z at 464 (LC-MS) corresponding to the molecule formula C28H33O6. The
spectrum UV-Vis showed the absorbance maximum peak at 355; 327; 259 and 247 nm, peaks at that absorbance showed that compound have xanthone skeleton [18]. Melting point 191-192 °C. IR spectrum exhibited absorption bands at 3460 cm-1 (hydroxyl group), indicated the presence of two ketone function are showed at () 1637 (ortho hydroxyl chelated carbonyl group) and 1741 cm-1(unconjugated carbonyl group). Both of these compounds can be identified because it can be tracked through proton and carbon NMR data from HMQC and HMBC were quite clear. Spectrum 1H-NMR and 13CNMR of compound2 and 3
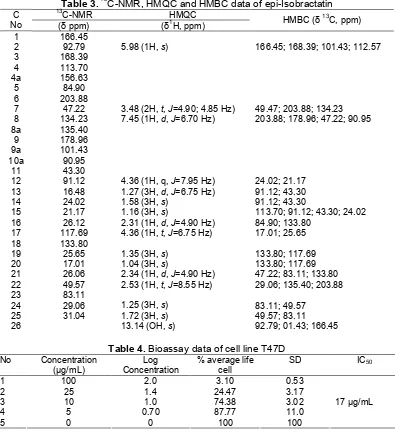
Table 3.13C-NMR, HMQC and HMBC data of epi-Isobractatin
13
C-NMR HMQC
C
No (δ ppm) (δ1H, ppm) HMBC (δ
13
C, ppm)
1 166.45
2 92.79 5.98 (1H,s) 166.45; 168.39; 101.43; 112.57
3 168.39
4 113.70
4a 156.63
5 84.90
6 203.88
7 47.22 3.48 (2H,t,J=4.90; 4.85 Hz) 49.47; 203.88; 134.23 8 134.23 7.45 (1H,d,J=6.70 Hz) 203.88; 178.96; 47.22; 90.95
8a 135.40
9 178.96
9a 101.43
10a 90.95
11 43.30
12 91.12 4.36 (1H, q,J=7.95 Hz) 24.02; 21.17 13 16.48 1.27 (3H,d,J=6.75 Hz) 91.12; 43.30
14 24.02 1.58 (3H,s) 91.12; 43.30
15 21.17 1.16 (3H,s) 113.70; 91.12; 43.30; 24.02 16 26.12 2.31 (1H,d,J=4.90 Hz) 84.90; 133.80
17 117.69 4.36 (1H,t,J=6.75 Hz) 17.01; 25.65
18 133.80
19 25.65 1.35 (3H,s) 133.80; 117.69
20 17.01 1.04 (3H,s) 133.80; 117.69
21 26.06 2.34 (1H,d,J=4.90 Hz) 47.22; 83.11; 133.80 22 49.57 2.53 (1H,t,J=8.55 Hz) 29.06; 135.40; 203.88
23 83.11
24 29.06 1.25 (3H,s) 83.11; 49.57
25 31.04 1.72 (3H,s) 49.57; 83.11
26 13.14 (OH,s) 92.79; 01.43; 166.45
Table 4.Bioassay data of cell line T47D No Concentration
(µg/mL)
Log Concentration
% average life cell
SD IC50
1 100 2.0 3.10 0.53
2 25 1.4 24.47 3.17
3 10 1.0 74.38 3.02
4 5 0.70 87.77 11.0
5 0 0 100 100
17 µg/mL
signals at 2.32 (2H, 16), 4.36 (t, H, 17), 1.35 (3H, 19) and 1.03 (3H, 20) for compound 3. Contain one OH chelated at 13.08 (2) and 13.14 ppm (3), one proton aromatic at 5.98 (H, 2), (2) and 5.95 ppm (H, 2) (3). The HMBC correlation of compound (2) and (3) showed at Fig. 4 and 5.
Cytotoxic Activity
The result showed that the IC50value of the mixture
of isobractatin and its epimer was 17 µg/mL. The graphic of concentration vs. cells viability (Fig. 6) showed that increasing of samples concentration significantly decreases cells viability compared to control (P<0.05). Based on the result, the mixture of isobractatin and its epimer has cytotoxic activity against T47D breast cancer
Fig 6. Percentage of viable cells of the mixture of isobractatin and its epimer in various concentrations after 24 h. Samples are conducted in triplicate and represented in mean + standard deviation. * represented significantly differences compare to control (P < 0.05)
We suggest that isobractatin from G. eugenifolia also inhibit T47D breast cancer cells growth through this pathway. Nevertheless, further investigation is needed to explore the mechanism of cytotoxic activity of isobractatin on T47D cancer cell.
CONCLUSION
Similar to several other Garcinia species such as G. morrela, G. hanburyi, G. gaudichaudii, G. bracteata, G. cantlyanaand G. eugenifolia also elaborated caged-xanthones [22]. From this investigation, the xanthone from G. eugenifolia seemed to be derived from mono– prenylated xanthone as mixture compound of epimer isobractatin. The mixture compound of epimer isobractatin showed cytotoxic activity against T47D breast cancer cell line with IC50=17 µg/ mL.
REFERENCES
1. Sharma, H., Parihar, L., and Parihar, P., 2011, J. Med. Plants Res., 5 (10), 1818–1835.
2. Merrill, R.M., and Weed, D.L., 2001, Ann. Epidemiol., 11 (8), 547–553.
3. Moongkarndi, P., Kosem, N., Kaslungka, S., Luanratana, O., Pongpan, N., and Neungton, N., 2004,J. Ethnopharmacol., 90 (1), 161–166.
4. World Cancer Report, International Agency for Research on cancer, 2008, Retrieved 2014-01-09. 5. Male Breast Cancer Treatment: National Cancer
Institute, 2011, retrieved, 2014-01-09.
6. Harrison, L.J., Leong, L-S., Leong, Y-W., Sia, G-L., Sim, K-Y., and Tan, H.T-W., 1994,Nat. Prod. Lett., 5 (2), 111–116.
7. Thoison, O., Fahy, J., Dumontet, V., D., Chiaroni, A., Riche, C., Tri, M.V., and Sévenet T, 2000, J. Nat. Prod., 63 (4), 441–446.
8. Huang, S-X., Feng, C., Zhou, Y., Xu, G., Han, Q-B., Qiao, C-F., Chang, D.C., Luo, K.Q., and Xu, H-X., 2009,J. Nat. Prod., 72 (1), 130–135.
9. Xu, G., Feng, C., Zhou, Y., Han, Q-B., Qiao, C-F., Huang, S-X., Chang, D.C., Zhao, Q-S., Luo, K.Q., and Xu, H-X., 2008,J. Agric. Food Chem., 56 (23), 11144–11150.
10. Han, Q-B., Tian, H-L., Yang, N-Y., Qiao, C-F., Song, J-C., Chang, D.C., Luo, K.Q., and Xu, H-X., 2008,Chem. Biodivers., 5, 2710–2717.
11. Han, Q-B., Zhau, Y., Feng, C., Xu, G., Huang, S-X., Li, S-L., Qiao, C-F., Song, J-Z., Chang, D.C., Luo, K.Q., and Xu, H-X., 2009, J. Chromatogr. B, 877 (4), 401–408.
12. Yang, N-Y, Han, Q-B., Cao, X-W., Qiao, C-F., Song, J-Z., Chen S-L., Yang, D-J., Yiu, H., and Xu, H-X., 2007,Chem. Pharm. Bull., 55 (6), 950–952. 13. Gao, X-M, Yu, T., Lai, F.S.F., Zhao, Y., Liu, X.,
Qiao, C-F., Song, J-Z., Chen, S-L., Luo, K.Q., and Xu, H-X., 2010, Bioorg. Med. Chem., 18 (14), 4957–4964.
14. Chao, J.C.J., and Chu, C.C., 2004, World J. Gastroenterol., 10 (1), 37–41.
15. Taher, M., Idris, M.S., and Arbain, D., 2007,Iran. J. Pharmacol. Ther., 6 (1), 93–98.
16. Skehan, P., Storeng, R., Scudiero, D., Monks, A., McMahon, J., Vistica, D., Warren, J.T., Bokesch, H., Kenney, S., and Boyd, M.R., 1990, J. Nat. Cancer Inst., 82 (13), 1107–1112.
17. Goad, J., and Akihisa, T., 1997,Analysis of Sterols, Blackie Academic & Professional, London.
18. Harborne, J.B., 1998, Phytochemical Methods: a Guide to Modern Techniques of Plant Analysis, 3rd ed., Thompson Science, London, UK.
19. Castanheiro, R.A.P., Silva, A.M.S., Campos, N.A.N., Nascimento, M.S.J., and Pinto, M.M.M., 2009,Pharmaceuticals,2 (2), 33–43.
20. Akao, Y., Nakagawa, Y., Iinuma, M., and Nozawa, Y., 2008,Int. J. Mol. Sci., 9 (3), 355–370.
21. Wu, X., Cao, S., Goh, S., Hsu, A., and Tan, B.K., 2002,Planta Med., 68 (3), 198–203.
![Table 1. δ δ 13C-NMR data compound 1 compared with13C-NMR Stigmasterol data [9]1313](https://thumb-ap.123doks.com/thumbv2/123dok/873198.821116/2.595.49.297.135.460/table-nmr-data-compound-compared-with-nmr-stigmasterol.webp)