LAMPIRAN A
HASIL PENETAPAN STANDARISASI PARAMETRIK DAN
NON-PARAMETRIK EKSTRAK AIR BUAH TOMAT (
LYCOPERSICUM
ESCULENTUM
M.)
STANDARISASI PARAMETRIK
1.
Penetapan Kadar Sari Larut Air
Replikasi Beratekstrak (g)
Berat cawan (g)
Berat cawan + residu
konstan (g) % Kadar
1 5,0175 42,0660 42,9864 91,72
2 5,0019 44,7534 45,6890 93,53
3 5,0066 43,2439 44,1583 91,32
92,19 1,18
Contoh perhitungan replikasi 1
2.
Penetapan Kadar Sari Larut Etanol
Replikasi Beratekstrak (g)
Berat cawan (g)
Berat cawan + residu
konstan (g) % Kadar
1 5,0018 42,0656 42,0710 0,54
2 5,0024 44,7535 44,7616 0,81
3 5,0016 43,2441 43,2491 0,50
STANDARISASI NON-PARAMETRIK
1.
Kadar Air
Replikasi Berat cawan (g)
Berat cawan + ekstrak (g)
Berat ekstrak (g) Berat cawan + ekstrak konstan (g) % Kadar
1 29,1919 39,2172 10,0253 38,8860 3,30
2 35,5190 45,5878 10,0688 45,2685 3,17
3 44,3373 54,3406 10,0033 54,0137 3,27
3,25 0,07
Contoh perhitungan replikasi 1
2.
Susut Pengeringan
Replikasi Beratbotol (g)
Berat botol + ekstrak (g) Berat ekstrak (g) Berat botol + ekstrak konstan (g) % Kadar
1 12,6136 13,6301 1,0165 13,6083 2,14
2 12,9396 13,9361 0,9965 13,9127 2,35
3 14,7464 15,7449 0,9985 15,7155 2,94
2,48 0,41
Contoh perhitungan replikasi 1
3.
Kadar Abu Total
Replikasi Beratkrus (g)
Berat krus + ekstrak (g)
Berat ekstrak (g)
Berat krus + abu konstan
(g)
% Kadar
1 29,2348 32,2403 3,0055 29,2544 0,65
2 32,4680 35,4722 3,0042 32,4830 0,50
3 29,0934 32,0932 2,9998 29,1135 0,67
4.
Kadar Abu Larut Air
Replikasi Beratkrus (g)
Berat ekstrak (g)
Berat krus + abu konstan
(g)
Berat krus + abu larut air konstan (g)
% Kadar
1 29,2348 3,0055 29,2544 29,2443 0,32
2 32,4680 3,0042 32,4830 32,4776 0,32
3 29,0934 2,9998 29,1135 29,1025 0,30
0,31 0,01
Contoh perhitungan replikasi 1
5.
Kadar Abu Tidak Larut Asam
Replikasi krus (g) Berat ekstrak (g) BeratBerat krus + abu konstan
(g)
Berat krus + abu tdk larut konstan (g)
% Kadar
1 27,8198 3,0369 27,8350 27,8250 0,17
2 25,3685 3,0342 25,3951 25,3734 0,16
3 28,9809 3,0042 29,0055 28,9867 0,19
LAMPIRAN B
PERHITUNGAN KONVERSI EKSTRAK
Serbuk ekstrak buah tomat yang digunakan merupakan campuran antara
ekstrak tomat dengan pengering (maltodekstrin).
Rasio ekstrak tomat : pengering = 2,8 : 1
Contoh perhitungan:
LAMPIRAN C
HASIL UJI EFEKTIVITAS EKSTRAK AIR BUAH TOMAT
Perhitungan Nilai SPF Ekstrak Air Buah Tomat dengan Metode Mansur, et
al. (1986)
Keterangan: CF = faktor koreksi (dengan nilai konstan yaitu 10) EE = Spektrum efek eritema
I = Spektrum intensitas solar Abs = Absorbansi sampel
Nilai EE x I untuk tiap panjang gelombang telah ditetapkan oleh Sayre, et
al. (1979) sebagai berikut.
Panjang gelombang (λ) Nilai EE X I (normalized)
290 0,0150
295 0,0817
300 0,2874
305 0,3278
310 0,1864
315 0,0839
320 0,0180
Total 1
Contoh perhitungan:
C 10%Replikasi 1
λ (nm) Absorbansi (A)
290 0,333
295 0,327
300 0,320
305 0,314
310 0,307
315 0,301
Perhitungan konsentrasi larutan uji ekstrak 10%
Perhitungan konsentrasi larutan uji ekstrak 15%
Perhitungan konsentrasi larutan uji ekstrak 10%
Ekstrak tomat 1 gram larutkan 3 ml aquades↓
Ad 10 ml etanol p.a (100000 ppm)
↓ Pipet 20 μL
↓
Ad 10 ml etanol p.a (200 ppm)
Ekstrak tomat 2 gram larutkan 3 ml aquades
↓
Ad 10 ml etanol p.a (200000 ppm)
↓ Pipet 10 μL
↓
Ad 10 ml etanol p.a (200 ppm)
Ekstrak tomat 1,5 gram larutkan 3 ml aquades
↓
Ad 10 ml etanol p.a (150000 ppm)
↓ Pipet 13 μL
↓
Nilai SPF untuk konsentrasi ekstrak air buah tomat 10%
C 10% Replikasi 1
λ (nm) Absorbansi (A) EE x I EE x I x A
290 0,333 0,0150 0,00500
295 0,327 0,0817 0,02672
300 0,320 0,2874 0,09197
305 0,314 0,3278 0,10293
310 0,307 0,1864 0,05722
315 0,301 0,0839 0,02525
320 0,298 0,0180 0,00536
Σ 0,31445
SPF 3,14
C 10% Replikasi 2
λ (nm) Absorbansi (A) EE x I EE x I x A
290 0,362 0,0150 0,00543
295 0,353 0,0817 0,02884
300 0,347 0,2874 0,09973
305 0,340 0,3278 0,11145
310 0,334 0,1864 0,06226
315 0,329 0.0839 0.02760
320 0.321 0.0180 0.00578
Σ 0.34109
SPF 3.41
C 10% Replikasi 3
λ (nm) Absorbansi (A) EE x I EE x I x A
290 0.347 0.0150 0.00521
295 0.342 0.0817 0.02794
300 0.337 0.2874 0.09685
305 0.331 0.3278 0.10850
310 0.322 0.1864 0.06002
315 0.318 0.0839 0.02668
320 0.312 0.0180 0.00562
Σ 0.33082
SPF 3.31
Nilai SPF untuk konsentrasi ekstrak air buah tomat 15%
C 15% Replikasi 1
λ (nm) Absorbansi (A) EE x I EE x I x A
290 0,358 0,0150 0,00537
295 0,354 0,0817 0,02892
300 0,345 0,2874 0,09915
305 0,339 0,3278 0,11112
310 0,336 0,1864 0,06263
315 0,332 0,0839 0,02785
320 0,329 0,0180 0,00592
Σ 0,34098
SPF 3,41
C 15% Replikasi 2
λ (nm) Absorbansi (A) EE x I EE x I x A
290 0,382 0,0150 0,00573
295 0,377 0,0817 0,03080
300 0,372 0,2874 0,10691
305 0,368 0,3278 0,12063
310 0,363 0,1864 0,06766
315 0,359 0,0839 0,03012
320 0,354 0,0180 0,00637
Σ 0,36823
SPF 3,68
C 15% Replikasi 3
λ (nm) Absorbansi (A) EE x I EE x I x A
290 0,376 0,0150 0,00564
295 0,372 0,0817 0,03039
300 0,366 0,2874 0,10519
305 0,363 0,3278 0,11899
310 0,359 0,1864 0,06692
315 0,355 0,0839 0,02978
320 0,35 0,0180 0,00630
Σ 0,36321
SPF 3,63
Nilai SPF untuk konsentrasi ekstrak air buah tomat 20%
C 20% Replikasi 1
λ (nm) Absorbansi (A) EE x I EE x I x A
290 0,415 0,0150 0,00623
295 0,412 0,0817 0,03366
300 0,409 0,2874 0,11755
305 0,406 0,3278 0,13309
310 0,404 0,1864 0,07531
315 0,402 0,0839 0,03373
320 0,399 0,0180 0,00718
Σ 0,40673
SPF 4,07
C 20% Replikasi 2
λ (nm) Absorbansi (A) EE x I EE x I x A
290 0,401 0,0150 0,00602
295 0,399 0,0817 0,03260
300 0,397 0,2874 0,11410
305 0,395 0,3278 0,12948
310 0,392 0,1864 0,07307
315 0,390 0,0839 0,03272
320 0,389 0,0180 0,00700
Σ 0,39498
SPF 3,95
C 20% Replikasi 3
λ (nm) Absorbansi (A) EE x I EE x I x A
290 0,388 0,0150 0,00582
295 0,386 0,0817 0,03154
300 0,384 0,2874 0,11036
305 0,383 0,3278 0,12555
310 0,382 0,1864 0,07120
315 0,379 0,0839 0,03180
320 0,376 0,0180 0,00677
Σ 0,38304
SPF 3,83
LAMPIRAN D
HASIL PENGUJIAN NILAI SPF SEDIAAN KRIM TABIR SURYA
EKSTRAK AIR BUAH TOMAT
Perhitungan Konsentrasi Larutan Uji Krim Tabir Surya Ekstrak Air
Buah Tomat
Sediaan Krim 1 gram larutkan 3 ml aquades
↓
Ad 10 ml etanol p.a (100000 ppm)
↓
Saring
↓ Pipet filtrat 20 μL
↓
Ad 10 ml etanol p.a (200 ppm)
↓
Baca Absorbansi
↓
F I / 1 Replikasi 1
λ (nm) Absorbansi (A) EE x I EE x I x A
290 0,332 0,0150 0,00498
295 0,321 0,0817 0,02623
300 0,313 0,2874 0,08996
305 0,305 0,3278 0,09998
310 0,299 0,1864 0,05573
315 0,293 0,0839 0,02458
320 0,289 0,0180 0,00520
Σ 0,30666
SPF 3,07
F I / 1 Replikasi 2
λ (nm) Absorbansi (A) EE x I EE x I x A
290 0,362 0,0150 0,00543
295 0,352 0,0817 0,02876
300 0,347 0,2874 0,09973
305 0,342 0,3278 0,11211
310 0,337 0,1864 0,06282
315 0,332 0,0839 0,02785
320 0,325 0,0180 0,00585
Σ 0,34255
SPF 3,43
F I / 1 Replikasi 3
λ (nm) Absorbansi (A) EE x I EE x I x A
290 0,321 0,0150 0,00482
295 0,318 0,0817 0,02598
300 0,314 0,2874 0,09024
305 0,311 0,3278 0,10195
310 0,308 0,1864 0,05741
315 0,303 0,0839 0,02542
320 0,297 0,0180 0,00535
Σ 0,31116
SPF 3,11
F I / 2 Replikasi 1
λ (nm) Absorbansi (A) EE x I EE x I x A
290 0,359 0,0150 0,00539
295 0,352 0,0817 0,02876
300 0,348 0,2874 0,10002
305 0,341 0,3278 0,11178
310 0,336 0,1864 0,06263
315 0,330 0,0839 0,02769
320 0,327 0,0180 0,00589
Σ 0,34214
SPF 3,42
F I / 2 Replikasi 2
λ (nm) Absorbansi (A) EE x I EE x I x A
290 0,333 0,0150 0,00500
295 0,323 0,0817 0,02639
300 0,314 0,2874 0,09024
305 0,306 0,3278 0,10031
310 0,297 0,1864 0,05536
315 0,294 0,0839 0,02467
320 0,291 0,0180 0,00524
Σ 0,30720
SPF 3,07
F I / 2 Replikasi 3
λ (nm) Absorbansi (A) EE x I EE x I x A
290 0,328 0,0150 0,00492
295 0,321 0,0817 0,02623
300 0,315 0,2874 0,09053
305 0,313 0,3278 0,10260
310 0,308 0,1864 0,05741
315 0,303 0,0839 0,02542
320 0,297 0,0180 0,00535
Σ 0,31246
SPF 3,12
F II / 1 Replikasi 1
λ (nm) Absorbansi (A) EE x I EE x I x A
290 0,326 0,0150 0,00489
295 0,321 0,0817 0,02623
300 0,314 0,2874 0,09024
305 0,308 0,3278 0,10096
310 0,301 0,1864 0,05611
315 0,296 0,0839 0,02483
320 0,291 0,0180 0,00524
Σ 0,30850
SPF 3,09
F II / 1 Replikasi 2
λ (nm) Absorbansi (A) EE x I EE x I x A
290 0,362 0,0150 0,00543
295 0,349 0,0817 0,02851
300 0,340 0,2874 0,09772
305 0,329 0,3278 0,10785
310 0,319 0,1864 0,05946
315 0,309 0,0839 0,02593
320 0,303 0,0180 0,00545
Σ 0,33035
SPF 3,30
F II / 1 Replikasi 3
λ (nm) Absorbansi (A) EE x I EE x I x A
290 0,340 0,0150 0,00510
295 0,333 0,0817 0,02721
300 0,326 0,2874 0,09369
305 0,321 0,3278 0,10522
310 0,317 0,1864 0,05909
315 0,311 0,0839 0,02609
320 0,307 0,0180 0,00553
Σ 0,32193
SPF 3,22
F II / 2 Replikasi 1
λ (nm) Absorbansi (A) EE x I EE x I x A
290 0,350 0,0150 0,00525
295 0,343 0,0817 0,02802
300 0,337 0,2874 0,09685
305 0,331 0,3278 0,10850
310 0,326 0,1864 0,06077
315 0,322 0,0839 0,02702
320 0,316 0,0180 0,00569
Σ 0,33210
SPF 3,32
F II / 2 Replikasi 2
λ (nm) Absorbansi (A) EE x I EE x I x A
290 0,358 0,0150 0,00537
295 0,346 0,0817 0,02827
300 0,335 0,2874 0,09628
305 0,326 0,3278 0,10686
310 0,316 0,1864 0,05890
315 0,305 0,0839 0,02559
320 0,299 0,0180 0,00538
Σ 0,32665
SPF 3,27
F II / 2 Replikasi 3
λ (nm) Absorbansi (A) EE x I EE x I x A
290 0,321 0,0150 0,00482
295 0,315 0,0817 0,02574
300 0,309 0,2874 0,08881
305 0,304 0,3278 0,09965
310 0,296 0,1864 0,05517
315 0,292 0,0839 0,02450
320 0,288 0,0180 0,00518
Σ 0,30387
SPF 3,04
F III / 1 Replikasi 1
λ (nm) Absorbansi (A) EE x I EE x I x A
290 0,349 0,0150 0,00524
295 0,340 0,0817 0,02778
300 0,333 0,2874 0,09570
305 0,326 0,3278 0,10686
310 0,320 0,1864 0,05965
315 0,314 0,0839 0,02634
320 0,308 0,0180 0,00554
Σ 0,32712
SPF 3,27
F III / 1 Replikasi 2
λ (nm) Absorbansi (A) EE x I EE x I x A
290 0,332 0,0150 0,00498
295 0,327 0,0817 0,02672
300 0,321 0,2874 0,09226
305 0,315 0,3278 0,10326
310 0,311 0,1864 0,05797
315 0,305 0,0839 0,02559
320 0,301 0,0180 0,00542
Σ 0,31619
SPF 3,16
F III / 1 Replikasi 3
λ (nm) Absorbansi (A) EE x I EE x I x A
290 0,335 0,0150 0,00503
295 0,326 0,0817 0,02663
300 0,321 0,2874 0,09226
305 0,315 0,3278 0,10326
310 0,309 0,1864 0,05760
315 0,302 0,0839 0,02534
320 0,297 0,0180 0,00535
Σ 0,31545
SPF 3,15
F III / 2 Replikasi 1
λ (nm) Absorbansi (A) EE x I EE x I x A
290 0,333 0,0150 0,00500
295 0,329 0,0817 0,02688
300 0,322 0,2874 0,09254
305 0,317 0,3278 0,10391
310 0,310 0,1864 0,05778
315 0,304 0,0839 0,02551
320 0,301 0,0180 0,00542
Σ 0,31704
SPF 3,17
F III / 2 Replikasi 2
λ (nm) Absorbansi (A) EE x I EE x I x A
290 0,351 0,0150 0,00527
295 0,343 0,0817 0,02802
300 0,335 0,2874 0,09628
305 0,327 0,3278 0,10719
310 0,322 0,1864 0,06002
315 0,315 0,0839 0,02643
320 0,311 0,0180 0,00560
Σ 0,32881
SPF 3,29
F III / 2 Replikasi 3
λ (nm) Absorbansi (A) EE x I EE x I x A
290 0,321 0,0150 0,00482
295 0,317 0,0817 0,02590
300 0,311 0,2874 0,08938
305 0,304 0,3278 0,09965
310 0,299 0,1864 0,05573
315 0,296 0,0839 0,02483
320 0,289 0,0180 0,00520
Σ 0,30552
SPF 3,06
Analisa Statistik Nilai SPF dengan independent t-test dan one way ANOVA
Formula Replikasi Bets 1 Bets 2 t hitung t tabel F hitung F tabelI
1 3,07 3,42
0 2,776
0,005 5,14
2 3,43 3,07
3 3,11 3,12
bets 3,20 0,20
3,20 0,19 formula 3,20 ± 0,17
II
1 3,09 3,32
-0,063 2,776
2 3,3 3,27
3 3,22 3,04
bets 3,20 0,11
3,21 0,15 formula 3,21 ± 0,12
III
1 3,27 3,17
0,261 2,776
2 3,16 3,29
3 3,15 3,06
bets 3,20 0,07
3,17 0,12 formula 3,18 ± 0,08
Uji Statistik SPF Antar Bets dengan independent t-test
Formula I
Group Statistics
bets N Mean Std. Deviation Std. Error Mean
SPF bets1 3 3.2033 .19732 .11392 bets2 3 3.2033 .18930 .10929
Independent Samples Test
Levene's
Test t-test for Equality of Means
95% Confidence
F Sig. t df Sig. (2-tailed)
Mean Difference
Std. Error
Difference Lower Upper
SPF
Equal variances
assumed .014 .910 .000 4 1.000 .00000 .15787 -.43831 .43831
Equal variances
Formula II
Group Statistics
bets N Mean Std. Deviation Std. Error Mean
SPF bets1 3 3.2033 .10599 .06119
bets2 3 3.2100 .14933 .08622
Independent Samples Test
Levene's
Test t-test for Equality of Means
95% Confidence
F Sig. t df Sig. (2-tailed)
Mean Difference
Std. Error
Difference Lower Upper
SPF Equal variances
assumed .751 .435 -.063 4 .953 -.00667 .10573 -.30021 .28687
Equal variances
not assumed -.063 3.607 .953 -.00667 .10573 -.31326 .29992
Formula III
Group Statistics
bets N Mean Std. Deviation Std. Error Mean
SPF bets1 3 3.1933 .06658 .03844 bets2 3 3.1733 .11504 .06642
Independent Samples Test
Levene's
Test t-test for Equality of Means
95% Confidence
F Sig. t df Sig.
(2-tailed)
Mean Difference
Std. Error
Difference Lower Upper
SPF Equal variances assumed
.456 .536 .261 4 .807 .02000 .07674 -.19306 .23306
Equal variances not assumed
Uji Statistik SPF dengan one way ANOVA
DescriptivesN Mean Std. Deviation
Std. Error
95% Confidence Interval for Mean
Minimum Maximum Lower
Bound
Upper Bound
Formula I 3 3.2033 .19732 .11392 2.7132 3.6935 3.07 3.43 Formula II 3 3.2033 .10599 .06119 2.9400 3.4666 3.09 3.30
Formula III 3 3.1933 .06658 .03844 3.0279 3.3587 3.15 3.27 Total 9 3.2000 .11694 .03898 3.1101 3.2899 3.07 3.43
Test of Homogeneity of Variances
Levene Statistic df1 df2 Sig.
3.109 2 6 .118
ANOVA
Sum of Squares df Mean Square F Sig.
Between Groups .000 2 .000 .005 .995 Within Groups .109 6 .018
Total .109 8
Multiple Comparisons
(I) Formula (J) Formula Mean Difference (I-J) Std. Error Sig. 95% Confidence Interval Lower Bound Upper Bound
Formula I Formula II .00000 .11015 1.000 -.2695 .2695 Formula III .01000 .11015 .931 -.2595 .2795
Formula II Formula I .00000 .11015 1.000 -.2695 .2695 Formula III .01000 .11015 .931 -.2595 .2795
LAMPIRAN E
HASIL PENGAMATAN ORGANOLEPTIS SEDIAAN KRIM TABIR
SURYA EKSTRAK AIR BUAH TOMAT
Parameter F I F II F III F 0 F 00
Bets 1 Bets 2 Bets 1 Bets 2 Bets 1 Bets 2
Warna PK PK PK PK PK PK PK P
Bentuk OP OP OP OP OP OP OP OP
Bau KT KT KT KT KT KT KT TB
Keterangan: PK= Putih Kejinggaan; P= Putih; OP= Opaque; KT= Khas Tomat; TB= Tidak Berbau.
Formula I
Bets 1
F 00
F 0
Formula I
Bets 2
Formula II
Bets 1
Formula II
Bets 2
Formula III
Bets 1
LAMPIRAN F
HASIL PENGUJIAN NILAI PH SEDIAAN KRIM TABIR SURYA
EKSTRAK AIR BUAH TOMAT
Formula Replikasi Bets 1 Bets 2 t hitung t tabel F hitung F tabel
I
1 6,30 6,30
2,412 2,776
1735,225 3,48
2 6,33 6,28
3 6,31 6,28
bets 6,31 0,015
6,29 0,012 formula 6,30 0,019
II
1 6,12 6,12
1,604 2,776
2 6,14 6,09
3 6,11 6,10
bets 6,12 0,015
6,10 0,015 formula 6,11 0,018
III
1 5,98 5,95
0,671 2,776
2 5,95 5,96
3 5,94 5,93
bets 5,96 0,021
5,95 0,015 formula 5,95 0,017
0
1 6,34
2 6,34
3 6,35
formula 6,34 0,006
00
1 6,99
2 7,01
3 6,97
formula 6,99 0,020
Uji Statistik pH Antar Bets dengan Independent T Test
Formula I
Group Statistics
bets N Mean Std. Deviation Std. Error Mean
Independent Samples Test
Levene's
Test t-test for Equality of Means
95% Confidence
F Sig. t df Sig.
(2-tailed)
Mean Difference
Std. Error
Difference Lower Upper
pH Equal variances assumed
.235 .653 2.412 4 .073 .02667 .01106 -.00403 .05736
Equal variances not assumed
2.412 3.723 .078 .02667 .01106 -.00495 .05828
Formula II
Group Statistics
bets N Mean Std. Deviation Std. Error Mean
pH bets1 3 6.1233 .01528 .00882 bets2 3 6.1033 .01528 .00882
Independent Samples Test
Levene's
Test t-test for Equality of Means
95% Confidence
F Sig. t df Sig. (2-tailed)
Mean Difference
Std. Error
Difference Lower Upper
pH Equal variances
assumed .000 1.000 1.604 4 .184 .02000 .01247 -.01463 .05463
Equal variances
not assumed 1.604 4.000 .184 .02000 .01247 -.01463 .05463
Formula III
Group Statistics
bets N Mean Std. Deviation Std. Error Mean
pH bets1 3 5.9567 .02082 .01202
Independent Samples Test
Levene's
Test t-test for Equality of Means
95% Confidence
F Sig. t df Sig. (2-tailed)
Mean Difference
Std. Error
Difference Lower Upper
pH
Equal variances
assumed .500 .519 .671 4 .539 .01000 .01491 -.03139 .05139
Equal variances
not assumed .671 3.670 .542 .01000 .01491 -.03290 .05290
Uji Statistik Nilai pH dengan One Way ANOVA
DescriptivesN Mean Std. Deviation
Std. Error
95% Confidence Interval for Mean
Minimum Maximum Lower
Bound
Upper Bound
Formula I 3 6.3133 .01528 .00882 6.2754 6.3513 6.30 6.33 Formula II 3 6.1233 .01528 .00882 6.0854 6.1613 6.11 6.14
Formula III 3 5.9567 .02082 .01202 5.9050 6.0084 5.94 5.98 Formula 0 3 6.3433 .00577 .00333 6.3290 6.3577 6.34 6.35 Formula 00 3 6.9900 .02000 .01155 6.9403 7.0397 6.97 7.01 Total 15 6.3453 .36387 .09395 6.1438 6.5468 5.94 7.01
Test of Homogeneity of Variances
Levene Statistic df1 df2 Sig.
.854 4 10 .523
ANOVA
Sum of Squares df Mean Square F Sig.
Between Groups 1.851 4 .463 1735.225 .000
Within Groups .003 10 .000
Multiple Comparisons
(I) Formula (J) Formula Mean Difference (I-J) Std. Error Sig. 95% Confidence Interval Lower Bound Upper Bound
Formula I
Formula II .19000* .01333 .000 .1603 .2197
Formula III .35667* .01333 .000 .3270 .3864
Formula 0 -.03000* .01333 .048 -.0597 -.0003
Formula 00 -.67667* .01333 .000 -.7064 -.6470
Formula II
Formula I -.19000* .01333 .000 -.2197 -.1603
Formula III .16667* .01333 .000 .1370 .1964
Formula 0 -.22000* .01333 .000 -.2497 -.1903
Formula 00 -.86667* .01333 .000 -.8964 -.8370
Formula III
Formula I -.35667* .01333 .000 -.3864 -.3270
Formula II -.16667* .01333 .000 -.1964 -.1370
Formula 0 -.38667* .01333 .000 -.4164 -.3570
Formula 00 -1.03333* .01333 .000 -1.0630 -1.0036
Formula 0
Formula I .03000* .01333 .048 .0003 .0597
Formula II .22000* .01333 .000 .1903 .2497
Formula III .38667* .01333 .000 .3570 .4164
Formula 00 -.64667* .01333 .000 -.6764 -.6170
Formula 00
Formula I .67667* .01333 .000 .6470 .7064
Formula II .86667* .01333 .000 .8370 .8964
Formula III 1.03333* .01333 .000 1.0036 1.0630
Formula 0 .64667* .01333 .000 .6170 .6764
LAMPIRAN G
HASIL PENGAMATAN HOMOGENITAS SEDIAAN KRIM TABIR
SURYA EKSTRAK AIR BUAH TOMAT
LAMPIRAN H
HASIL PENGUJIAN VISKOSITAS SEDIAAN KRIM TABIR SURYA
EKSTRAK AIR BUAH TOMAT
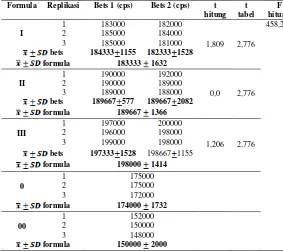
Formula Replikasi Bets 1 (cps) Bets 2 (cps) t hitung t tabel F hitung F tabel I
1 183000 182000
1,809 2,776
458,288 3,48
2 185000 184000
3 185000 181000
bets 184333 1155 182333 1528 formula 183333 1632
II
1 190000 192000
0,0 2,776
2 190000 189000
3 189000 188000
bets 189667 577 189667 2082 formula 189667 1366
III
1 197000 200000
1,206 2,776
2 196000 198000
3 199000 198000
bets 197333 1528 198667 1155 formula 198000 1414
0
1 175000
2 175000
3 172000
formula 174000 1732
00
1 152000
2 150000
3 148000
formula 150000 2000
Uji Statistik Viskositas Antar Bets dengan Independent T Test
Formula I
Group Statistics
bets N Mean Std. Deviation Std. Error Mean
viskositas bets1 3 184333.3333 1154.70054 666.66667
Independent Samples Test
Levene's
Test t-test for Equality of Means
95% Confidence
F Sig. t df Sig. (2-tailed) Mean Difference Std. Error
Difference Lower Upper
viskositas
Equal variances
assumed
.235 .653 1.809 4 .145 2000.00 1105.54160 -1069.4755 5069.4755
Equal variances not assumed
1.809 3.723 .150 2000.00 1105.54160 -1161.6467 5161.6467
Formula II
Group Statistics
bets N Mean Std. Deviation Std. Error Mean
viskositas bets1 3 189666.6667 577.35027 333.33333 bets2 3 189666.6667 2081.66600 1201.85043
Independent Samples Test
Levene's
Test t-test for Equality of Means
95% Confidence
F Sig. t df Sig. (2-tailed) Mean Difference Std. Error
Difference Lower Upper
viskositas Equal variances
assumed
5.000 .089 .000 4 1.000 .000 1247.21913 -3462.83545 3462.83545
Equal variances
not assumed
Formula III
Group Statistics
bets N Mean Std. Deviation Std. Error Mean
viskositas bets1 3 197333.3333 1527.52523 881.91710 bets2 3 198666.6667 1154.70054 666.66667
Independent Samples Test
Levene's
Test t-test for Equality of Means
95% Confidence
F Sig. t df Sig. (2-tailed)
Mean Difference
Std. Error
Difference Lower Upper
viskositas Equal variances
assumed
.235 .653 -1.206 4 .294 -1333.333 1105.54160 -4402.80889 1736.14222
Equal variances
not assumed
-1.206 3.723 .299 -1333.333 1105.54160 -4494.98004 1828.31337
Uji Statistik Viskositas dengan One Way ANOVA
DescriptivesN Mean Std.
Deviation Std. Error
95% Confidence Interval for Mean
Minimum Maximum Lower
Bound Upper Bound
Formula I 3 184333.333 1154.70054 666.6667 181464.8982 187201.7685 183000.0 185000.0 Formula II 3 189666.667 577.35027 333.3333 188232.4491 191100.8842 189000.0 190000.0 Formula III 3 197333.333 1527.52523 881.9171 193538.7503 201127.9164 196000.0 199000.0
Formula 0 3 174000.000 1732.05081 1000.0000 169697.3473 178302.6527 172000.0 175000.0 Formula 00 3 150000.000 2000.00000 1154.7005 145031.7246 154968.2754 148000.0 152000.0 Total 15 179066.667 17018.75716 4394.2242 169641.9931 188491.3402 148000.0 199000.0
Test of Homogeneity of Variances
Levene Statistic df1 df2 Sig.
ANOVA
Sum of Squares df Mean Square F Sig.
Between Groups 4.033E9 4 1.008E9 458.288 .000
Within Groups 2.200E7 10 2200000.000 Total 4.055E9 14
Multiple Comparisons
(I) Formula (J) Formula Mean Difference (I-J) Std. Error Sig. 95% Confidence Interval Lower Bound Upper Bound
Formula I
Formula II -5333.33333* 1211.06014 .001 -8031.7435 -2634.9232
Formula III -1.30000E4 1211.06014 .000 -15698.4102 -10301.5898
Formula 0 10333.33333* 1211.06014 .000 7634.9232 13031.7435
Formula 00 34333.33333* 1211.06014 .000 31634.9232 37031.7435
Formula II
Formula I 5333.33333* 1211.06014 .001 2634.9232 8031.7435
Formula III -7666.66667* 1211.06014 .000 -10365.0768 -4968.2565
Formula 0 15666.66667* 1211.06014 .000 12968.2565 18365.0768
Formula 00 39666.66667* 1211.06014 .000 36968.2565 42365.0768
Formula III
Formula I 13000.00000* 1211.06014 .000 10301.5898 15698.4102
Formula II 7666.66667* 1211.06014 .000 4968.2565 10365.0768
Formula 0 23333.33333* 1211.06014 .000 20634.9232 26031.7435
Formula 00 47333.33333* 1211.06014 .000 44634.9232 50031.7435
Formula 0
Formula I -1.03333E4 1211.06014 .000 -13031.7435 -7634.9232
Formula II -1.56667E4 1211.06014 .000 -18365.0768 -12968.2565
Formula III -2.33333E4 1211.06014 .000 -26031.7435 -20634.9232
Formula 00 24000.00000* 1211.06014 .000 21301.5898 26698.4102
Formula 00
Formula I -3.43333E4 1211.06014 .000 -37031.7435 -31634.9232
Formula II -3.96667E4 1211.06014 .000 -42365.0768 -36968.2565
Formula III -4.73333E4 1211.06014 .000 -50031.7435 -44634.9232
Formula 0 -2.40000E4 1211.06014 .000 -26698.4102 -21301.5898
LAMPIRAN I
HASIL PENGUJIAN DAYA SEBAR SEDIAAN KRIM TABIR
SURYA EKSTRAK AIR BUAH TOMAT
Formula Replikasi Bets 1 Bets 2 t hitung t tabel F hitung
F tabel
I
1 5,2 5,4
-0,426 2,776
206,9 3,48
2 5,2 5,0
3 4,9 5,1
bets 5,10 ± 0,17
5,17 ± 0,21 formula 5,13 0,18
II
1 5,2 5,3
1,342 2,776
2 5,3 5,1
3 5,3 5,1
bets 5,27 ± 0,06
5,17 ± 0,12 formula 5,22 0,10
III
1 5,3 5,6
-0,802 2,776
2 5,3 5,2
3 5,2 5,3
bets 5,27 ± 0,06
5,37 ± 0,21 formula 5,32 0,15
0
1 4,8
2 4,7
3 4,8
formula 4,77 ± 0,06
00
1 6,8
2 7,0
3 6,9
formula 6,9 ± 0,10
Uji Statistik Daya Sebar Antar Bets dengan Independent T Test
Formula I
Group Statistics
bets N Mean Std. Deviation Std. Error Mean
Independent Samples Test
Levene's
Test t-test for Equality of Means
95% Confidence
F Sig. t df Sig. (2-tailed)
Mean Difference
Std. Error
Difference Lower Upper
daya sebar
Equal variances
assumed .143 .725 -.426 4 .692 -.06667 .15635 -.50076 .36742
Equal variances
not assumed -.426 3.872 .692 -.06667 .15635 -.50647 .37314
Formula II
Group Statistics
bets N Mean Std. Deviation Std. Error Mean
daya sebar bets1 3 5.2667 .05774 .03333 bets2 3 5.1667 .11547 .06667
Independent Samples Test
Levene's
Test t-test for Equality of Means
95% Confidence
F Sig. t df Sig.
(2-tailed) Mean Difference
Std. Error
Difference Lower Upper
daya sebar
Equal variances assumed
3.200 .148 1.342 4 .251 .10000 .07454 -.10694 .30694
Equal variances not assumed
1.342 2.941 .274 .10000 .07454 -.13991 .33991
Formula III
Group Statistics
bets N Mean Std. Deviation Std. Error Mean
daya sebar bets1 3 5.2667 .05774 .03333
Independent Samples Test
Levene's
Test t-test for Equality of Means
95% Confidence
F Sig. t df Sig. (2-tailed)
Mean Difference
Std. Error
Difference Lower Upper
daya sebar
Equal variances
assumed 5.000 .089 -.802 4 .468 -.10000 .12472 -.44628 .24628
Equal variances
not assumed -.802 2.306 .497 -.10000 .12472 -.57387 .37387
Uji Statistik Daya Sebar dengan One Way ANOVA
DescriptivesN Mean Std. Deviation
Std. Error
95% Confidence Interval for
Mean Minimum Maximum
Lower Bound Upper Bound
Formula I 3 5.1000 .17321 .10000 4.6697 5.5303 4.90 5.20 Formula II 3 5.2667 .05774 .03333 5.1232 5.4101 5.20 5.30
Formula III 3 5.2667 .05774 .03333 5.1232 5.4101 5.20 5.30 Formula 0 3 4.7667 .05774 .03333 4.6232 4.9101 4.70 4.80 Formula 00 3 6.9000 .10000 .05774 6.6516 7.1484 6.80 7.00
Total 15 5.4600 .77349 .19971 5.0317 5.8883 4.70 7.00
Test of Homogeneity of Variances
Levene Statistic df1 df2 Sig.
2.857 4 10 .081
ANOVA
Sum of Squares df Mean Square F Sig.
Between Groups 8.276 4 2.069 206.900 .000
Within Groups .100 10 .010
Multiple Comparisons
(I) Formula (J) Formula Mean Difference (I-J) Std. Error Sig. 95% Confidence Interval Lower Bound Upper Bound
Formula I
Formula II -.16667 .08165 .069 -.3486 .0153
Formula III -.16667 .08165 .069 -.3486 .0153
Formula 0 .33333* .08165 .002 .1514 .5153
Formula 00 -1.80000* .08165 .000 -1.9819 -1.6181
Formula II
Formula I .16667 .08165 .069 -.0153 .3486
Formula III .00000 .08165 1.000 -.1819 .1819
Formula 0 .50000* .08165 .000 .3181 .6819
Formula 00 -1.63333* .08165 .000 -1.8153 -1.4514
Formula III
Formula I .16667 .08165 .069 -.0153 .3486
Formula II .00000 .08165 1.000 -.1819 .1819
Formula 0 .50000* .08165 .000 .3181 .6819
Formula 00 -1.63333* .08165 .000 -1.8153 -1.4514
Formula 0
Formula I -.33333* .08165 .002 -.5153 -.1514
Formula II -.50000* .08165 .000 -.6819 -.3181
Formula III -.50000* .08165 .000 -.6819 -.3181
Formula 00 -2.13333* .08165 .000 -2.3153 -1.9514
Formula 00
Formula I 1.80000* .08165 .000 1.6181 1.9819
Formula II 1.63333* .08165 .000 1.4514 1.8153
Formula III 1.63333* .08165 .000 1.4514 1.8153
Formula 0 2.13333* .08165 .000 1.9514 2.3153
sebelum diberi beban
sesudah diberi beban
F I
F II
F III
F 0
LAMPIRAN J
HASIL PENGUJIAN DAYA LEKAT SEDIAAN KRIM TABIR
SURYA EKSTRAK AIR BUAH TOMAT
Formula Replikasi Bets 1 Bets 2 t hitung t tabel F hitung F tabel
I
1 1,5 1,0
1,732 2,776
93,467 3,48
2 1,3 1,3
3 1,4 1,3
bets 1,40 ± 0,10 s
1,20 ± 0,17 s formula 1,30 ± 0,17 s
II
1 2,3 2,0
0,316 2,776
2 2,0 2,1
3 2,1 2,2
bets 2,13 ± 0,15 s
2,10 ± 0,10 s formula 2,12 ± 0,12 s
III
1 2,7 3,2
-0,647 2,776
2 2,9 2,5
3 3,0 3,5
bets 2,87 ± 0,15 s
3,07 ± 0,51 s formula 2,97 ± 0,36 s
0
1 1,2
2 1,2
3 1,5
formula 1,30 ± 0,17 s
00
1 0,8
2 1,0
3 0,8
formula 0,87 ± 0,12 s
Uji Statistik Daya Lekat Antar Bets dengan Independent T Test
Formula I
Group Statistics
bets N Mean Std. Deviation Std. Error Mean
Independent Samples Test
Levene's
Test t-test for Equality of Means
95% Confidence
F Sig. t df Sig. (2-tailed)
Mean Difference
Std. Error
Difference Lower Upper
daya lekat
Equal variances
assumed 2.000 .230 1.732 4 .158 .20000 .11547 -.12060 .52060
Equal variances
not assumed 1.732 3.200 .176 .20000 .11547 -.15482 .55482
Formula II
Group Statistics
bets N Mean Std. Deviation Std. Error Mean
daya lekat bets1 3 2.1333 .15275 .08819 bets2 3 2.1000 .10000 .05774
Independent Samples Test
Levene's
Test t-test for Equality of Means
95% Confidence
F Sig. t df Sig. (2-tailed)
Mean Difference
Std. Error
Difference Lower Upper
daya lekat
Equal variances
assumed .727 .442 .316 4 .768 .03333 .10541 -.25933 .32600
Equal variances
not assumed .316 3.448 .770 .03333 .10541 -.27876 .34542
Formula III
Group Statistics
Independent Samples Test
Levene's
Test t-test for Equality of Means
95% Confidence
F Sig. t df Sig. (2-tailed)
Mean Difference
Std. Error
Difference Lower Upper
daya lekat
Equal variances
assumed 3.945 .118 -.647 4 .553 -.20000 .30912 -1.05826 .65826
Equal variances
not assumed -.647 2.352 .575 -.20000 .30912 -1.35650 .95650
Uji Statistik Daya Lekat Antar Formula dengan One Way Anova
DescriptivesN Mean Std. Deviation
Std. Error
95% Confidence Interval for Mean
Minimum Maximum Lower
Bound
Upper Bound
Formula I 3 1.4000 .10000 .05774 1.1516 1.6484 1.30 1.50 Formula II 3 2.1333 .15275 .08819 1.7539 2.5128 2.00 2.30
Formula III 3 2.8667 .15275 .08819 2.4872 3.2461 2.70 3.00 Formula 0 3 1.3000 .17321 .10000 .8697 1.7303 1.20 1.50 Formula 00 3 .8667 .11547 .06667 .5798 1.1535 .80 1.00 Total 15 1.7133 .74053 .19120 1.3032 2.1234 .80 3.00
Test of Homogeneity of Variances
Levene Statistic df1 df2 Sig.
.542 4 10 .709
ANOVA
Sum of Squares df Mean Square F Sig.
Between Groups 7.477 4 1.869 93.467 .000
Within Groups .200 10 .020
Multiple Comparisons
(I) Formula (J) Formula Mean Difference (I-J) Std. Error Sig. 95% Confidence Interval Lower Bound Upper Bound
Formula I
Formula II -.73333* .11547 .000 -.9906 -.4761
Formula III -1.46667* .11547 .000 -1.7239 -1.2094
Formula 0 .10000 .11547 .407 -.1573 .3573
Formula 00 .53333* .11547 .001 .2761 .7906
Formula II
Formula I .73333* .11547 .000 .4761 .9906
Formula III -.73333* .11547 .000 -.9906 -.4761
Formula 0 .83333* .11547 .000 .5761 1.0906
Formula 00 1.26667* .11547 .000 1.0094 1.5239
Formula III
Formula I 1.46667* .11547 .000 1.2094 1.7239
Formula II .73333* .11547 .000 .4761 .9906
Formula 0 1.56667* .11547 .000 1.3094 1.8239
Formula 00 2.00000* .11547 .000 1.7427 2.2573
Formula 0
Formula I -.10000 .11547 .407 -.3573 .1573
Formula II -.83333* .11547 .000 -1.0906 -.5761
Formula III -1.56667* .11547 .000 -1.8239 -1.3094
Formula 00 .43333* .11547 .004 .1761 .6906
Formula 00
Formula I -.53333* .11547 .001 -.7906 -.2761
Formula II -1.26667* .11547 .000 -1.5239 -1.0094
Formula III -2.00000* .11547 .000 -2.2573 -1.7427
Formula 0 -.43333* .11547 .004 -.6906 -.1761
LAMPIRAN K
HASIL PENGUJIAN DAYA TERCUCIKAN AIR SEDIAAN KRIM
TABIR SURYA EKSTRAK AIR BUAH TOMAT
Formula Replikasi Bets 1 Bets 2 t hitung t tabel F hitung F tabel
I
1 35 36
2,776
843,627 3,48
2 35 35
3 38 39 -0,426
bets 36 ± 1,73 ml
36 ± 2 ml formula 36 ± 1,67 ml
II
1 72 70
0,354 2,776
2 74 70
3 68 72
bets 71 ± 1 ml
71,67 ± 0,58 ml formula 71,33 ± 0,82 ml
III
1 85 86
-1,309 2,776
2 85 88
3 82 84
bets 84 ± 1,73 ml
86 ± 2 ml formula 85 ± 2 ml
0
1 15
2 15
3 14
formula 14,67 ± 0,58 ml
00
1 10
2 12
3 8
formula 10 ± 2 ml
Uji Statistik Daya Tercucikan Air Antar Bets dengan Independent T Test
Formula I
Group Statistics
bets N Mean Std. Deviation Std. Error Mean
Independent Samples Test
Levene's
Test t-test for Equality of Means
95% Confidence
F Sig. t df Sig. (2-tailed)
Mean Difference
Std. Error
Difference Lower Upper
daya cuci
Equal variances
assumed .143 .725 -.426 4 .692 -.66667 1.56347 -5.00756 3.67423
Equal variances
not assumed -.426 3.872 .692 -.66667 1.56347 -5.06474 3.73141
Formula II
Group Statistics
bets N Mean Std. Deviation Std. Error Mean
daya cuci bets1 3 71.3333 3.05505 1.76383 bets2 3 70.6667 1.15470 .66667
Independent Samples Test
Levene's
Test t-test for Equality of Means
95% Confidence
F Sig. t df Sig. (2-tailed) Mean Difference Std. Error
Difference Lower Upper
daya cuci
Equal variances
assumed 2.571 .184 .354 4 .742 .66667 1.88562 -4.56865 5.90198
Equal variances
not assumed .354 2.560 .751 .66667 1.88562 -5.96207 7.29541
Formula III
Group Statistics
bets N Mean Std. Deviation Std. Error Mean
Independent Samples Test
Levene's
Test t-test for Equality of Means
95% Confidence
F Sig. t df Sig. (2-tailed) Mean Difference Std. Error
Difference Lower Upper
daya cuci
Equal variances
assumed .000 1.000 -1.309 4 .261 -2.00000 1.52753 -6.24109 2.24109
Equal variances
not assumed -1.309 3.920 .262 -2.00000 1.52753 -6.27544 2.27544
Uji Statistik Daya Tercucikan Air Antar Formula dengan One Way Anova
DescriptivesN Mean Std. Deviation
Std. Error
95% Confidence Interval for Mean
Minimum Maximum Lower
Bound
Upper Bound
Formula I 3 36.0000 1.73205 1.00000 31.6973 40.3027 35.00 38.00
Formula II 3 71.3333 3.05505 1.76383 63.7442 78.9225 68.00 74.00 Formula III 3 84.0000 1.73205 1.00000 79.6973 88.3027 82.00 85.00 Formula 0 3 14.6667 .57735 .33333 13.2324 16.1009 14.00 15.00
Formula 00 3 10.0000 2.00000 1.15470 5.0317 14.9683 8.00 12.00 Total 15 43.2000 30.83643 7.96193 26.1234 60.2766 8.00 85.00
Test of Homogeneity of Variances
Levene Statistic df1 df2 Sig.
1.495 4 10 .275
ANOVA
Sum of Squares df Mean Square F Sig.
Multiple Comparisons
(I) Formula (J) Formula Mean Difference (I-J) Std. Error Sig. 95% Confidence Interval Lower Bound Upper Bound
Formula I
Formula II -35.33333* 1.61933 .000 -38.9414 -31.7252
Formula III -48.00000* 1.61933 .000 -51.6081 -44.3919
Formula 0 21.33333* 1.61933 .000 17.7252 24.9414
Formula 00 26.00000* 1.61933 .000 22.3919 29.6081
Formula II
Formula I 35.33333* 1.61933 .000 31.7252 38.9414
Formula III -12.66667* 1.61933 .000 -16.2748 -9.0586
Formula 0 56.66667* 1.61933 .000 53.0586 60.2748
Formula 00 61.33333* 1.61933 .000 57.7252 64.9414
Formula III
Formula I 48.00000* 1.61933 .000 44.3919 51.6081
Formula II 12.66667* 1.61933 .000 9.0586 16.2748
Formula 0 69.33333* 1.61933 .000 65.7252 72.9414
Formula 00 74.00000* 1.61933 .000 70.3919 77.6081
Formula 0
Formula I -21.33333* 1.61933 .000 -24.9414 -17.7252
Formula II -56.66667* 1.61933 .000 -60.2748 -53.0586
Formula III -69.33333* 1.61933 .000 -72.9414 -65.7252
Formula 00 4.66667* 1.61933 .016 1.0586 8.2748
Formula 00
Formula I -26.00000* 1.61933 .000 -29.6081 -22.3919
Formula II -61.33333* 1.61933 .000 -64.9414 -57.7252
Formula III -74.00000* 1.61933 .000 -77.6081 -70.3919
Formula 0 -4.66667* 1.61933 .016 -8.2748 -1.0586
LAMPIRAN L
HASIL PENGUJIAN DAYA
WATER-RESISTANT
SEDIAAN KRIM
TABIR SURYA EKSTRAK AIR BUAH TOMAT
LAMPIRAN M
HASIL PENILAIAN KESUKAAN SEDIAAN KRIM TABIR SURYA
EKSTRAK AIR BUAH TOMAT
LAMPIRAN N
LEMBAR KUISIONER PANELIS UNTUK PENGUJIAN MUTU
FISIK SEDIAAN KRIM TABIR SURYA EKSTRAK AIR BUAH
LAMPIRAN O
LEMBAR KUISIONER PANELIS UNTUK PENGUJIAN DAYA
WATER-RESISTANT
SEDIAAN KRIM TABIR SURYA EKSTRAK
LAMPIRAN P
LEMBAR KUISIONER PANELIS UNTUK PENGUJIAN
KESUKAAN SEDIAAN KRIM TABIR SURYA EKSTRAK AIR
BUAH TOMAT
LAMPIRAN Q
LAMPIRAN R
LAMPIRAN S
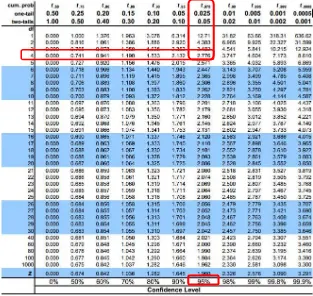
TABEL T
Cara membaca tabel t Tentukan nilai df (n-k)
n = jumlah pengamatan k = jumlah variable (bets)
Tentukan derajat kepercayaan
Contoh pembacaan n= 6; k= 2; df= 6-2= 4
Derajat kepercayaan = 95%
LAMPIRAN T
TABEL CHI-SQUARE
Cara membaca tabel chi-square Tentukan nilai df (k-1)
k = jumlah sampel (formula)
Tentukan derajat kepercayaan
Contoh pembacaan k= 8; df= 8-1= 7
Derajat kepercayaan = 95%
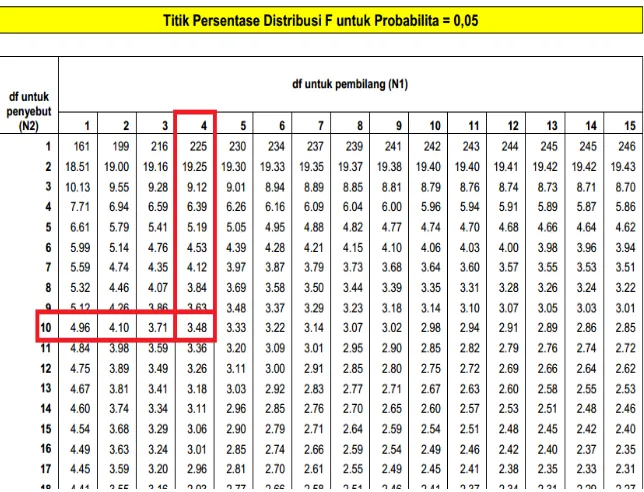
LAMPIRAN U
TABEL F
Cara membaca tabel F
Tentukan nilai df df1= (k-1); df2= (n-1)-(k-1) n = jumlah pengamatan
k = jumlah variable (formula)
Tentukan derajat kepercayaan
df1 kolom; df2 baris
Contoh pembacaan
n= 15; k= 5; df1= 5-1= 4; df2= (15-1)-(5-1)= 10
Derajat kepercayaan = 95%