XXX-X-XXXX-XXXX-X/XX/$XX.00 ©20XX IEEE
Classification of the Period Undergraduate Study
Using Back-propagation Neural Network
1st Purwono Prasetyawan Faculty of Engineering and
Computer Science Universitas Teknokrat Indonesia
Lampung, Indonesia
4th Ardiansyah
Department of Computer Science Universitas Lampung Bandarlampung, Indonesia [email protected]
2nd Imam Ahmad Faculty of Engineering and
Computer Science Universitas Teknokrat Indonesia
Bandarlampung, Indonesia [email protected]
5th Yogi Aziz Pahlevi Faculty of Engineering and
Computer Science Universitas Teknokrat Indonesia
Bandarlampung, Indonesia [email protected]
3rd Rohmat Indra Borman Faculty of Engineering and
Computer Science Universitas Teknokrat Indonesia
Bandarlampung, Indonesia [email protected]
6th Dwi Ely Kurniawan Departement of Informatics
Engineering Politeknik Negeri Batam
Batam, Indonesia [email protected]
Abstract— The period of student study is one of the
indicators of the determinants of the quality of a college. Based on the standard assessment of college accreditation by BAN-PT, the period of study became one of the elements of assessment of accreditation forms. Universities have an important role to monitor the development of student studies. For that, universities are required to always evaluate the performance of students. One way of evaluation that can be done is to explore the knowledge of academic data that will affect student performance. By utilizing data mining on student academic data, universities can obtain useful information. This information which later can be used as a reference in making improvements to the performance of student studies. Several previous studies used data mining techniques to predict the study period of students and this study will analyze the factors that influence the duration of undergraduate studies and modeling of ANN with back-propagation training algorithms to classify the study period. The result of this research is The BPNN algorithm is suitable for the classification of undergraduate study periods with accuracy rates above 85%.
Keywords— mining, bpnn, undergraduate study period, student academic
I. INTRODUCTION
Student study period is one of the reference indicators for determining the quality of a university. Based on BAN PT's accreditation assessment standards for higher education, the study period is one of the elements of accreditation forms assessment [1]. Higher education has an important role to monitor the development of student studies. For this reason, universities are required to always evaluate student performance. One method of evaluation that can be done is to explore knowledge from academic data that will affect student performance [2]. By utilizing data mining on student academic data, universities can obtain useful information. This information can later be used as a reference in making improvements to student study performance [3] [4].
Some previous studies used data mining techniques to predict student study periods. Using the artificial neural network (ANN) with a multilayer perceptron architecture to predict undergraduate studies [5]. The results of the study concluded that the length of the study was influenced by the Grade Point Average (GPA), the number of courses taken,
the number of courses repeated, and the number of courses taken. Other studies by [6] state that undergraduate studies are influenced by GPA and majors. The study classified the duration of study into two categories, namely more than four years and less than the same as four years. The classification technique used is the support vector machine (SVM) and Binary Logistic Regression, and others using K-NN [7]. Third classification techniques produce different percentages of classification accuracy.
The preceding research related to this research is a study of students' academic performance predictions by [8] using ANN models with 10 input variables namely matriculation tests; grades in Mathematics, Physics, Chemistry, and English; advanced Mathematics grades, age at registration, waiting time between high school graduation and college; parent education; high school location; kind of high school; campus location and place of residence; and gender. Furthermore developed a prediction model for student study time based on ANN with 3 input variables namely GPA Semester 1, 2, and 3 [9].
Examined the application of data mining to evaluate students' academic performance in the second year. The study uses the Naïve Bayes Classifier (NBC) algorithm with the classification category which is to pass on time or not [10]. Compared several data mining methods including a decision tree (decision tree) [11], Bayesian, the k-nearest neighbor, and rule learners to predict student performance. Using ID3 decision tree techniques to predict student performance [12]. The C4.5 decision tree technique is used by [13] to classify (classify) the level of quality of students based on the college entrance path.
also used [17], in their research they used BpNN (back-propagation neural network) to predict rainfall in Tenggarong, East Kalimantan. The results of the study concluded that the BPNN algorithm applied to predict MSE (mean square error) was 0,00096341.
Based on previous research, research on the prediction of the study period of students using the BPNN algorithm is expected to produce valuable knowledge in the field of data mining and computational intelligence, both on the theoretical side and in the application side of the real world. In this study will analyze the factors that influence the period of undergraduate study and the making of ANN models with training-propagation algorithms to predict the study period. ANN is one of the pattern recognition techniques that is widely used to predict or forecast [18]. The prediction model will be used as a policy determinant for students who have a study period beyond the limit. The renewal of this research lies in the use of actual academic data at certain universities, predictor variables and neural network parameters (architecture) so that it is expected to get a precise and accurate prediction model.
II. METHODOLOGY
This study has several stages, namely data retrieval, data processing using the Back-Propagation Neural Network (BPNN), analysis and evaluation of models, and documentation, report making, and publication.
Fig. 1. Research flow diagram
A. Data Retrieval
The data used as a mining and testing process are primary data, in the form of master data samples and actual student academic data at a 2008-2013 generation college that has graduated. The data consists of 1318 academic records consisting of 7 attributes, namely:
• Student admission test results, • Department,
• 1st-semester Achievement Index • 2nd-semester achievement index, • Gender,
• Middle school type, and • Length of study.
Before the input data and targets implemented into the data neural network must be processed first, because the data is still dirty, incomplete, and inconsistent.
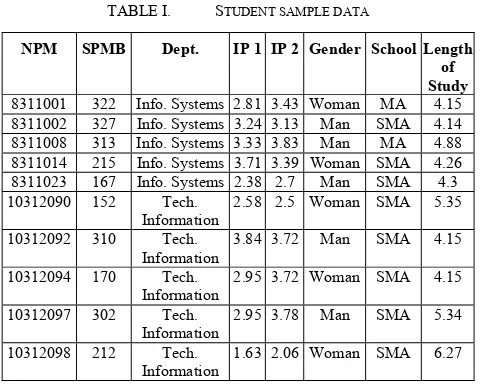
TABLE I. STUDENT SAMPLE DATA
NPM SPMB Dept. IP 1 IP 2 Gender School Length of Study
8311001 322 Info. Systems 2.81 3.43 Woman MA 4.15 8311002 327 Info. Systems 3.24 3.13 Man SMA 4.14 8311008 313 Info. Systems 3.33 3.83 Man MA 4.88 8311014 215 Info. Systems 3.71 3.39 Woman SMA 4.26 8311023 167 Info. Systems 2.38 2.7 Man SMA 4.3 10312090 152 Tech.
Information
2.58 2.5 Woman SMA 5.35 10312092 310 Tech.
Information
3.84 3.72 Man SMA 4.15 10312094 170 Tech.
Information
2.95 3.72 Woman SMA 4.15 10312097 302 Tech.
Information
2.95 3.78 Man SMA 5.34 10312098 212 Tech.
Information
1.63 2.06 Woman SMA 6.27
The preprocessing process consists of data transformation and cleaning. Transformation data adopts binary transformation and aims to make convergence faster and achieved if the average value of input training data is close to zero.
TABLE II. DATA TRANSFORMATION FOR SCHOOL TYPE ATTRIBUTES
Department
Transform to
Department
MA 0 SMA 1 SMK 2
This mapping is done to prepare inputs and targets using Min-max normalization [19]. This normalization is chosen so that the data is at 0-1 intervals, this is due to the activation function that will be used is the sigmoid function. Normalization is carried out based on the following formula;
= ( −( )(− _) + − _ _ )
Where:
- n’ = Normalization results;
- n = Actual value that you want to normalize; - minA = Range minimum of n;
- maxA = Range maksimum of n; - new_minA = Range minimum of n’; - new_maxA = Range maksimum of n’.
B. Pattern Recognition
TABLE III. BACK-PROPAGATION ANNPARAMETERS
Characteristics Specifications
Architecture 1 hidden layer
Input neurons 8
Hidden layer neurons 3, 5, 8, 10, 20
Neuron output 2
Activation function Sigmoid Sigalat tolerance 10-3
Maximum epoch 100,500
The testing process is carried out by testing test data on the training architecture model. Testing is done based on the study period class using the confusion matrix table.
TABLE IV. CONFUSION MATRIX
Confusion matrix table Predicted
Negative Positive
Actual Negative a b
Positive c d
The output of the confusion matrix table above is as follows:
1) Recall: Recall is the proportion of positive cases correctly identified. Calculations to look for recall values are as follows:
=( ) (1)
2) Precision: Precision is the proportion of cases with true positive results. Calculations to find precision values are as follows:
=( ) (2)
3) Accuracy: Accuracy is a comparison of cases identified correctly with the total number of cases. Calculations to find accuracy values are as follows:
=( ( ) ) (3)
4) Error Rate: Error Rate is a case that is identified as wrong with a number of all cases. The calculation for finding the error rate is as follows:
=( ( ) ) (4)
C. Analysis and Evaluation
The next stage is the classification performance evaluation. In order to be easily understood and analyzed, accuracy results are made in graphical form. The process of analysis by observing the ANN parameters used to the level of classification accuracy.
III. RESULTS
A. Preprocessing Data
Data transformation is done by converting categorical data into numeric data. This is done so that categorical data can be normalized. Sample data from the transformation of data can be seen in table 5.
TABLE V. SAMPLE DATA FROM THE RESULTS OF DATA TRANSFORMATION
NPM SPMB Dept. IP 1 IP 2 Gender Type of School
Length of Study
08311001 322 0 2.81 3.43 0 0 4.15 08311002 327 0 3.24 3.13 1 1 4.14 08311008 313 0 3.33 3.83 1 0 4.88 08311014 215 0 3.71 3.39 0 1 4.26 08311023 167 0 2.38 2.7 1 1 4.3 10312090 152 1 2.58 2.5 0 1 5.35 10312092 310 1 3.84 3.72 1 1 4.15 10312094 170 1 2.95 3.72 0 1 4.15 10312097 302 1 2.95 3.78 1 1 5.34 10312098 212 1 1.63 2.06 0 1 6.27
The transformation data is then used for the normalization process. Normalization is done so that the data is at 0-1 intervals. Sample data from the normalization of data can be seen in table 6
TABLE VI. SAMPLE DATA FROM THE RESULTS OF DATA NORMALIZATION
NPM SPMB Dept. IP 1 IP 2 Gender Type of School
Length of Study
08311001 0.514 0 0.616 0.845 0 0 0.296 08311002 0.522 0 0.755 0.764 1 0.5 0.293 08311008 0.498 0 0.784 0.954 1 0 0.531 08311014 0.332 0 0.906 0.834 0 0.5 0.331 08311023 0.25 0 0.477 0.647 1 0.5 0.344 10312090 0.224 1 0.542 0.592 0 0.5 0.682 10312092 0.493 1 0.948 0.924 1 0.5 0.296 10312094 0.255 1 0.661 0.924 0 0.5 0.296 10312097 0.48 1 0.661 0.94 1 0.5 0.678 10312098 0.327 1 0.235 0.473 0 0.5 0.977
B. Pattren Recognition with BpNN
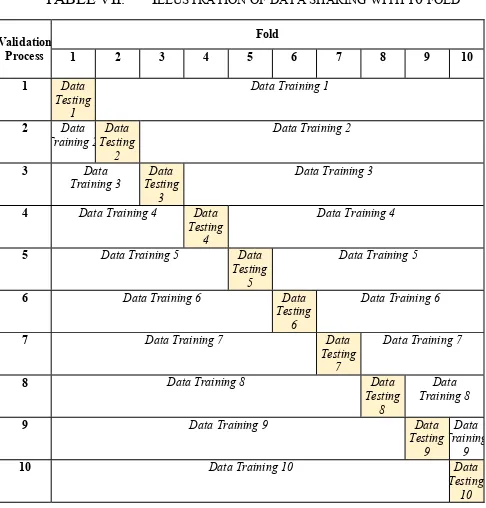
Before pattern recognition using BPNN method, data that has been transformed and normalized is divided into several folds/partitions using the k-fold cross-validation method. The number of folds used in is 10 fold, so it will get a k-fold cross validation pattern as in table 7.
TABLE VII. ILLUSTRATION OF DATA SHARING WITH 10 FOLD
Validation Process
Fold
1 2 3 4 5 6 7 8 9 10
1 Data Testing 1
Data Training 1
2 Data Training 2
Data Testing 2
Data Training 2
3 Data Training 3
Data Testing 3
Data Training 3
4 Data Training 4 Data Testing 4
Data Training 4
5 Data Training 5 Data Testing
5
Data Training 5
6 Data Training 6 Data Testing
6
Data Training 6
7 Data Training 7 Data Testing
7
Data Training 7
8 Data Training 8 Data
Testing 8
Data Training 8
9 Data Training 9 Data
Testing 9
Data Training
9
10 Data Training 10 Data
The illustration above shows that dividing the data into 10 folds will produce 10 validation processes, where the data in each validation process is divided into 9 training data folds and 1 different testing data fold for each validation process. Each fold will contain 82 student data so that in 1 validation process will have 738 sets of training data and 82 sets of testing data.
Pattern recognition is done based on the results of data sharing using k-fold cross-validation and also ANN parameters that have been mentioned in table 3.2. in the parameter table, it is explained that the ANN architecture is 1 hidden layer, 8 input neurons, 5 different hidden layer neurons (3, 5, 8, 10, and 20), 2 output neurons, sigmoid activation function, error tolerance 10-3, and maximum epoch
100 and 500.
The output target to be achieved is 2 output neurons, aiming to classify (on time if the study period is ≤ 4 years and not on time if the study period is > 4 years), as well as to make predictions based on study time (year and month).
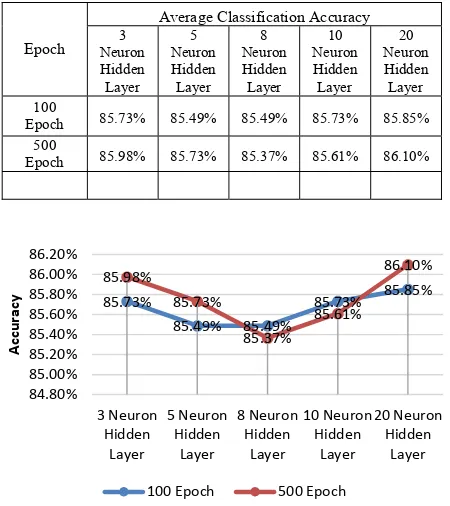
TABLE VIII. RESULTS OF RECOGNITION OF CLASSIFICATION PATTERNS WITH BPNN
Epoch
Average Classification Accuracy
3
Epoch 85.73% 85.49% 85.49% 85.73% 85.85%
500
Epoch 85.98% 85.73% 85.37% 85.61% 86.10%
Fig. 2. Analysis chart of the introduction of classification patterns with BPNN
Based on the graph in Figure 2, it can be seen that the highest average accuracy was achieved in experiments with 500 epochs and 20 hidden layer neurons with an average accuracy of 86.10%. However, it does not show that the number of hidden layer epochs and neurons significantly influences the results of the accuracy obtained, because in the 500 epoch experiments and 8 hidden layer neurons it became the lowest accuracy experiment with an average accuracy of only 85.37%, smaller than 500 epoch experiments with 3 hidden layer neurons and 5 hidden layer neurons.
After obtaining the results of the analysis of BpNN algorithm as already explained, the next is analyzing the attributes that influence the undergraduate study period.
Results of the experiments to find attributes that affect the undergraduate study period can be seen in Figure 3.
Fig. 3. Attribute analysis graphs affect the undergraduate study period (classification)
Based on the graph in Figure 3, Five experiments have been carried out with information from each experiment as follows:
1. Experiment 1: Experiment 1 was carried out without including the attributes of the Student Admission Test (SPMB). The pattern recognition accuracy of the undergraduate study period on time is 85.89% for training and 85.73% for testing.
2. Experiment 2 : Experiment 2 was carried out without including the attributes of the Department. The pattern recognition accuracy of the classification of the undergraduate study period was 85.91% for training and 85.79% for testing.
3. Experiment 3 : Experiment 3 was conducted without including the attributes of Semester 1 and Semester 2 GPA. The pattern recognition accuracy of the undergraduate study period on time was 85.67% for training and 85.67% for testing.
4. Experiment 4 : Experiment 4 was carried out without including the attributes of Gender Type. Pattern recognition accuracy on the classification of the undergraduate study period was 85.66% for training and 85.67% for testing.
5. Experiment 5 : Experiment 5 was carried out without including the attributes of the School Type. The pattern recognition accuracy for the classification of the undergraduate study period was 85.80% for training and 85.73% for testing.
Based on the exposure to the graph in Figure 3, it can be concluded that the influential attributes are GPA Semester 1 and GPA Semester 2, as well as Gender attributes. Because in the experiment without including these attributes, the results of the classification of the undergraduate study period on time slightly decreased than when those attributes were included in pattern recognition using BpNN.
85.73%
100 Epoch 500 Epoch
85.89% 85.91%
AVERAGE OF CLASSIFICATION ACCURACY (TRAINING)
IV. CONCLUSION
ANN model with a training-propagation algorithm that can be made in this research is ANN with 1 hidden layer, 8 input neurons, 5 different hidden layer neurons (3, 5, 8, 10, and 20), 2 output neurons, activation function sigmoid, error tolerance 10-3, and maximum epoch100 and 500. And it can be seen that the number of hidden layer epochs and neurons does not significantly affect the results of the accuracy of pattern recognition obtained.
BpNN algorithm is suitable for classification of the periode of the undergraduate study. Factors that influence the period of undergraduate study are GPA Semester 1 and GPA Semester 2, as well as Gender attributes.
ACKNOWLEDGMENT
Thank you to the Ministry of Research, Technology and Higher Education for the financial support related to the Beginner Lecturer Research (PDP) through LPPM Teknokrat Indonesia University with the contract number 008 / LPPM-UTI / PDP / V / 2017.
REFERENCES
[1] BAN PT, Akreditasi Program Studi Sarjana: Buku II Standar dan Prosedur Akreditasi Program Studi Sarjana. Jakarta: BAN PT, 2008. [2] B. K. Baradwaj and S. Pal, "Mining Educational Data to Analyze
Students Performance," International Journal of Advanced Computer Science and Applications, vol. 2, no. 6, pp. 63-69, 2011.
[3] M. M. A. Tair and A. M. El-Halees, "Mining Educational Data to Improve Students’ Performance: A Case Study," International Journal of Information and Communication Technology Research, vol. 2, no. 2, pp. 140-146, 2012.
[4] A. B. E. D. Ahmed and I. S. Elaraby, "Data Mining: A prediction for Student's Performance Using Classification Method," World Journal of Computer Application and Technology, vol. 2, no. 2, pp. 43-4, 2014.
[5] M. H. Meinanda, M. Annisa, N. Muhandri, and K. Suryadi, "Prediksi Masa Studi Sarjana dengan Artificial Neural Network,"
Internetworking Indonesia Journal, vol. 1, no. 2, pp. 31-35, 2009. [6] S. M. S. Damanik, D. Ispriyanti, and S. Sugito, "Klasifikasi Lama
Studi Mahasiswa FSM Universitas Diponegoro Menggunakan Regresi Logistik Biner dan Support Vector Machine (SVM)," Jurnal Gaussian, vol. 4, no. 1, pp. 123-132, 2015.
[7] P. Prasetyawan and M. A. Faridz, "Application Development of Student's Graduation Classification Model based on The First 2 Years Performance using K-Nearest Neighbor," in The 4th International Conference on Engineering &Technology Development, 2017, pp. 439-445.
[8] J. Williams and L. Yan, "A Case Study Using Neural Network Algorithms: horse racing prediction in Jamaica," in International Conf. on Artificial Intelligence (ICAI'08), Las Vegas, 2008.
[9] B. Rahmani and H. Aprilianto, "Pengembangan Model Prediksi Lama Masa Studi Mahasiswa Berbasis Jaringan Syaraf Tiruan," in Seminar Nasional 2013 Menuju Masyarakat Madani dan Lestari, Yogyakarta, 2013.
[10] M. Ridwan, H. Suyono, and M. Sarosa, "Penerapan Data Mining Untuk Evaluasi Kinerja Akademik Mahasiswa Menggunakan Algoritma Naive Bayes Classifier," Electrics Electronics Communications Controls Informatics Systems, vol. 7, no. 1, pp. 59-64, 2013.
[11] D. Kabakchieva, "Predicting Student Performance by Using Data Mining Methods for Classification," Cybernetics and Information Technologies, vol. 13, no. 1, pp. 61-72, 2013.
[12] A. B. E. D. Ahmed and I. S. Elaraby, "Data Mining: A prediction for
Student's Performance Using Classification Method," World Journal of Computer Application and Technology, vol. 2, no. 2, pp. 43-47, 2014.
[13] D. H. Kamagi and S. Hansun, "Implementasi Data Mining dengan Algoritma C4.5 untuk Memprediksi Tingkat Kelulusan Mahasiswa,"
Ultimatics, vol. 6, no. 1, pp. 15-20, 2014.
[14] K. Gurney, An Introduction to Neural Networks. London, England: Taylor & Francis e-Library, 20014.
[15] K. Y. Lee, N. Chung, and S. Hwang, Application of an Artifcial Neural Network (ANN) Model for Predicting Mosquito Abundances in Urban Areas.: Ecological Informatics, 2015.
[16] S. Agrawal and J. Agrawal, "Neural Network Techniques for Cancer Prediction: A Survey," in Procedia Computer Science, 2015, pp. 769-774.
[17] et. al. Mislan, "Rainfall Monthly Prediction Based on Artificial Neural Network: A Case Study in Tenggarong Station," in Procedia Computer Science, 59(Elsevier), East Kalimantan, 2015, pp. 142-151. [18] V. Oladokun, A. Adebanjo, and O. Charles-Owaba, "Predicting
Students’ Academic Performance using Artificial Neural Network: A Case Study of an Engineering Course," The Pacific Journal of Science and Technology, vol. 9, no. 1, pp. 72-79, 2008.
[19] D. E. Kurniawan, and A. Fatulloh, "Clustering of Social Conditions in Batam, Indonesia Using K-Means Algorithm and Geographic Information System," International Journal of Earth Sciences and Engineering (IJEE), Vol.10 No.05, 2017.