CUSTOMER RETENTION STRATEGIES AT HYPERMARKETS
IN JAKARTA
Willy Arafah
Lecturer of Magister Management Graduate Program, D Building, VII Floor Jl. Kiai Tapa No. 1 Grogol, West Jakarta 11440
email: [email protected], Phone: (021) 5664166, Fax.: (021) 5668640
ABSTRACT
Today many Hypermarket growing in Jakarta, although Jakarta market is very large and seems
very promising, Hypermarkets are finding it tough to be profitable in Jakarta. One of the marketing strategies is to focus on retaining the existing customer as they are three time more profitable than looking for the new one. In this research we examine the factor that influence customer intention to continue purcjhasing from Hypermarkets in Jakarta. The results show that customer’s perceived value is an important indicator of customer continuance intention, as are the loyalty incentives provided by the Supermarkets. Moreover, convenience is more important for customer in these markets than enjoyments. Hypermarkets can increase customer retention by focusing their strategies in making customer experience more valuable and convenient. Implication for theory and practice are also discusses in this research.
INTRODUCTION
Retail industry in Indonesia shows that the industry has been developed in a 10 year cycle, and
its long period of development can be divided into subsequent stages. However, this cycle tends
to shorten due to many factors, such as the rapid increase of income per capita, global trade and financial liberalization and technological progress. The development cycle of the industry is given as follows. Before 1960s, there was the episode of traditional retailers or independent (small) traders.
In the 1960s there was the period when modern retail was introduced marked by the opening of the first department store Sarinah. During the 1970s-1980s, it was the first expansion era of modern retail with the emergence of many supermarkets, department stores and groceries such as Matahari,
Hero, Golden Truly, Pasar Raya dan Ramayana, it was also the era of development of drug stores. In the early 1980s, shopping malls were limited to Sarinah, Ratu Plaza, Gajah Mada Plaza, Blok M and Pasar Baru. Since then, major shopping malls have been constructed all over town. The growing middle class has been flocking to the shopping malls in recent years to buy an ever growing variety of consumer goods. Foreign department chains such as Metro (Singapore), Sogo (Japan) and Marks
& Spencer’s (UK) have tested the waters by opening outlets in prestigious malls.
As many modern store based retailers in Indonesia continued to offer the widest possible range of products in order to increase traffic to their outlets and generate higher revenues, non grocery sales continued to gradually take grocery retail share. The growing urban population in Indonesia led to
growing sophistication amongst consumers and resulted in increasing demand for and spending on
non-grocery items, as well as basic grocery products such as food. In 2010, convenience stores such as
Alfamart and Indomaret continued to expand their non-grocery product ranges. To support the World Cup in 2010, for instance, Indomaret obtained the license to be the official retailer of World Cup products in Indonesia and distributed these products in its outlets. Retailing in Indonesia remained
highly fragmented in 2010, with numerous traditional independent grocery and non grocery stores sprawled across the archipelago. In 2010, the top five companies Sumber Alfaria Trijaya, Carrefour Indonesia, Indomarco Prismatama, Matahari Department Store and Hero Supermarket maintained
their leading positions and continued to shape retailing in the country. With the advantage of ample access to financial resources and existing strong networks, these companies (which proved to be less susceptible to the impact of the economic crisis in the economy) strengthened their positions further
by conducting a variety of promotional activities and extending their service offerings. Increased consumer confidence in 2010 was a positive sign for retailing in Indonesia.
Low inflation and better than predicted GDP growth, coupled with increased spending across various product categories during the year, are expected to be carried forward into the forecast five years. It is expected that multinational and domestic retailers alike will continue their pursuit to
develop the potential of retailing in Indonesia and will widen their scope to include expansion into
other prospective areas outside Java, considering its large population and proportionately low retail
penetration. Last but not least, the Indonesian government’s apparent commitment to encourage
can adopt to retain customers, in Jakarta. Taking the case of a representative retailers. We attempt to identify the factors that influences a customer to continue purchasing from an Hypermarket.
THEORETICAL FRAMEWORK AND HYPOTHESIS DEVELOPMENT
Bendapudi and Berry (1997) have done considerable work in the area of customer retention. They conceptualized that relationship maintenance is motivated, either by desire (dedication based) or by dependency (constraint based). In dedication based relationships, customers are motivated
to maintained relationships because they genuinely want to do so, whereas in constraint based
relationships, individual maintain relationships because they believe they have no other option. Similar distinctions are noted in the employee firm attachment literature, where an employee may continue to work for a firm, either due to preference or because leaving is not considered a realistic option. In the context of organized retailing, Hypermarkets have two means of customers retention, namely, by striving to develop dedication based relationship and by increasing the constraints in a
relationship.
Regarding dedication based relationship development, Hypermarkets must strive to ensure that the customers perceive value for making purchases from the organized retail store. So, from the perspective of dedication-based relationship development, we consider customer perceived value as an indicator of customers retention. Customers perceived value is defined as customer’s overall assessment of benefits against sacrifice when shopping with a vendor (Thaler, 1985; Zeithaml, 1988; and Sweeney and Soutar, 2001). We adopt the same conceptualization of perceived value in this study. Organized retail store have two distinct advantages over small retailers, namely, convenience and entertainment (Telang et al., 2007). Hypermarkets create value in terms of a convenience of
providing a large variety and assortment of products at a single place. Moreover, Hypermarket stores attract many window shoppers. Hence, we adopt convenience and enjoyment as benefits to customers in purchasing from an organized retail store. From the sacrifice perspective we include perceived price of the product. Some customers perceives prices in organized retail store to be higher as compared to small retailers or vice-versa (Joe, 2007). Still others perceive that the price in these
stores are low (particular for known brands) (Joe, 2007). Regarding constraint-based relationship
development, Hypermarkets attempt to provide various loyalty points to the customers which could
be redeemed by way of fabulous discounts. This loyalty incentives may also bind the customers to
the store. For example, in the famous Shop ‘n’ Save in Singapore, a customer is provided with a chop
card which receives one chop when he has purchased $10 worth of merchandise. And the redemption
begins after 10 chops. Moreover, a customer has no redeem all the chops within one month only.
Such incentive bind the price conscious customers to a particular retail store.
From the dedication-based relationship maintenance perspective, we have considered perceived
savings in time and effort related to transactions with a vendor (Berry et al., 2002). Convenience is one of the most important benefits of shopping from an organized retail store (Telang et al., 2007). Shopping from an organized retail store is convenient because of the large variety of brands being made available at the same place. Greater convenience means less mental and physical energy
expended in obtaining a product, which reduces the time and effort thereby increasing value of purchasing from an organized retail store (Eggert and Ulaga, 2002). Hence, we hypothesize:
H1 : Convenience positively influences perceived value for customers.
As discussed earlier, enjoyment is defined as the extent to which the activity of purchasing from the organized retail store is perceived to be enjoyable in its own right (Venkatesh, 2000). The ambience of an organized retail store adds to the enjoyable experience of purchase. The stores are well lit and the items are arranged in an orderly and attractive fashion. Moreover, the customer can
spend leisure hours choosing items carefully as well as browsing through various discounts available
in the store. Youngsters spend their time window shopping in these stores. Also, impulse purchase are very high in these stores and they add to customers enjoyable shopping experience. Some enjoyment in one of the benefits of purchasing from an organized retail stores, would therefore, enhance overall perceived value of shopping from these stores. Hence we hypothesize :
H2 : Enjoyment positively influence perceived value for customers
As discussed earlier, perceived price is defined as a customers subjective perception of the observed price (total amount that the customers has to pay to get the product ), compared to the
reference price. Hypermarkets pass on part of the saving made bulk purchases in the form of reduced prices to the customers. Although the benefits is marginal and in most cases, customers may gets the benefits of a rupee or two in making the purchases, none-the-less the total savings adds up when customers make bulk purchases. Lower prices implies monetary gains which increase the overall value of purchasing from the organized retail store. Hence, we hypothesize:
H3 : Perceived prices negatively influences perceived value for customers
Continuance intention is defined as the likelihood that the buyers intend to purchase the product (Grewal et. al., 1998). Past studies on consumers decision-making (e.g., Kahneman and Tversky, 1979; Tahler, 1985; and Zeithmal, 1988) share the assumption that customers seeks value maximization. Customers prefer to conduct transactions with vendors whose product (including service) offer
maximal value. Customers evaluate different prospect. Particularly, they weight the value of each purchase in order to continue purchasing in any store. Empirical results (e.g., Zeithaml, 1998; and Dodds et. al., 1991) also support the view that perceived value lead to customers intention to continue purchasing from an organized retail stores. Hence, we hypothesize:
H4 : Perceived value positively influences customers intention to continue purchasing from organized retail stores.
Similar to frequents flyer point provided by airlines, Hypermarkets provided loyalty points redeemable toward future purchases and incentives (such as gift on large purchase) to motivate continued use of their services. The efficiency of loyalty incentives improving customers retention is largely unknown. Agency theory provides theoretical support for a positive association between loyalty incentives and continuence intentions. According to agency theory, firm can be viewed as principles and consumers as agents, engaged in a relationship. Incentives provided by firms can enhance consumers, utility, there by aligning their goals with that of the firms best interests, i.e., continue using firm services. Hence, we hypothesized:
H5 : Loyalty incentives are positively related to continuance intention
METHODS
The survey method was used for this study, the data was collected from 5 (five) Hypermarkets located in Jakarta. It offers a wide assortment of merchandise, ranging from regular grocery items to
gift items, stationary, cosmetics, crockery items, and fancy items, all under one roof.
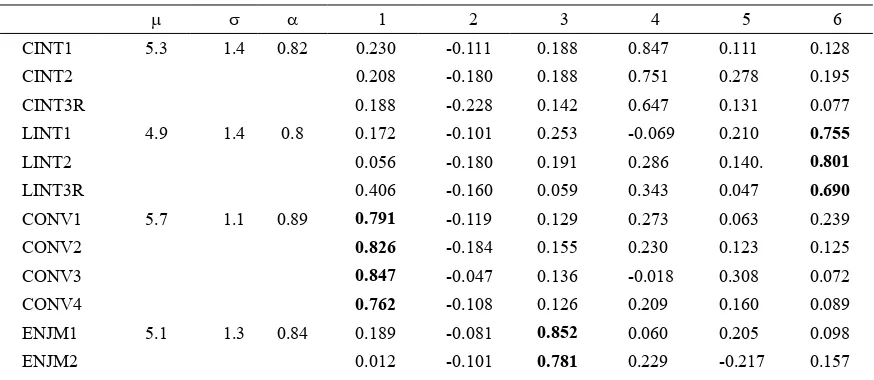
Eigenvalue greater than 1.0 in the initial solution (without rotation), the minimum being 1.05 the mean (m) standard deviations (s) and reliabilities (a) of the research variables. For asserting reliability, Cronbach’s alpha value are greater than 0.70. this high Cronbach’s alpha is also indicator
of convergent validity, which is the extent to which the scale correlates positively with other measure
of the same construct. The ratio of observation to variables is around 4:1 which, although not signification, is within acceptable limits. Also the sample size of 81 provides an adequate basis for the calculation of the correlation between variables. All the items were loaded on a district factor and
explained a total variance of 78.915%. there was no evidence of any cross loading, except ‘LINT3R’
which was also marginally (0.406) loaded on Factor 1. since. The cross-loading was only marginal, we
retained the factor. Since, there are a few cross-loading, it can be ascerntained that the measurement
scale shows discriminant.
Table 1: Principal Component Analysis
m s a 1 2 3 4 5 6
CINT1 5.3 1.4 0.82 0.230 -0.111 0.188 0.847 0.111 0.128
CINT2 0.208 -0.180 0.188 0.751 0.278 0.195
CINT3R 0.188 -0.228 0.142 0.647 0.131 0.077
LINT1 4.9 1.4 0.8 0.172 -0.101 0.253 -0.069 0.210 0.755
LINT2 0.056 -0.180 0.191 0.286 0.140. 0.801
LINT3R 0.406 -0.160 0.059 0.343 0.047 0.690
CONV1 5.7 1.1 0.89 0.791 -0.119 0.129 0.273 0.063 0.239
CONV2 0.826 -0.184 0.155 0.230 0.123 0.125
CONV3 0.847 -0.047 0.136 -0.018 0.308 0.072
CONV4 0.762 -0.108 0.126 0.209 0.160 0.089
ENJM1 5.1 1.3 0.84 0.189 -0.081 0.852 0.060 0.205 0.098
ENJM3 0.227 -0.139 0.766 0.207 0.289 0.095
ENJM4 0.180 -0.043 0.738 0.097 0.355 0.223
PVAL1 5.4 1.1 0.9 0.411 -0.153 0.288 0.235 0.466 0.203
PVAL2 0.363 -0.174 0.198 0.292 0.777 0.188
PVAL3 0.308 -0.211 0.237 0.234 0.789 0.209
PRCE1 3.5 1.6 0.9 -0.151 0.898 -0.099 -0.099 -0,055 -0.157
PRCE2 -0163 0.928 -0.075 -0.114 0.070 -0.109
PRCE3 -0.040 0.828 -0.126 -0.156 -0.290 -0.026
PRCE4 -0.119 0.626 -0.044 -0.364 -0.379 -0.213
Total Eigen Value 3.516 3.093 2.949 2.594 2.290 2.130
% of Variance 16.744 14.727 14.041 12.354 10.905 10.144
Cumulate % 16.744 31.471 45.512 57.866 68.771 78.915
Note : m -Mean, s - Standard Deviation, a - Cronbach’s alpha
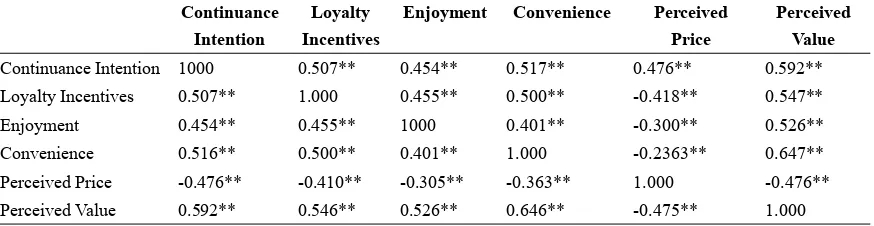
Validity, which is the extent to which a measure does not correlate with other constructs from which it supposed to differ. All correlation are significant, which implies that relationship exist between various constructs. Correlation > 0.6 between independent variables is an indication of
multi-collinearity in the data (Carlson et. al., 2000). The correlations between independent variables (convenience, perceived price and enjoyment) are well below 0.6. similarly, correlation between perceived value and loyalty incentives are also well bellow 0.6. this initial diagnostic test doest not
give any indication of multi-collenarity. We conducted the hypothesis test, using multiple linear
regression in SPPS 15.0
Table 2: Pearson Correlation Between Latent Variables
Continuance
Intention
Loyalty
Incentives
Enjoyment Convenience Perceived
Price
Perceived
Value
Continuance Intention 1000 0.507** 0.454** 0.517** 0.476** 0.592**
Loyalty Incentives 0.507** 1.000 0.455** 0.500** -0.418** 0.547**
Enjoyment 0.454** 0.455** 1000 0.401** -0.300** 0.526**
Convenience 0.516** 0.500** 0.401** 1.000 -0.2363** 0.647**
Perceived Price -0.476** -0.410** -0.305** -0.363** 1.000 -0.476**
Perceived Value 0.592** 0.546** 0.526** 0.646** -0.475** 1.000
RESULTS AND DISCUSSION
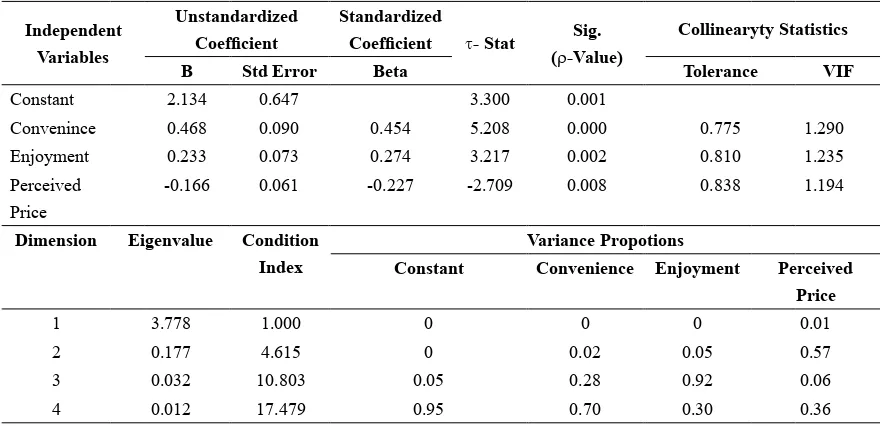
Table 3: Linear Regression Analysis Results (Perceived Value)
Independent
Convenince 0.468 0.090 0.454 5.208 0.000 0.775 1.290
Enjoyment 0.233 0.073 0.274 3.217 0.002 0.810 1.235
Perceived Price
-0.166 0.061 -0.227 -2.709 0.008 0.838 1.194
Dimension Eigenvalue Condition
3 0.032 10.803 0.05 0.28 0.92 0.06
4 0.012 17.479 0.95 0.70 0.30 0.36
Independent Variables (Convenience, Perceived Price, Enjoyment) --> Perceived Price
The result of the SPPS analysis are shown in Table 2. the total variance explained by the independent variables in perceived value is 52.9 % (adjusted R2). Table 3 shows that Convenience, Enjoyment and Perceived Price significantly influence perceived value as their p - value is less than 0.05. in order to ascertain whether there could be any multicollinearity between the independent
variables, we have included collinearity statistics in the results. The limits for multicollinearity
are that the condition index should be less than 30, tolerance should be between 0 and 1 and VIP value, between 1 and 2. since, the collinearity diagnostics confirm these three is no multi collinearity amongst the independent variables in this study.
Table 4: Linear Regression Analysis Results (Continuance Intention)
0.546 0.127 0.449 4.283 0 0.701 1.427
Loyalty Incentives
0.266 0.107 0.262 2.497 0.015 0.701 1.427
Dimension Eigenvalue Condition
Customers Retention Strategies for Hypermarket in Jakarta.
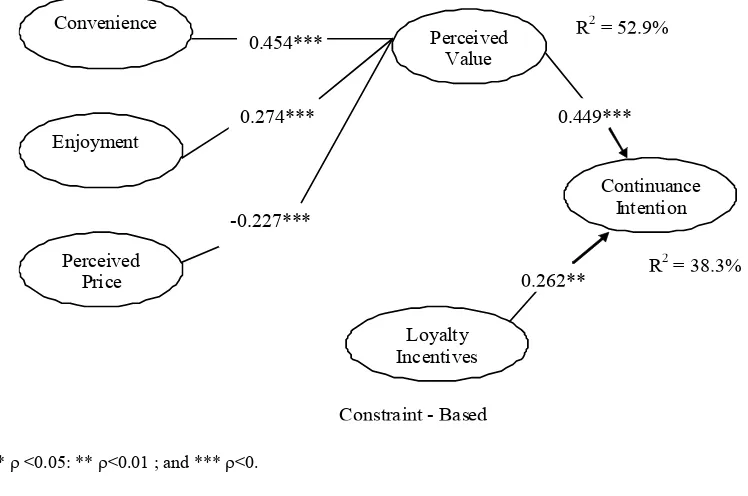
Figure 1: Results of Hypothesis Tests ( H1 to H2 )
Note: * r <0.05: ** r<0.01 ; and *** r<0.
CONCLUSION
In this research, we attempted to identify customers continuance intention from dedications-based and constraint based Perspectives. We found that both the perspectives are significant in improving customers retention by the organized retail store. We used the relations maintenance perspectives, as proposed by Bendaputi and Berry (1997). Both the dedication-based perspectives and constraint – based perspectives were found to be significant predictors of customers continuance intention in this
study. From the dedication-based relationship maintenance perspective, perceived value was found to be a significant predictors of customers continuance intentions. A great number of previous studies has confirmed that customers seek value maximization in their purchase (Kahneman and Tversky, 1979; Thalers 1985; and Zeithaml, 1988). In this study, we added enjoyment as an additional predictor of customers perceived value. Enjoyment is an effectives construct, which has not been examined in earlier studies. Recent studies (Venkatesh, 2000) heve begun examining enjoyment as a significant factors of customers perceived value and satisfactions. This research confirmed the significant role of enjoyment in customers value evaluation. However we found that convenience is a better predictor (Std. beta = 0.454) of perceived value than enjoyment (Std. beta = 0.247). in other words, cognitive evaluations of purchases. From the constraint-based relationship maintenance perspectives, loyalty incentives were found to be a significant predictors of customers continuance intention. This support the work of Bhattacherjee (2001) on customers intention to continue purchasing from retail stores.
In this study, we examined the factor that influence customers intention to continue purchasing from organized retail stores. Both dedication based relationship maintenance and constraint-based relationship maintenance had a significant influence on customers continuance intention. Hypermarkets should take steps toward improving convenience and enjoyment for customers in making purchases, as well as provide various loyalty incentives to encourage purchases from the store. The generalizability of the result of this study is, however, subject to some limitations. Many of the respondents were unwilling to provide their response. The data for this study was collected from the
customers of Hypermarket. It would be useful to replicate this study for a variety of Hypermarkets,
so that the robustness of a results can be established. For example, many Hypermarkets are opening their store on the outskirts of the city. The locations may therefore, play a significant role in customers continuance intention. Future studies may examine the same model for an Hypermarkets located in
Jakarta. The results of the study were also limited by time, and there for, we had to collect the data
over a limited period of time.
REFERENCES
Bendapudi N and Berry L L (1997), ‘Customer’s Motivations for Maintaining Relationship with
Service Providers”, Journal Retailing, Vol. 73, No. 1, pp. 15 – 37.
Berry L L, Saiders K and Grewel D (2002), “Understanding Service Convienece”, Journal of Marketing, Vol. 66, No. 3, pp. 1 – 7.
Carlson D S, Kacmar K M, Williams L J (2000), “Construction and Initial Validation of a Multidimesional Measure of Work Family Conflict”, Journal of Vocational Behavior, Vol. 56, No. 2, pp. 249 – 276.
Eggert A and Ulaga W (2002), “Customer Perceived Value: A Substitute for Satisfaction in Business Market?”, The Journal of Business and Industrial Marketing, Vol. 17, Nos. 2/3, pp. 107 – 118. Grewal D, Monroe K B and Krishnan R (1998), “The Effect of Price Comparison Advertising on
Journal of Marketing, Vol. 62, No. 2, pp. 46 – 59.
Joe (2007), “The hype about Big Bazaar in Kerala”, www.mutiny.in, accessed on March 17, 2008, available at http://mutiny.in/2007/05/28/the-hype-about-big-bazaar-in-kerala/
Kahneman D and Tversky A (1979), “Prospect Theory: An Analysis of Decision under Risk”, Econometrica, Vol. 47, No. 2, pp. 263 – 291.
Telang V, Nishad S, Sahu L, Hardel P N and Gupta S (2007), “Retailing Strategies for Organized Rtailers in India Semi Urban Markets”, Proceeding of the National Conference on Strategies for Creating Effective Global Organization – Technovision 2007, Shri Shankaracharya Institute of Management and Technology, Bhilai, India, October, pp. 143 – 149.
Thaler R H (1985), “Mental Accounting and Consumer Choice”, Marketing Science, Vol. 4, No. 3, pp. 199 – 214.