Agent-Based Modeling for Efficiency
Policy of Households' Electricity
Consumption in Bandung City
Abstract
There are many argumentations that the government subsidy in electricity, for holding down the electricity fares, has encouraged extravagant use of electricity. Therefore, the Government Budget (APBN) Burden for this subsidy becomes higher than it necessary. Some experts have argued that this money can actually be used for other necessary and urgent spending such as infrastructure development. The purpose of this research is to build an agent-based model and simulation to explore the dinamic of electricity consumption in Indonesia, especially in Bandung City. Several interviews were conducted about households' behaviors in consuming electricity to build the model. Then, the parameter was set based on the data collected with questionaire and secondary data source. The model was tested for its validity and sensitivity to the change in the controlled parameter. The simulation is expected to provide the government with a combination of electricity fare to various households electricity market segments to ensure an economic use of electricity. Some scenarios were run and the emergent property, the whole system electricity consumption,were observed to find out the best policy to encourage efficient use of electricity in the system.
Keywords: agent-based modeling, electricity consumption, electricity fare, households, simulation, electricity cost.
Devilia Sari
Master of Science in Management School of Business and Management
Institut Teknologi Bandung
Utomo Sarjono Putro School of Business and Management
Institut Teknologi Bandung
Dhanan Sarwo Utomo School of Business and Management
Abstrak
Hingga saat ini, banyak pendapat yang menyatakan bahwa subsidi listrik dari pemerintah, untuk menjaga agar harga listrik tetap rendah, telah menyebabkan penggunaan listrik yang berlebihan. Akibatnya, beban APBN untuk mensubsidi listrik menjadi lebih tinggi dari yang mungkin seharusnya dikeluarkan pemerintah. Beberapa ahli telah berpendapat bahwa anggaran tersebut sebaiknya dialokasikan bagi hal lain yang lebih penting dan mendesak seperti pembangunan infrastruktur. Tujuan dari penelitian ini adalah membangun sebuah model dan simulasi berbasis agen untuk mengamati dinamika konsumsi listrik di Indonesia, terutama di kota Bandung. Beberapa wawancara dilakukan mengenai perilaku rumah tangga dalam mengkonsumsi listrik untuk membangun model. Kemudian, parameter-parameter ditentukan berdasarkan data yang dikumpulkan dengan menggunakan kuesioner dan data sekunder. Model kemudian diuji validitas dan sensitivitasnya terhadap perubahan parameter terkontrol. Model dan simulasi diharapkan dapat memfasilitasi pemerintah dengan kombinasi tarif listrik untuk beragam segmen rumah tangga yang mampu memastikan pengunaan listrik yang lebih hemat. Beberapa skenario disimulasikan dan hasilnya, konsumsi listrik keseluruhan, diamati untuk mengetahui kebijakan yang paling baik sehingga mendorong penggunaan listrik yang lebih efisien.
Kata kunci: model berbasis agen, konsumsi listrik, tarif listrik, rumah tangga, simulasi, biaya listrik.
1. Introduction
There are extensive debates about government subsidies had create an overuse, inefficient use and wastage on resources in Indonesia (Perspektif Baru, 2002; Nugroho, 2005; Mukhtasor, 2010). Perspektif Baru (2002) and Nugroho (2005) especially stated that energy subsidies had create dependency on fossil fuel (BBM), and hamper the development of better national energy management and new energy infrastructure. The United Nations also had called some developing country to lower or even diminish the government subsidies on energy as one approach to deal with the climate change issue (The UNEP Division of Technology, Industry and Economics, 2008; Aguilar, 2009). Right now, the government keeps monitoring this electricity fare issue in order to decrease the state budget (APBN) burden caused by the electricity subsidy.
Recent approach used to relate electricity fare to the electricity consumption is by using mathematical modeling and experiment (Gleerup, Larsen, Leth-Petersen, &Togeby, 2010; Abduh, Abdullah, &Zain, 2003; Matsukawa, 2001; Aubin, Fougere, Husson, &Ivaldi, 1995; Sexton, Sexton, Wann, & Kling, 1989). While the Indonesian government used survey on economic ability to determine the electricity fare. This approach is only valid for studied interval and agent's attribute is fixed. Therefore, I proposed an agent-based simulation model to explore the dynamics of electricity usage in Indonesian electricity market, in particular the household market. This model and simulation have the abilities to create and simulate scenarios. Besides providing a better understanding, simulation results can also give suggestions to government on policy regarding to electricity fare, to encourage economic use of electricity.
Based on the problem statement above, thus, the research questions of this study are: (1) Can the proposed mechanism mimic the real condition of electricity demand in Bandung? (2) What the impact of
different type of electricity user to the whole electricity demand? (3) What is the impact of electricity fare to the economical use of electricity? (4) What is the best policy to support energy efficiency in Bandung? Therefore, the objectives of this research are: (1) to identify mechanism of electricity usage in the households. (2) To identify the sensitivity to electricity fare in the households. (3) To generate scenario to explore the dynamic in the electricity demand. (4) To find the best policy on electricity fare.
2. Literature Review
There are several agent-based research have been done about the electricity, but most of them discuss about the electricity market(Möst& Genoese, 2009; Zhou & Chan, 2009; Harp, Brignone, Wollenberg, &Samad, 2000). An electricity market is a market that resulted from the restructurization of electricity infrastructure and the liberalization in the electricity supply system (Zhou & Chan, 2009). This process moves the electricity industry from vertically integrated monopolies to multiple independent companies and replaces the centralized cost-basedmarket to supply- and demand-based competition. This structure is not yet applied to Indonesia electricity supply system. Even though today, power generation can be done by private company, the distribution, selling and buying process still conducted by the state owned electricity company (PT. PLN).
These papers observe how the electricity price is formed by the electricity market, and sometimes relate the price with green technology and reduction of carbon production in electricity industry . Therefore, some then become decision making tools related to electricity market, such as Simulator for electric power industry agents (SEPIA) , Electricity market complex adaptive systems (EMCAS), Short-term electricity market simulator-real time (STEMS-RT) and National electricity market simulation system (NEMSIM).
2.1. Agent-Based Modeling and Simulation
To simulate, mean to imitate a process by another process (Hartmann, 1996). Simulation means driving a model of a system with suitable inputs and observing the corresponding outputs (Axelrod, 2003). Furthermore, an Agent based simulation can be defined as a simulation of a system that consists of a number of software individuals, called agents. In this simulation, agents can interact with each other and with their environment (Gilbert, 2004; Smith &Conrey, 2007). In agent based model, an agent can have one to one relationship with an actor in the real world while, interactions among agents can likewise correspond to the interactions between real world actors (Gilbert, 2004). To simulate, mean to imitate a process by another process (Hartmann, 1996).
The first step is to identify the target system clearly. A target system is the real phenomenon that we want to understand better (Gilbert, 2008). After the research objectives are defined, we need to gather the body of theory about the target system.In the second step, the simulation design is started. In this step, first all types of objects in the simulation are defined (Gilbert, 2004). After that, attributes for all objects are specified.The third step is to design interactions among objects.
In the fourth step, we need to consider how to validate the model. Unfortunately, validation for an agent based model is very difficult (Gilbert, 2008). But, there are several concepts that can help us in validating an agent based model. There are two steps of validation in agent-based simulation: internal validation and external validation. In external validation, agent-based model accuracy can be classified into several levels (Axtell & Epstein, 1994):
Level 0: the model is caricature of reality that able to visualize agent's movement. Level 1: The model is in qualitative agreement with empirical macrostructure. Level 2: The model is in quantitative agreement with empirical macrostructure. Level 3: The model is in quantitative agreement with empirical microstructure.
The last step is to conduct virtual experiment in order to generate some hypotheses or explore the dynamic of social phenomena. In this research we what to know about the dynamic of the households' electricity consumption and conduct experiment to understand the relationship between electricity price and the electricity consumption pattern in households. The term dynamic here refers to how a single agent decision rule and interaction between them affect the whole electricity demand pattern, as the emergent properties we want to observe. Therefore, a modeling and simulation using agent-based model is appropriate for this research.
3. Model Building
The model was construction begin with interview with several PT. PLNs' customers, especially regarding their decision making process in using electricity appliances. Based on the interview, several assumptions were deducted. These assumptions then verified and consulted with other PT. PLNs' customers to ensure its validity. Based on these assumptions an agent-based model then constructed. This section will explain briefly the stage in building the agent-based model.
3.1. Basic Assumptions in Model
For building the agent-based model, in this study we used several assumptions. First, for electricity users in R-1 segment, users with the same electricity capacity are assumed to have same behavior in using their electricity appliances. However, users in R-2 and R-3 segments are assumed to have a same electricity behavior within its segments. Therefore, there are six behaviors in using electricity appliance: users with 450 watt, 900 watt, 1300 watt, 2200 watt, R-2 users and R-3 users.“R” is the code used by PT. PLN to distinguish between its consumers (i.e. “I” isfor Industries, “R” is for households and “B” is for businesses). These segmenting (e.g. R-1, R-2 and R-3) and its name are already set by PT. PLN.
All of the electricity appliances are grouped based on its relative importance to users. Thus, appliances in the same group have the same importance for an agent. Electricity consumption for each electricity appliance is generated randomly, but still based on real data about each type of the electricity
appliances. The real data here, obtained from the manufacturer, are the range of each electricity appliances consumption rate. Based on this rate or distribution we generate a random number that represent appliances electricity consumption. Another assumption is all agents have budget level for electricity cost, and if the cost is higher than its budget, then the users will try to lower its usage time of specific electricity appliance based on its relative importance for the users. However, if the cost is lower than the budget, it can do nothing or add another electricity appliance. Electricity budget is fixed throughout the simulation. This budget is initiate in the beginning of the simulation and cannot changed during the simulation is run.
Next assumption used in bulding this model is that electricity sources from PT. PLN were assumed to have unlimited capacity and continuously available for its customers. There are no problem with the electricity connection, therefore no blackout occurred during the simulation is run. Agents were also assumed to stay in its place/address as long as the simulation run and cannot move to another place. Agent's electricity capacity was assumed to remain the same and it cannot increase nor decrease its electricity capacity.
For example, if an agent has electricity capacity 900 VA then, it cannot decrease its electricity capacity to 450 VA or increase it to 1300 VA once the simulation is run. Lamp is assumed to be very important for all agents and won't be considered when an agent has to decrease their electricity consumption. However, its consumption will still be calculated in the model.And the last assumption is all agents reconsider their strategy regarding the time and electricity appliances used in their households monthly.
3.2. Agent Specification
In this study, agents are the electricity users which are the PT. PLN (persero) consumer in the household segment. PT. PLN used code “R” to represent this segment. The agents itself will be divided into several type of user based on their attributes, which includes their electricity capacity, personal values, and electricity appliances owned.
Every agent has attributes that represent their attribute in real life regarding the electricity consumption. As mentioned before, this attributes are their electricity capacity, electricity cost and consumption, personal values, electricity budget, electronic appliances owned and neighbor address.
No. Attribute Type Description
1 capacity Number Electricity capacity of the agent
2 agent_cost Number Electricity cost that have to be paid by the agent as much as his consumption
3 agent_consumption Number The electricity consumption of the agent
4 minimum_bill Number The minimum cost that has to be paid by the agent regardless its electricity consum ption
5 time_difference Number The time difference of usage time of an appliance that the agent have to reduce to meet its budget 6 lov String Personal value based on List of Values (LOV) of the
agent
7 change String The variable that connecting the lov variable to the relative importance of each appliances for the agent 8 budget Number The maximum amount of money allocated by the agent
to pay the electricity bill
3.3. Environment Specification Where Agents Interact
Agent will interact with other agent of his nearest neighbor using the world environment. A micro-world environment that is basically a two dimensional grid can “wrap” in any direction. This environment has been used by many agent-based researches, such as Druckenmiller and Acar (2009), Schwoon (2006), and Clough (2007). For example, should agents wander off the left edge of the world, they would appear on the right hand side of the grid; this is viewed as a torus implementation. The illustration on this environment can be seen in Figure 1.
No. Attribute Type Description
12 kitchen_time List A list of usage time of kitchen appliances owned by the agent
13 entertainment List A list of electricity consumption (watt) of entertainment appliances owned by the agent
14 entertainment_time List A list of usage time of entertainment appliances owned by the agent
15 personal List A list of electricity consumption (watt) of personal appliances owned by the agent
16 personal_time List A list of usage time of personal appliances owned by the agent
17 others List A list of electricity consumption (watt) of other appliances owned by the agent
18 others_time List A list of usage time of other appliances owned by the agent
19 position Number Show the position of electricity appliance in their list to be change its value
20 neighbor_address_x List The list of x coordinates of the agent’s neighbors 21 neighbor_address_y List The list of y coordinates of the agent’s neighbors 22 address Number The address of the agent’s neighbor that its choose to
imitate
(sambungan, Table 1. Agent Attribute)
Figure 1. Simulation Environment
3.4. Decision Rule Specification and Interaction Among Agents
In agent-based model, the behavior of agent in the model was represented by its decision rule. This decision rule were constructed by using basic assumption and based on the interview conducted in the beginning of this research. Then, the parameter set in the decision rule was gained from the survey conducted as explained in the next section.
Decision rule of each agent, in this case household, can be seen in Figure 2. After 30 iterations, each agent will calculate its electricity cost and compare it with its budget. When agent's budget is more than its electricity cost then agent will make decision whether he add appliance or do nothing. If the agent chose to add appliance, the new appliance to be added is imitated from one of its neighbor.
However, when agent's budget is less than its electricity cost, agent can choose to react directly by decrease usage time or decrease appliances used, or learn from its neighbor efficiency strategy. If agent react directly and chose to reduce usage time then it will select one group of appliances with the lowest importance according to the agent. It will then reduce the usage time of one appliance from the selected group randomly. If agent chose to decrease appliances used, then it will also select one group of appliances with the lowest importance.
However, one appliances choose randomly from that appliance group will no longer be used by the agent. If agent chose to learn from its neighbor then the agent will decide whether to imitate neighbor's usage time or imitate neighbor's appliances. If agent decided to imitate neighbor's usage time it will copy one of neighbor appliances usage time owned by the agent and that neighbor. If agent decided to imitate neighbor's appliances, it will discard one of its appliances that are owned by its neighbor.
3.5. Data Collection for Setting Parameter
For setting parameter in this model, data collected from secondary sources as well as primary sources. The following sections explain briefly about both of the data collection process and the analysis of the data to be used in the model.
3.5.1. Primary Data
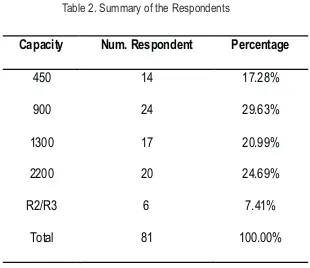
Primary data collected using questionnaire. We spread 150 Questionnaires, but only 86 questionnaires are returned and only 81 questionnaire data can be used for analysis in this research. Therefore, the return ratio is 57.33%. The number of population was524,970households; therefore the sample is about 0.02% of the total population. Even though this number was small, the data obtained from the questionnaire can be used for the model since in agent-based model the model is validate with certain validation procedure as describe in the previous section about agent-based model.
The questionnaire had 5 sections. First section is about general electricity data of a household. In this section, respondent asked to fill in the information about their households' electricity capacity, their monthly electricity bill and the budget they are willing to pay each month for electricity cost. From this section the data for parameter budget is obtained. The result of this section is as follows.
Capacity Num. Respondent Percentage
Second section is about the respondent personal values. In this section, respondent was asked to rate several statements regarding their personal values with 7-point likert-scale. These statements were taken from Kahle, Beatty, & Homer (1986), translated to Bahasa Indonesia and adjusted with Indonesian common culture. The data obtained then used to grouped the respondents into segments, a cluster analysis procedure suggested by Hair, Black, Babin, Anderson, & Tatham (2005) was performed.
This procedure includes two traditional approaches, hierarchical and nonhierarchical clustering. Both approaches were used sequentially. First, hierarchical cluster procedure was conducted to obtain an initial description of potential clusters within the data uses average linkage with Squared Euclidean distances. From this step four and five clusters were obtained as seeding point for the non hierarchical cluster analysis. The second step involves a k-means clustering procedure that is nonhierarchical. Raw data for items include in each factor of benefits sought from apparel provides the basis for the clustering procedure. From this procedure, five clustes solution was selected because it gave more specific characteristic to the cluster than the four cluster solution.
Third section in the questionnaire asked about the importance of electricity appliances for the households. For this section, respondent was asked to rate several electricity appliances based on their importance using 7-point interval scale. Respondent was asked to rate 1 if the appliance is not important in their household and rate 7 if the appliance is very important for their households. The electricity appliances listed in the questionnaire is based on the common appliances owned by Indonesian households, which are obtained from interview with several members of Bandung's' households.
Two last sections required the respondent to fill in its electricity appliances ownership and its electricity appliances usage time. The electricity appliances listed in this section is the same with in the previous section. However, in this section respondent is asked to fill how many of those appliances they owned and the type of the appliances.Similar list of electricity appliances also used in this section and the respondent is asked to check how their usage time for each appliance is. The ranges for usage time.
3.5.2. Secondary Data
Secondary data obtained from PT. PLN Bandung City Branch. The data including number and composition of PT PLN's customers, total electricity consumption, total electricity cost, and electricity fare system used in PT. PLN. All of these data can be seen in Table 3, Table 4, and Table 5.
Table 4. Electricity Consumption and Revenue Data from PT. PLN
Consumption (in kWh) Revenue (in Rupiah)
Consumer Segment August 2010 September2010
August
2010
September2010
R-1, 450 VA 10,015,592 13,161,106 4,284,230,237 4,307,952,368
R-1, 900 VA 41,813,406 42,282,626 23,828,783,904 23,999,787,777
R-1, 1.300 VA 22,864,261 23,042,905 16,415,878,989 16,936,972,639
R-1, 2.200 VA 18,970,407 18,983,349 13,894,147,561 14,268,701,372
R-2 11,249,111 11,345,463 9,292,585,046 9,662,323,565
R-3 4,766,591 4,803,422 5,467,083,210 5,545,179,547
Total 109,679,368 113,618,871 73,182,708,947 74,720,917,268
Table 5. Electricity Base Tariff for Households Data from PT. PLN Table 3. PT. PLNs' Customer in Household Segment in Bandung City
Fare Category Number of
MB1 = 40 (Usage Time) x Electricity Capacity (kVA) x Usage Cost **) With Minimum Bill (MB):
MB2 = 40 (Usage Time) x Electricity Capacity (kVA) x Usage Cost Block I Usage time : kWh per month divided by Electricity Capacity (kVA)
H1 : Frugal usage limit percentage to national average usage time x Electricity Capacity (kVA) H2 : Electricity Usage (kWh) - H1
Figure 3. Electricity Consumption And Electricity Cost Comparison
Table 6. Consumption and Cost Per Households Comparison
PLN’s households segment
Real Data Simulation Result
Mean Consumption
Mean Cost Mean
Consumption
Mean Cost
R-1, 450 V.A. 156.95 51,372.60 257.47 124,620.38
R-1, 900 V.A. 162.68 92,337.06 405.35 214,246.00
R-1, 1300 V.A. 225.89 166,030.85 561.24 443,382.09
R-1, 2200 V.A. 338.66 254,548.24 956.29 760,249.15
R-2 592.51 504,612.68 1,044.96 930,014.31
R-3 1,190.73 1,374,610.70 1,152.53 4,081,603.63
4. Experiment Result and Discussion
4.1. Model Validation
To do the validation input data to the model is the proportion of consumer segments and the distribution of electricity appliances in August 2011. The simulation was run with 10,000 agents and runs about 30 times. Thus, the simulation output from the second month is compared to the real data about electricity consumption and electricity cost in September 2011. This one month run to validate the model is chosen because of the assumption that the agent is fixed and he cannot change its electricity consumption. In this time frame the change in the number of agent and the change in the agent electricity capacity in the real world are still not significant.
The result in that shown in Figure 3 and Table 6 was the average of the 30 times simulations run. Even though result of the simulation shows quite different in number, the order from the highest and the lowest mean electricity consumption and mean electricity cost is similar. The difference in the number is mainly caused by the random number generation process when initiating appliances electricity consumption. The data use in generating this number is based on the highest power consumption claimed by the manufacturer, and not based on the real time usage of appliances electricity consumption. Therefore the result shows that the model has the external validity level II.
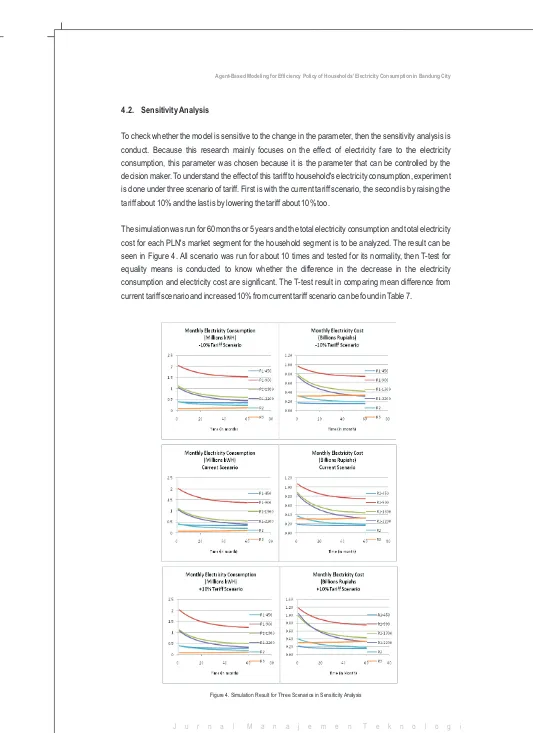
4.2. Sensitivity Analysis
To check whether the model is sensitive to the change in the parameter, then the sensitivity analysis is conduct. Because this research mainly focuses on the effect of electricity fare to the electricity consumption, this parameter was chosen because it is the parameter that can be controlled by the decision maker. To understand the effect of this tariff to household's electricity consumption, experiment is done under three scenario of tariff. First is with the current tariff scenario, the second is by raising the tariff about 10% and the last is by lowering the tariff about 10% too.
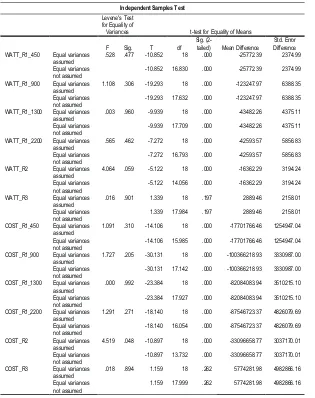
The simulation was run for 60 months or 5 years and the total electricity consumption and total electricity cost for each PLN's market segment for the household segment is to be analyzed. The result can be seen in Figure 4. All scenario was run for about 10 times and tested for its normality, then T-test for equality means is conducted to know whether the difference in the decrease in the electricity consumption and electricity cost are significant. The T-test result in comparing mean difference from current tariff scenario and increased 10% from current tariff scenario can be found in Table 7.
Table 7. T-test for Means Equality in Current Tariff Scenario and Increased 10% from Current tariff Scenario
Independent Samples Test
Levene's Test for Equality of
Variances t-test for Equality of Means
F Sig. T df Sig. (2-tailed) Mean Difference Difference Std. Error
-14.106 15.985 .000 -17701766.46 1254947.04
COST_R1_900 Equal variances assumed
1.727 .205 -30.131 18 .000 -100366218.93 3330987.00
Equal variances
not assumed
-30.131 17.142 .000 -100366218.93 3330987.00
COST_R1_1300 Equal variances assumed
.000 .992 -23.384 18 .000 -82084083.94 3510215.10
Equal variances
not assumed
-23.384 17.927 .000 -82084083.94 3510215.10
COST_R1_2200 Equal variances assumed
1.291 .271 -18.140 18 .000 -87546723.37 4826079.69
Equal variances
not assumed
-18.140 16.054 .000 -87546723.37 4826079.69
COST_R2 Equal variances
assumed
4.519 .048 -10.897 18 .000 -33096658.77 3037170.01
Equal variances
not assumed
-10.897 13.732 .000 -33096658.77 3037170.01
COST_R3 Equal variances
assumed
.018 .894 1.159 18 .262 5774281.98 4982866.16
Equal variances
not assumed
1.159 17.999 .262 5774281.98 4982866.16
From Table 7 we can see that there is significant difference between the current tariff scenario and increased 10% from current tariff scenario for most of the PLN's households segments. Exception was seen from the R-3 segment, both of the electricity consumption and the electricity cost mean was about the same. This result shows that the R-3 segment was not sensitive to the change in the electricity fare. From the table we can also see the minus sign is the mean difference, which means that the decrease in electricity consumption and electricity cost in increased 10% scenario is bigger that in current tariff scenario. Therefore, by increasing the electricity fare, the electricity consumption in PLN's household segment decreases. The biggest saving in electricity used was happen in the R-1, 900 V.A. segments for the decrease in electricity consumption is about 123.247kWH. Accordingly, similar result also occurred on the decrease in the electricity cost data. The comparison between current tariff scenario and decreased 10% from current tariff scenario also shows similar result with this result.
4.3. Experiment
Previous sections have shown that the agent-based model in this research is valid with level 2 validation and also sensitive to change in the parameter. Therefore, in this section some examples of scenario that can be build and test with this agent-based model.
4.3.1. Scenario A: Tariff without Fixed Cost and Block System
The R-1, 450 V.A. and R-1, 900 V.A. tariff systems consist of fixed cost and block system with different fare per block. In this scenario this fixed cost and block system is eliminated and changes it with flat rate, similar to other segments tariff.
Figure 5. Comparison On The Decrease Of The Electricity Consumption and Electricity Cost For Scenario A And Current Tariff Scenario
This scenario is run 5 times and the mean of all result is used for further analysis. To understand the effect of this change in the tariff system, the decrease of electricity consumption with this tariff scenario is compared with the simulation result using current tariff scenario. Both of the result can be seen in Figure 5. In both Figures we can see that there is significant decrease on the electricity consumption and electricity cost for the R-1, 900 V.A. segment. Even though the electricity consumption in the R-1, 450 V.A. segment increase, it was compensated by the decrease in the R-1, 900 V.A. segment. Therefore in total, both of the electricity consumption and the electricity cost are decrease when the fixed cost and block system for the R-1, 450 V.A. and R-1, 900 V.A. is replaced by the flat rate system.
4.3.2. Scenario B: Progressive Tariff Scheme
Figure 6. Comparison In The Decrease Of The Electricity Consumption and Electricity Cost For Scenario B And Current Tariff Scenario
5. Conclusion and Further Research
There are several conclusions that we can take from this study. First, This study shows that the result from the agent-based model have a quite similar composition of each PLN's households segment with the real data from PT. PLN (persero) Bandung city branch. The validation Despite of several limitation in the model built in this study, this result can be shows an ability to mimic the real condition of electricity demand in Bandung, especially when it is related to the electricity fare.
The different type of electricity user has different type of appliances and behavior in using electricity in their households. The different ability in paying their electricity bill also affects their behavior. R-1, 450 V.A. segment has the lowest mean electricity consumption and although its total electricity consumption is higher than R-2 and R-3 segments, its total electricity cost is still the lowest since its electricity tariff also the lowest among all segments. The second lowest mean electricity consumption is the R-1, 900 V.A. segment. However, because of its large number of member the total electricity cost become far higher than other segment and the total electricity cost also become the highest among all. When we see as a whole in time span 5 years of the simulation, most of the segments reaction is similar. However, only the R-3 segment tends to react differently from other segment and keep its electricity consumption and electricity cost quite flat.
When the electricity fare is increased, the households tend to lower their electricity consumption, except for the R-3 segment. This segment is very insensitive to change in the electricity fare. Because of the huge number of electricity user in segment R-1, 900 V.A., the increase of electricity fare in this segment can give big impact to the saving of electricity consumption in Bandung city. The next segment that gave quite high saving when the electricity fare was increased is the R-1, 1300 V.A. segment and R-1, 2200 V.A. segment.
To support energy efficiency in Bandung the increase in electricity fare can be used in Bandung city. The big impact in electricity saving is mainly happen if the electricity fare for the R-1, 900 V.A segment is raised, followed by the R-1, 1300 V.A and R-1, 2200 V.A. segment. However, this is cannot be applied to the R-3 segment, since this segment didn't shows any change in their electricity consumption when the electricity fare is changed. However, any combination of electricity tariff component can be change to meet government objectives as well as ensure the electricity efficiency in the households segment. One example of scenario that can be used for the government is the scenario B in the experiment section.
This scenario can reduce the state budget (APBN) burden with small impact to the PLN consumers, since the scenario is considering the buying power of each segment in the households segment. However, further research about the possible effect of this scenario when it applied must be done in the decision makin process regarding the implementation of the scenario.
For further researches, the data used in this model is the data in Bandung city. Conducting similar studies in other area and comparing them could give a better understanding in how the households in Indonesia react with the change in the electricity fare. Furthermore, by studying other sector of electricity user such as the commercial or the industrial sector might also gave better understanding in developing a better policy regarding the electricity fare to ensure the efficient use of electricity without sacrificing the community welfare.The model can also be improved for further studies to understand the increased in electricity demand and could help the government and PT. PLN (persero) to make plans regarding the development of power generator to satisfy its growing demand.
The composition of today's PT. PLN (persero) source of electricity is mainly fueled with oil and coal which is inexpensive and generate a high CO2 emission. Incorporating the possible renewable energy source and cheaper energy source to the composition of PT. PLN (persero) power source also can improve the model to understand its effect to the CO2 emission and align it with the PT. PLN (persero) wish to reduce its production cost. The simulation shows that R-3 segment is highly insensitive to price increase, therefore another studies focusing in this segment and investigating how their behavior in using electricity and why this behavior shown by the household can also conducted.
Reference
Abduh, S., Abdullah, C. S., and Zain, A. Y. (2003). Pricing On Electricity Tariff: An AnalysisUsing Electricity Consumption In Commercial Sector.
Aguilar, S. (2009). Dismantling Fossil Fuel Subsidies? Environmental Policy and Law 39 (6): 299. Aubin, C., Fougere, D., Husson, E., &Ivaldi, M. (1995). Real-Time Pricing Of Electricity ForResidential
Customers: Econometric Analysis of An Experiment. Journal of AppliedEconometrics (1986-1998): 175-195.
Axelrod, R. (2003). Advancing the Art of Simulation in the Social Sciences.Japanese Journalfor Management Information System, Special Issue on Agent-based Modeling 12 (3).
Axtell, R., & Epstein, J. (1994). Agent-Based Modeling: Understanding Our Creations. TheBulletin of the Santa Fe Institute: 28-32.
Clough, E. (2007). Strategic Voting Under Conditions of Uncertainty: A Re-Evaluation of Duverger's Law. British Journal of Political Science 37: 313–332.
Druckenmiller, D. A., & Acar, W. (2009). An Agent-Based Collaborative Approach to Graphing Causal Maps for Situation Formulation. Journal of the Association for Information Systems 10 Special Issue 222: 221-251.
Gilbert, N. (2004, December 18). Agent-based Social Simulation: Dealing With Complexity. http://www.agsm.unsw.eduau/bobm/teaching/SimSS/ABSS-dealingwithcomplexity-1-1.pdf. [Retrieved May 2011, 28].
Gleerup, M., Larsen, A., Leth-Petersen, S., &Togeby, M. (2010). The Effect of Feedback byText Message (SMS) and Email on Household Electricity Consumption: ExperimenalEvidence. The Energy Journal 31 (3): 113-123.
Hair, J. F., Black, W. C., Babin, B. J., Anderson, R. E., &Tatham, R. L. (2005).MultivariateData Analysis (6th Edition).New Jersey: Prentice Hall.
Harp, S., Brignone, S., Wollenberg, B., &Samad, T. (2000). SEPIA: a Simulator for Electricpower Industry Agents. IEEE ContrSyst Mag: 53–69.
Hartmann, S. (1996).The World as a Process.Simulation in the Natural and Social Sciences. InR. Hegselmann, U. Muller, & K. Troitzsch, Modelling and Simulation in the SocialSciences from the Philosophy of Science Point of View : 77-100. Dordrecht: Kluwer.
Kahle, L. R., Beatty, S. E., & Homer, P. (1986). Alternative Measurement Approaches toConsumer Values: The List of Values (LOV) and Values and Life Style (VALS). TheJournal of Consumer Research 13 (3): 405-409.
Matsukawa, I. (2001). Household Response to Optional Peak-Load Pricing of Electricity.Journal of Regulatory Economics: 249-268.
Möst, D., & Genoese, M. (2009).Market power in the German wholesale electricity market.TheJournal of Energy Markets: 47-74.
Mukhtasor.(2010, Januari 14).MenghapusSubsidiEnergi, Kebijakan Salah Kaprah.
Kompas.com:http://bisniskeuangan.kompas.com/read/2010/01/14/17114775/Menghapus.S ubsidi.Energi..Kebijakan.Salah.Kaprah [ Retrieved March 31, 2010].
Nugroho, H. (2005, January). Apakah persoalannya pada subsidi BBM? Tinjauan terhadap masalah subsidi BBM, ketergantungan pada minyakbumi, manajemen energi nasional,dan pembangunan infrastruktur energi.Majalah Perencanaan - BAPPENAS.
PerspektifBaru. (2002, April 23). PencabutanSubsidi BBM Akan Dorong Pemanfaatan Energi Alternatif. [ Retrieved March 31, 2010].
Schwoon, M. (2006). Simulating the adoption of fuel cell vehicles. Journal of Evolutionary Economics 16: 435–472.
Sexton, R. J., Sexton, T. A., Wann, J. J.-W., & Kling, C. L. (1989). The Conservation AndWelfare Effects Of Information In A Time-of-Day Pricing Experiment. Land Economics: 272-279.
Smith, E. R., &Conrey, F. R. (2007). Agent-Based Modeling: A New Approach for TheoryBuilding in Social Psychology. Personality and Social Psychology Review 11 (87): 87-104.
The UNEP Division of Technology, Industry and Economics. (2008). Reforming EnergySubsidies. Paris: United Nations Environment Programme.
w i k i p e d i a . ( 2 0 1 0 , J u n e 2 8 ) . e n . w i k i p e d i a . o r g. E l e c t r i c i t y market:http://en.wikipedia.org/wiki/Electricity_market. [Retrieved June 30, 2010}.