Jejak Vol 10 (2) (2017): 257-272. DOI: http://dx.doi.org/10.15294/jejak.v10i2.11292
JEJAK
Journal of Economics and Policy
http://journal.unnes.ac.id/nju/index.php/jejak
Productivity of Textile Industry and Textile Products
in Central Java
P. Eko Prasetyo1
Universitas Negeri Semarang, Indonesia
Permalink/DOI: http://dx.doi.org/10.15294/jejak.v10i2.11292
Received: March 2017; Accepted: May 2017; Published: September 2017
Abstract
This article aims at examining further the importance of productivity and effectiveness of product development in textile industry and textile products (TPT industry) in Central Java. The productivity analysis method uses the American Productivity Center (APC) model and the Mundel model. The method of analyzing the measurement of the effectiveness of new product development uses New Product Index (NPI), Feature Function Index (FFI), and Time to Market Index (TMI). Data input is used for the purposes of this analysis, especially input of labors, capital, materials and energy, and data output of production of the TPT industry studied. The result of research shows that based on productivity analysis both with APC and Mundel methods, the productivity decreased except only in the Capital input variable which productivity level did not decrease. Based on the Mundel model, in more detail the decrease in productivity levels occurs in workers > + 1 Foreman, sales worker, production worker, and manager worker. Furthermore, the new product development is also not effective yet, and the best strategy to be chosen in developing new products in new markets is diversification strategy. The implication of this research is that the TPT Industry in Central Java still has to continuously improve its productivity and improve the development of new products effectively using diversification strategy.
Key words :productivity, effectiveness, product development and diversification.
How to Cite: Prasetyo, P. (2017). Productivity of Textile Industry and Textile Products in Central Java. JEJAK: Jurnal Ekonomi Dan Kebijakan, 10(2), 257-272. doi:http://dx.doi.org/10.15294/jejak.v10i2.11292
© 2017 Semarang State University. All rights reserved Corresponding author :
Address: Building L2, 2nd Floor, Sekaran Campus, Gunungpati, Semarang
Email: [email protected]
INTRODUCTION
The phenomenon of productivity as the key to competitiveness in the era of free trade is increasingly concerned. In the economic analysis, besides being the key to the achievement of competitiveness, productivity is also a major driving factor for the growth of economists. Improved productivity is believed to be more able to improve the competitiveness and economic growth of a State. Therefore, productivity becomes one of the most important indicators to measure the ability of economic activity of a State. To measure the productivity of a State or an industry, it requires the same operational concepts of productivity measurement in a company. It means that productivity measurement both from the micro-economic and macro-economic aspects becomes more urgent to do because productivity is believed to be the key to success in the competition. In Figure-1 it is explained the need for an increase in productivity and industrial competitiveness.
Figure 1 describes that all allocation of industrial input factors should be used efficiently (optimally) in order to be able to produce the effective (maximum) output. It must be processed in quality in order to increase the productivity and competitiveness of the industry concerned. In other words, one effort to make to increase the competitiveness of the industry is to increase efficiency, effectiveness and high productivity.
Productivity is an average measure of production efficiency, and productivity measures are not the same as efficiency. Measuring productivity and efficiency is just the first step, and more important to do is the effort to increase productivity. Therefore, the meaning of productivity in concept can also be based on a belief that today must be better
than yesterday and tomorrow must be better than today. Simply, the total and partial productivity measurement can be done through the ratio of output per input.
Figure 1. Activities of the Need to Increase Productivity and Industrial Competitiveness
In Figure 1 it has been asserted that productivity is the key to successful competitiveness. Meanwhile, efficiency, quality, and effectiveness are the main elements in increasing productivity. In order to increase productivity so as to increase competitiveness, each allocation of inputs must be optimally (efficiently) used in order to produce maximum output (effectiveness); of course each allocation of inputs should be managed with a qualified process. It is the routine activities of industrial economic activities that must be continuously carried out and maintained and improved from time to time while maintaining the environment in order to create better productivity and sustainable industrial competitiveness.
259 JEJAK Journal of Economics and Policy Vol 10 (2) (2017): 257-272
quantity of output quantities to some or all of the most commonly used inputs for total input estimates. (4) Total Factor Productivity as the ratio of the total output size to the total input used in production. Based on the type of productivity measures mentioned, in this article the employment productivity measurement model (LP) is selected to use. The argument is considering that the TPT industry is a type of industry that tends to be labor-intensive.
In various literatures, there are still quite a wide range of productivity, productivity measurement, and productivity index. Suppose there are several types of productivity that can be viewed in strata those are macro (national) productivity, sectorial productivity, micro productivity, and individual productivity. The data used to measure the level of strata productivity usually uses the value of GDP or value added. However, based on the availability of some input-output data used in relation to the analysis of TPT industry productivity, this article emphasizes the use of Multi Factor Productivity.
The urgency of selecting the multi factor productivity measurement using the APC index model and the Mudel idle model as the analytical tool in this article is because the measurement of productivity is considered to be the most accurate measure in the business activities of TPT industry in Central Java. The limitations of the analysis in this article that only look at the productivity growth from year to year based on the input-output data in only a TPT industry are considered representative because it is not to see the level of productivity growth year by year among the industries in a region; so it does not need to use the growth share analysis based on strata data. Actually, if the additional growth share
analysis tools are used, the results will be more complete. However, without the use of growth share analysis tools it is assumed to be representative in order to see the productivity growth of TPT industry in Central Java concerned.
Another argument that further reinforces the above explanation is that in this article the additional tools of productivity analysis are used with approaches as follows: model of the American Productivity Center (APC) index and Marvin E. Mundel index model. The advantage of the Mundel index model is that it can see the rise of productivity in a more specific way although it has a weakness that is it cannot see quickly. Meanwhile, the advantage of the APC model is that it can see the increase or decrease in productivity more quickly and the weakness is that it does not know the level of productivity more specifically. This argument is the underlying the chosen combination of using both APC and Mundel methods in this article.
how effective the development of new products is produced by the TPT industry, how it can be responded by the old and new markets, and how effective the TPT industry is able to penetrate the market and to develop the new products.
To know the level of effectiveness of the new product development into the market, it can be seen through the following: new product index (NPI), feature function index (FFI), market penetration time index (TMI), and index of successful research and development (R & DSI). Effectiveness is one of the most important elements in productivity other than the element of efficiency and quality. The use of the word effectiveness in this article is defined as the occurrence of a desired effect or effect in an activity carried out by the textile industry in Central Java. Based on the results of the previous research, it has been described that the TPT industry in Central Java is technically efficient but economically not efficient. Something efficient is not necessarily effective and something effective is not necessarily efficient. However, the manifestation of efficiency and effectiveness of work is generally reflected in the level of productivity concerned. Therefore, the general formula of the relationship between productivity and effectiveness and efficient elements can be written as follows:
P ={𝑂𝑢𝑡𝑝𝑢𝑡 𝑔𝑒𝑛𝑒𝑟𝑎𝑡𝑒𝑑𝐼𝑛𝑝𝑢𝑡 𝑔𝑒𝑛𝑒𝑟𝑎𝑡𝑒𝑑 = 𝐴𝑐ℎ𝑖𝑒𝑣𝑒𝑚𝑒𝑛𝑡 𝑜𝑓 𝑔𝑜𝑎𝑙𝑠𝑈𝑠𝑒 𝑜𝑓 𝑟𝑒𝑠𝑜𝑢𝑟𝑐𝑒𝑠 =𝐸𝑓𝑓𝑒𝑐𝑡𝑖𝑣𝑒𝐸𝑓𝑓𝑖𝑐𝑖𝑒𝑛𝑡}
Notes:
P: Productivity
Based on the above formulation, it also means that productivity measurement here aims as a means of analysis of industrial management to encourage the achievement of production efficiency and effectiveness of
product development. Measurement of productivity by the APC index method will provide clear and comprehensive information about the sources of profitability improvement and industry competitiveness whether derived from productivity. Meanwhile, productivity measurement with Mundel method is to see and assess the increase and decrease productivity specifically from each input used.
RESEARCH METHODS
For the purposes of analysis in this article it takes secondary data as primary data and primary data as complementary data. The secondary data used is mainly related to the input-output variable data model. In accordance with the productivity analysis model and the effectiveness of product development, the input data is mainly data of labors, capital, raw materials, and energy data and also the income data from products, product price, product volume, and new product range launched during one year period of this research.
261 JEJAK Journal of Economics and Policy Vol 10 (2) (2017): 257-272
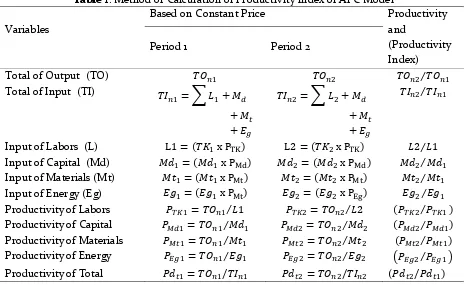
effectiveness index of product development. The variables used in APC productivity calculation are in the following: 1) Number of Inputs, 2) Number of Outputs, 3) Productivity Index, 4) Price Improvement Index, and 5) Profitability Index. Meanwhile, the variables used in the calculation of productivity of the Mundel model are in the following: specifically tends to be selected calculations against one of the input variables of labor production used. The argument is that the textile industry is a labor-intensive industry, so it is better to measure the level of labor productivity more specifically than measuring material index or other index. The method of calculating the productivity index of APC model is based on Table 1. Whereas, the
general formula of measurement of Resources Input Partial (RIP) from the Mundel index model referred to in this article is formulated as follows:
𝐼𝑃𝑀 = 𝑂𝐴𝑛𝑡 𝑂𝐴𝑛𝑑 𝐼𝑃𝑛𝑡 𝐼𝑃𝑛𝑑
𝑥 100 𝑜𝑟 𝐼𝑃𝑀= 𝑂𝐴𝑛𝑡
𝐼𝑃𝑛𝑡 𝑂𝐴𝑛𝑑
𝐼𝑃𝑛𝑑
𝑥 100
Notes:
IPm = Mundel Productivity Index
OAnt = Aggregate Output for the measured period
OAnd = Aggregate Output for the basic period
IPnt = TKi production input for the measured period
IPnd = TKi production input for the basic period
TKi = Input productivity for the measured labors in this research
Table 1. Method of Calculation of Productivity Index of APC Model
Variables
Based on Constant Price Productivity and
(Productivity Index) Period 1 Period 2
Total of Output (TO) 𝑇𝑂𝑛1 𝑇𝑂𝑛2 𝑇𝑂𝑛2⁄𝑇𝑂𝑛1
Total of Input (TI) 𝑇𝐼
𝑛1= ∑ 𝐿1+ 𝑀𝑑 + 𝑀𝑡 + 𝐸𝑔
𝑇𝐼𝑛2= ∑ 𝐿2+ 𝑀𝑑 + 𝑀𝑡 + 𝐸𝑔
𝑇𝐼𝑛2⁄𝑇𝐼𝑛1
Input of Labors (L) L1 = (𝑇𝐾1 x PTK) L2 = (𝑇𝐾2 x PTK) 𝐿2 𝐿1⁄ Input of Capital (Md) 𝑀𝑑1= (𝑀𝑑1 x PMd) 𝑀𝑑2= (𝑀𝑑2 x PMd) 𝑀𝑑2⁄𝑀𝑑1 Input of Materials (Mt) 𝑀𝑡1= (𝑀𝑡1 x PMt) 𝑀𝑡2= (𝑀𝑡2 x PMt) 𝑀𝑡2⁄𝑀𝑡1 Input of Energy (Eg) 𝐸𝑔1= (𝐸𝑔1 x PMt) 𝐸𝑔2 = (𝐸𝑔2 x PEg) 𝐸𝑔2⁄𝐸𝑔1 Productivity of Labors 𝑃𝑇𝐾1= 𝑇𝑂𝑛1⁄𝐿1 𝑃𝑇𝐾2= 𝑇𝑂𝑛2⁄𝐿2 (𝑃𝑇𝐾2⁄𝑃𝑇𝐾1 ) Productivity of Capital 𝑃𝑀𝑑1= 𝑇𝑂𝑛1⁄𝑀𝑑1 𝑃𝑀𝑑2= 𝑇𝑂𝑛2⁄𝑀𝑑2 (𝑃𝑀𝑑2⁄𝑃𝑀𝑑1) Productivity of Materials 𝑃𝑀𝑡1= 𝑇𝑂𝑛1⁄𝑀𝑡1 𝑃𝑀𝑡2 = 𝑇𝑂𝑛2⁄𝑀𝑡2 (𝑃𝑀𝑡2⁄𝑃𝑀𝑡1) Productivity of Energy 𝑃𝐸𝑔1= 𝑇𝑂𝑛1⁄𝐸𝑔1 𝑃𝐸𝑔2= 𝑇𝑂𝑛2⁄𝐸𝑔2 (𝑃𝐸𝑔2⁄𝑃𝐸𝑔1 ) Productivity of Total 𝑃𝑑𝑡1= 𝑇𝑂𝑛1/𝑇𝐼𝑛1 𝑃𝑑𝑡2= 𝑇𝑂𝑛2/𝑇𝐼𝑛2 (𝑃𝑑𝑡2/𝑃𝑑𝑡1)
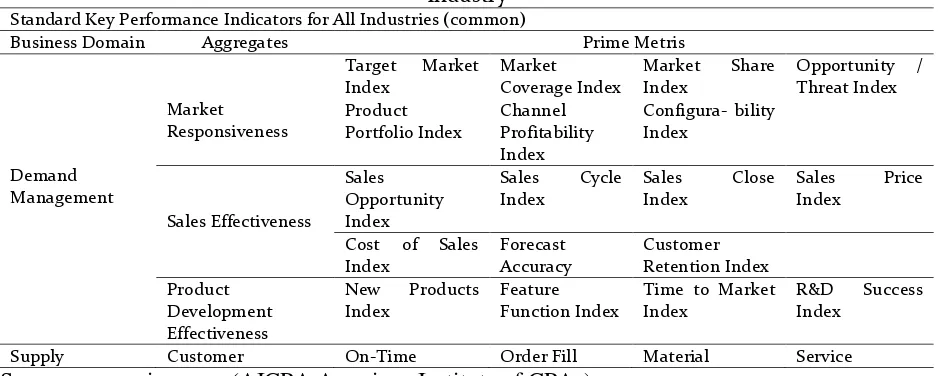
Table-2. Analysis Performance Model of Product Development Effectiveness Index of TPT Industry
Standard Key Performance Indicators for All Industries (common)
Business Domain Aggregates Prime Metris
Demand
Supply Customer On-Time Order Fill Material Service
Source: www.aicpa.org (AICPA American Institute of CPAs).
Figure 2 show that Matrix of Ansoff’s
Product is needed to create the right strategy for TPT Industry.
Existing Modified New
Products and Services
Figure 2. Matrix of Ansoff’s Product Source: Narula, Harvinder Singh, 2016
RESULTS AND DISCUSSION
The research results of the calculation of productivity index in this article can be viewed and explained based on APC Method and Mundel Method as presented in the form of cross-tables and matrix tables below. Meanwhile, the research results of the effectiveness of new product development can be seen and explained based on the ratio of value; New Product Index (NPI), Feature Function Index (TM), and Research & Development Success Index (RDSI), and
supported based on Matrix of Ansoff’s
Product (MAP) analysis. This is the research results that are obtained based on the
research methods presented above. The value of the change index rate in brackets is interpreted or read as a decrease in productivity concerned. Meanwhile, the value of productivity index rate greater than 1 is interpreted as increased productivity and productivity index rate less than 1 is interpreted as a decrease in productivity index.
Based on the calculation of productivity index value in Table-1, it appears that there has been a decrease in productivity level in labor productivity, material productivity, and total productivity, respectively (2.38%); (2.16%); and (0.99%). While the increase in productivity level only occurs in the capital productivity of 7.35% and the increase in energy productivity level occurs in that of 7.65%. Based on the constant base price data in 2001 presented in Table-1, it seems that the increase in capital and energy productivity levels is not able to increase the total productivity, and the total productivity decreases slightly less than 1% or only 0.9901. This indicates that the increase of business capital and raw material cost of raw materials is actually more likely to decrease the total productivity level in TPT industry in Central Java.
263 JEJAK Journal of Economics and Policy Vol 10 (2) (2017): 257-272
materials) turns out to be the main cause factor of the low level of productivity and competitiveness in textile industry and its derivative industries in Central Java. The results of this research further confirm the previous research conducted by Prasetyo (2014). The key factor in increasing productivity and industrial competitiveness lies in the readiness of the skilled industrial workers and the smooth availability of sustainable industrial raw materials. The results of this research confirms that the increase in raw materials of textile industry is the greatest factor in the decline in the
competitiveness of the industry, both comparatively and competitively, resulting in the declining total productivity. On the other hand, both labor and material input factors are also consistent and have given the highest productivity gains compared to the other two factors those are energy and industrial capital inputs. Thus, the results of this research support the theory that the textile industry is more likely to be labor-intensive and raw materials than capital and energy although the capital and energy required are also very large.
Table 3. Value of Productivity Index of APC Model Based on Constant Price
Variables Based on Constant Price (2010) Productivity Index
Change Index(%) Period 1 Period 2
Total of Output (TO) 6,392,157,201,000 7,099,394,910,000 1.1106 11.06 Total of Input (TI) 3,829,687,962,000 4,295,924,735,000 1.1217 12.17 Input of Labors (L) 771,230,043,000 877,406,550,000 1.1377 13.77 Input of Capital (Md) 372,482,773,000 385,377,887,000 1.0346 3.46 Input of Materials (Mt) 2,532,775,366,000 2,875,076,097,000 1.1351 13.51 Input of Energy (Eg) 153,199,780,000 158,064,201,000 1.0317 3.17 Productivity of Labors 8.288262703 8.091340223 0.9762 (2.38) Productivity of Capital 17.1609472 18.42190522 1.0735 7.35 Productivity of Materials 2.52377581 2.469289393 0.9784 (2.16) Productivity of Energy 41.72432363 44.91462877 1.0765 7.65 Productivity of Total 1.669106534 1.65258829 0.9901 (0.99) Source: Secondary Data, processed
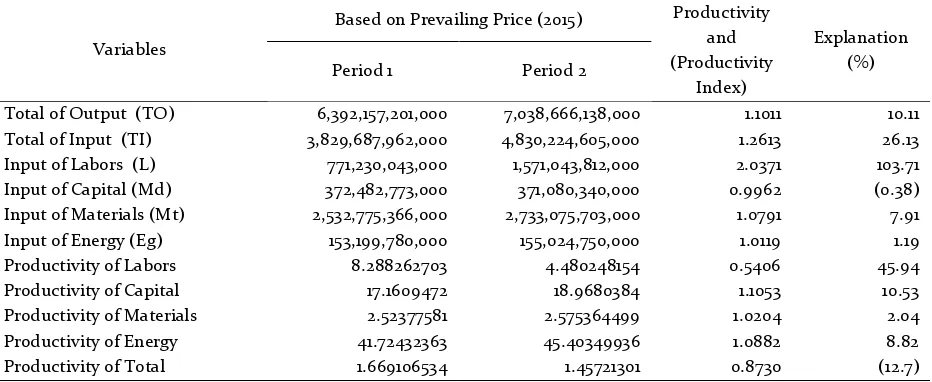
Table 4. Value of Productivity Index of APC Model Based on Prevailing Price
Variables
Based on Prevailing Price (2015) Productivity and (Productivity
Index)
Explanation (%) Period 1 Period 2
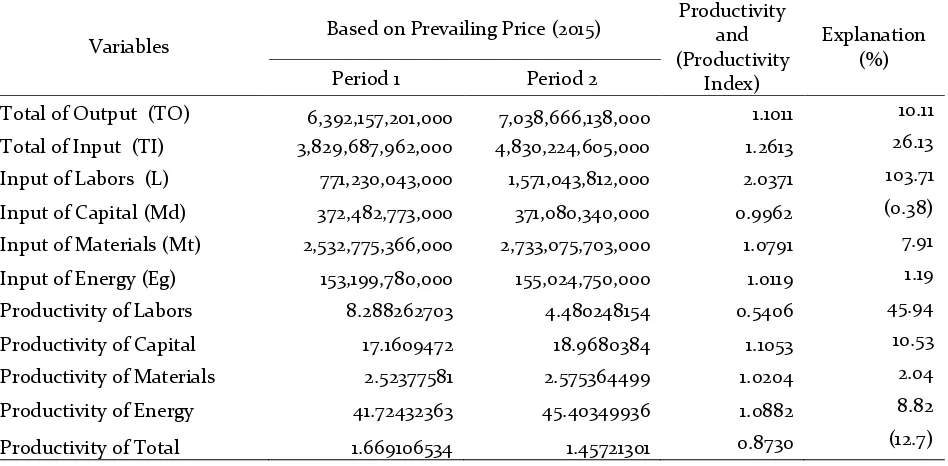
If based on the prevailing price at the time of this research (2015 to 2017), as shown in Table 4, it appears that the average input costs rose by 34.64% more than the increase in output yielded only by 10.1%. In the period of 2010 until the year 2015 cumulatively, there has been a considerable increase in wages due to the impact of the policy of civil servant salary increases and the police from the government of SBY followed by increases in industrial wages and rising inflation rate so that the increase in wage labor is not able to increase the total productivity. Although the increase in wages can increase the level of labor productivity that is large enough but it is not followed by an increase in capital. It does not have much impact on industrial output generated, even if viewed the total output value data in Table 3 and Table 4, the total output value slightly decreased, resulting in total productivity also decreased by 12.7%. The results of this research support the previous research of Prasetyo (2014),
which explained that if the impact of macro policy on labor wage increases above 20%, it would not able to increase the competitiveness and would only decrease the competitiveness and profitability of the textile industry only. The policy on wage increase may increase the competitiveness of textile industry in Central Java if the maximum cumulative rises only by 10%. If a policy on wage increase is above 10% and below 20%, it may only improve the comparative competitiveness and not increase the competitive one. Furthermore, to know the rate of price changes, it can use tools of the value of profitability index (IPF) compared with the value of productivity index (IP) when using the constant price. The research results of the complete price change (IPH) index can be seen in Table 6. If the problem of inflation rate rise is high enough during the research period, it is necessary to study the price change index to know more real level of productivity and profitability.
Table 5. Value of Productivity Index of APC Model Based on Prevailing Price
Variables Based on Prevailing Price (2015)
Productivity and (Productivity
Index)
Explanation (%) Period 1 Period 2
Total of Output (TO) 6,392,157,201,000 7,038,666,138,000 1.1011 10.11
Total of Input (TI) 3,829,687,962,000 4,830,224,605,000 1.2613 26.13 Input of Labors (L) 771,230,043,000 1,571,043,812,000 2.0371 103.71
Input of Capital (Md) 372,482,773,000 371,080,340,000 0.9962 (0.38)
Input of Materials (Mt) 2,532,775,366,000 2,733,075,703,000 1.0791 7.91
Input of Energy (Eg) 153,199,780,000 155,024,750,000 1.0119 1.19 Productivity of Labors 8.288262703 4.480248154 0.5406 45.94
Productivity of Capital 17.1609472 18.9680384 1.1053 10.53
Productivity of Materials 2.52377581 2.575364499 1.0204 2.04
Productivity of Energy 41.72432363 45.40349936 1.0882 8.82
Productivity of Total 1.669106534 1.45721301 0.8730 (12.7)
265 JEJAK Journal of Economics and Policy Vol 10 (2) (2017): 257-272
The possibility of changes in the price index due to the influence of inflation may cause the real level of productivity not increase in real terms, especially can negatively impact the level of labor productivity, which can ultimately reduce the total productivity level, competitiveness and effectiveness of new product development of the TPT industry.
For Industry, the price improvement index (IPH) is an external factor of an industry which conditions cannot be directly controlled by the industry, because the IPH codes in the industry are affected simultaneously from the outputs and inputs used by the industry. To be able to increase the profits or to keep improving profitability, then the best step to do is to increase productivity (to optimize the existing resources and to maximize the level of output). In theory, productivity is a determinant factor of profitability so that the input factors can be controlled by the industry concerned.
Based on the research results in Table-6, it appears that there is a significant increase in the price change index on labor index; capital index and material index are cumulatively able to rise by 115.92%; and the largest occurs in labor index. The problem, however, is that the increase is only followed by the decline in the energy index, such as the policy on fuel price
increase and electricity tariff rates during the research period of 5.98%, which is not able to increase the total productivity, and the total productivity decreased by 11.83%. This indicates that the impact of TDL and BBM policy has enough effect of multiplayer on TPT industry in Central Java. Previous research results of Prasetyo (2014) also explained that the material and energy inputs (increase in TDL and BBM) are the two most influential factors in reducing the profitability and competitiveness of textile industry. While the two main factors in this research that cause the decrease in the total productivity are the decrease in labor productivity and material.
There is a direct relationship among efficiency, productivity, and profitability. The results showed that the higher the efficiency level is, the higher the productivity level will be. According to Melo (2016), to increase industrial productivity can be done through increased potential energy efficiency. In addition to energy efficiency, other factors that can increase productivity are in the following: industrial management, labor system, lighting system. The conclusion of the research suggests that there is a direct relationship between energy efficiency variables and productivity and the reduced consumption of electricity.
Table 6. Value of Price Improvement Index of APC Model
Variables of Input
Index of Profitability
(IPF)
Index of Productivity
(IP)
Index of Price Change (IPH = IPF/IP)
Index of Capital (Md) 1.1053 1.0735 1.0296
Index of Materials (Mt) 1.0204 0.9784 1.0429
Index of Energy (Eg) 1.0119 1.0763 0.9402
Index of Labors (L) 2.0371 0.9762 2.0867
Index of Total 0.8730 0.9901 0.8817
The increase in the average productivity by 4.96% is an evidence of a direct positive proportional relationship between energy efficiency and increased productivity of the textile industry in Brazil.
The research results show that the growth of productivity levels is driven more by increasing the human resource capacity of their workers in running high-tech machines so that their work becomes more technically efficient. This means that the technical efficiency level in the textile industry has proven to be one of the main drivers of productivity. The results of this research support the results of the previous research conducted by Rakhmawan (2012) that the growth of textile industry productivity is more influenced by the technological improvements and the skills of workers in operating high-tech machines. In addition, based on the econometric estimate of the previous research results, it also indicates that the increase in efficiency will be positive and significantly affect the increased productivity of TPT industry. The results of this research also support Ikasari's (2014) research result, which has recommended that to develop TPT industry in Central Java requires an improvement in investment climate and business climate and also an improvement in human resource capability. Therefore, productivity calculations from the side of labor factors should be measurable and understood further and more comprehensive. On the other hand, the results of this research are also in line with the previous research conducted by Chaudhary (2016). According to research result of Asiya
Chaudhary’s (2016), it stated that most of the
low productivity in the manufacturing industry including in the textile industry is caused by the following ones: labor unrest, poor work attitude, inefficient organization or
management, and unfocused government policies. Chaudhary's (2016) research results also confirmed that productivity in the textile industry can be enhanced through increasing the knowledge and skills of workers, organizing training programs with experts from both India and abroad, arranging collaboration with similar industries, and achieving industrial efficiency and also government policy support to remove all weaknesses in the existing textile industry.
The calculation of productivity with the APC model is to look at the overall input variables used and the resulting output, then the excess calculation of productivity index values based on this APC model can see more quickly whether the total productivity level increases or decreases as described above. However, this APC method has not been able to find out more specifically from each input used to see if its productivity is decreasing or increasing. Therefore, to overcome the deficiencies in the APC method, it is complemented by the Mundel method. The Mundel method is able to look more specifically at the impact of each input used on the measured productivity level, although otherwise the Mundel model is less able to see faster the total productivity level whether it increases or decreases. Therefore, the purpose of both APC and Mundel methods is to complement each other so that the productivity level analysis can be better known more quickly and in more detail and more completely.
267 JEJAK Journal of Economics and Policy Vol 10 (2) (2017): 257-272
more in line with the reality, then the calculation of this index used the base price of the year (2015), so if there is a different value with the productivity value of APC model, it is only due to the price level used.
Based on the productivity value in Table 7, it appears that the highest productivity level of Mundel model is from labor and business capital inputs that increase more than 100%. Whereas, the productivity of the material and energy input is only 92.67% and 98.82%. Furthermore, in more detail, there are four levels of productivity index that have decreased respectively for inputs in the following: Workers > + 1 Foreman decreased by 12.53%, Sales worker decreased by 8.32%,
production worker decreased by 6.92%, and Manager workers decreased by 4.04%. The highest increase of productivity level was contributed by the labor productivity that is Workers > + 2 Foremen that increased by 35.5%, followed by the second highest increase in productivity in which the Secretary worker increased by 27.33%, while the other productivity only increased by 8.04. Based on the Mundel model, the level of productivity can be seen in detail as shown in Table 7, with the highest level of productivity in the labors: Workers > + 2 Foremen is 135.50% or increased by 35.5%, and the lowest level of productivity occurs at the labors: Workers > + 1 Foreman is only 87.47% or decreased by 12.53%.
Table 7.
Value of Comparison Tabulation of Productivity Index of APC Model and Mundel
APC Model Mundel Model
Variables Index of Productivity Variables Index of Productivity
Capital 1.0735 Capital 1.0038
Materials 0.9784 Materials 0.9267
Energy 1.0763 Energy 0.9882
Labors 0.9762 Labors: 1.8500
Labors of Production 0.9308
Workers of Production & Others 1.0123 Male Workers of Production 1.1838 Female Workers of Production 1.0328
Manager 0.9596
Secretary 1.2733
Accountant 1.1157
Administrative Staff 1.1524
Driver 1.1047
Security Guard 1.0692
Selling Officer 0.9168
Foreman / Inspector 1.1260
Workers < Foremen 1.0523
Workers > + 1 Foreman 0.8747
Workers > + 2 Foremen 1.3550
Workers > + 3 Foremen 1.0034
Experts 1.0037
Based on the above information, it can be interpreted that if the workers are supervised by two foremen or supervisors, it will be more able to increase the highest work productivity; if they are supervised by three foremen or supervisors, the level of productivity will be lower; if they are supervised only by one foreman, it will actually lower the productivity level workers. This phenomenon implies that the largest marginal revenue is when workers in the TPT industry are only supervised by two foremen, not more and not less than two. If they are only supervised by one foreman, the level of productivity will decrease; and if they are supervised by three foremen, the productivity level can still increase but not in the maximum rate.
The research results confirm that the changes in the worker's good mental attitude when supervised are more able to increase the productivity of industrial workers. The research results support the results of the previous research by Rajib, Md. Monirul Islam and ATM Adnan (2016). They described the results of research through efforts to analyze the potential for increasing the garment productivity by applying non-monetary processes associated with changing the behavioral aspects of readymade garment workers. This study shows only a modest change in worker behavior, and the proper supervision may result in tremendous garment productivity improvements that can make the readymade garment products more competitive for the foreign buyers.
Furthermore, the development of new products is an activity undertaken by the industry to face all possibilities, so that it can still provide greater efficiency to the industry itself and the consumers. In other words, the development of new products is a strategy for the industry growth through the activity of
offering the new products that are modified into the current market segmentation or the new markets. However, the development of the new products often changes according to the changing needs and desires. Therefore, the development of the new products should be measured and its level of effectiveness should be known.
New product development strategy can be done by an industry through the followings: shape improvement, simplification, re-establishment, adding designs or models in order to improve customer or customer satisfaction. In addition, in general there are several objectives in the development of new products as follows: to increase sales turnover, to gain competition, to utilize production sources or waste materials to increase industry profits, to prevent the
consumer’s boredom, to simplify products, and
to maintain the customer’s desires and
satisfaction. To achieve these objectives, an industry often conducts constantly changing strategy, so it is necessary to measure the index of the effectiveness level of new product development strategies undertaken so that the strategy will not gain wrong target.
In this article the effectiveness of new product development strategies through index calculation has been measured as presented in the research method above. Based on the value of the new product index (NPI), it aims at identifying the industry's efforts to adapt its
products in response to changes in customer’s and prospective customer’s demand. The results
269 JEJAK Journal of Economics and Policy Vol 10 (2) (2017): 257-272
in order to be able to provide greater value-added industries.
While based on FFI value, there are no many changes in measuring the number of the new product component design items launched during this research period compared with the total component in the industrial products because FFI value only equals to 9.52%. This is in line with the number of product designs that are launched, which is not a lot that is only two new designs of 21 design components that were launched during the period.
Furthermore, has TPT industry been on time to penetrate the market that is to identify the ability of the new product development function? The index value of this time to market index (TMI) is measured based on the average time required to launch the new product. The research results show that TPT industry very rarely do the development of new products into the market. During the period of seven years of proxy this research was conducted only once that is a new product development through modified product design and utilization of production resources. In this research, the deadline for the development of the recommended product (default upper time bound) for MTMI is five years. If the TMI value is converted between 0 and 1, the higher TMI value indicates the lower ability of new product development functions. Conversely, the higher the modified TMI (MTMI) value indicates the higher ability of new product development function of TPT industry. Based on the information, the research results show that TMI Value (7/2) = 3.5 years, while the MTMI value is {1 (3.5 / 5)} = 0.3. This indicates a higher value of TMI, which means that the ability of the new product development function in TPT industry in Central Java is
getting lower. This is in line with the MTMI value that is getting smaller close to zero which means that the capability of new product development function in TPT industry is also getting lower.
Based on the value of RDSI index, the ability of industrial product development function to realize the new product launch into the market is also still low that is only 28.57%. This value is gained from a period of seven years running that only launched two new products of development. The higher the RDSI index value indicates the better ability of new product development functions to improve. The results of this research show that the TPT industry in Central Java very rarely changes into the new design, so that it is not surprisingly if the consumers also rarely know it. Therefore, based on the values of the index, it can be concluded that the strategy of developing new products in the textile industry in Central Java is still less effective.
In general, based on the research results, it can be stated that the effectiveness of new product development in TPT industry in Central Java is very important to do, especially to the exported products. Through the process of product innovation development, it will produce the qualified products that have the good export power. The challenges faced related to the effectiveness of the development of the new products is becoming increasingly wider, both from the internal and external aspects of the industry. Therefore, the textile industry must be able to change the system of product ordering so there will be no loss and it does not only meet
the customers’ demand anyway, but there will be
In facing the changing and dynamic economic conditions, the TPT Industry in Central Java must also have a good business strategy to maintain the existence and to continuously grow and have the strong power. Ansoff's matrix provides a logical framework on which TPT industrial enterprises can be developed. Generally there
are four main headings in the Ansoff’s matrix,
but based on the research methods above, there are six headlines as an alternative strategy to choose. Nevertheless, in fact, the Ansoff matrix simply used in this research only talk about two dimensions only those are products and markets. The first thing to examine about is what is sold (the product) and the second thing to review to whom the product is sold (the market). Further in this framework, Ansoff's matrix offers the six alternatives of most likely and best possible action options to be chosen by the industry. Some of the preferred options are as follows: 1. Doing a market penetration only for the
existing products
2. Performing a market penetration for the new products
3. Selling the existing products to the existing markets.
4. Extending (expanding) the existing products to the new markets.
5. Developing the new products for the existing markets.
6. Developing the new products for the new markets
The choice of such activities should be cautious and should be based on guidelines relating to the previous decisions. Based on the results of research and related decisions, in this research it is selected to develop the new products in the new markets that are the export-oriented markets and not only to meet the regular customers, but also to find the new customers.
Based on the decision and based on Ansoff Matrix Product in Figure 2, the strategy that must be done by TPT industry in Central Java is Diversification Strategy. Furthermore, the first diversification strategy that must be done is the diversification of the new products that can then be followed by a strategy of price diversification. The research results of Ansoff matrix model complement and support the index method in measuring the effectiveness of new product development.
The results of this research that confirms the strategic importance of maintaining the
customer’s satisfaction through new product
development is in line with previous research conducted by Militaru C., (2014). The research results confirm it through dissemination. Dissemination of quality functions is a very useful method that facilitates communication in action planning and decision making in new product development actions tailored to actual consumer demands. It brings new products closer to what customers want and reduces design time and cost for this process. The QFD application in the textile industry can bring the Romanian economy as a competitive advantage needed for the continuity of the organization in this field.
271 JEJAK Journal of Economics and Policy Vol 10 (2) (2017): 257-272
their customers, will be able to grow in the 21st century global business environment.
CONCLUSION
Based on the method of calculating the productivity level of APC model and Mundel model, it can be concluded that TPT industry during this period of research has decreased in its productivity level, which further gives impact on the competitiveness of this industry that remains low. In addition, the new product development strategies have also not been effectively implemented. Based on the research of the ratio of the index value of the effectiveness of new product development and Anssof Matrix, it can be concluded that the best strategy is a diversification strategy that is getting closer to the customers as they expect. The results of this research also strengthen the previous research conducted by QFD method by Militaru, (2014). The implication and recommendation of this research is that the TPT industry and its related derivative industries in Central Java should continue to improve efficiency, effectiveness, and high productivity as the key to continuous improvement of the industry competitiveness and strive to always improve the development of the new products as the customers expect. The implications are also in
line with the results of Farhatun Nabi’s (2015)
research, which confirmed that to address current problems and challenges, the industry must improve the production efficiency and productivity, reduce the lead time, and ensure the proper quality requirements.
REFFERENCE
Case, K. 2005, Advances in Manufacturing Technology VIII: Proceedings of the Tent National. Taylor & Francis e-Library. London. Hal. 71-78
Chaudhary Asiya, Mohammed Pervej and Neshat Anjum, 2016, Make in India and Productivity of Indian Textiles Industry: A Case Study Bombay Dyeing & Mfg. Co. Ltd IRACST, International Journal of Commerce, Business and Management (IJCBM), Vol. 5, No.1, Jan-Feb 2016, IRACST, Aligarh Muslim University: India
Diewert W. Erwin, 2017, Productivity Measurement in the Public Sector: Theory and Practice, Discussion Paper, 26 Januari 2017, Vancouver School of Economics, Canada: University of British Columbia, diakses 7 Maret 2017, Sumber, https://ideas.repec.org/e/pdi117.html
Diewert W. Erwin and Alice O. Nakamura, 2005, Concepts and Measures of Productivity: An Introduction Services Industries and the Knowledge Based Economy, Columbia: University of Calgary Press. Farhatun Nabi, Rezwan Mahmud, Md. Mazedul Islam, 2015,
Improving Sewing Section Efficiency through Utilization of Worker Capacity by Time Study Technique, International Journal of Textile Science, 2015, 4(1): 1-8 DOI: 10.5923/j.textile
Ikasari Hertiana, Uda Farida, dan Ngatindriatun (2014), Efficiency and Productivity of Textile Industries and Products in Central Java, Journal of Economics and Sustainable Development, Vol.5, No.19, 2014, online www.iiste.org
Melo Miguel Otávio, Ricardo Moreira and Vanessa Pereira, 2015, Productivity And Energy Efficiency: A Case Study in The Textile Industry In Brazil, Iberoamerican Journal of Industrial Engineering, Florianópolis, SC, Brasil, v. 7, n. 13, p. 196- 215, 2015 Militaru C., Cristina B., Daniel LS and A Zanfir, 2014, QFD–
A Modern Method of Products Development in the Textile and Clothing Industry, International Journal of Academic Reseacrh in Accounting, Finance and Management Sciences, IJARAFMS, Vol 4, No. 3, July, 2014, pp, 89-98, HRMARS Competitiveness and Efficiency of Textille Industry in Central Java, Economic Journal of Emerging Markets, Vol 6, Issue 2, Oktober 2014, pages:69-140, Yogyakarta: FE UII
February 2016 edition vol.12, No.4 ISSN: 1857 – 7881 (Print) e - ISSN 1857- 7431
Rakhmawan, Catur Basuki, Djoni Hartono, dan Agni Alam Awirya (2012) Efficiency and Import Penetration on the Productivity of Textile Industry and Textile Products, International Research Journal of Business Studies, Vol.5 No. 3, IRJBS
Richard, Jeremy A., 2011 “Productivity Modeling”,
Project Number: MQP SAJ-A963: Worcester Polytechnic Institute
Roger, S. and N. Sharif. 2007. Understanding and Acquiring Technology Assets for Global Competition. Technovation: The International Journal OD Technological Innovation, Entrepreneurship and Technology management.http://www.google.co.id.
Saari, S., 2006. Productivity. Theory and Measurement in Business. Productivity Handbook (In Finnish). MIDO OY. p. 272. Espoo: Finland