Media Trend
Berkala Kajian Ekonomi dan Studi Pembangunanhttp://journal.trunojoyo.ac.id/mediatrend
Development of Strawberry Farming in Central Java
Dennanda Elpharani1*, Endang Siti Rahayu2, Mei Tri Sundari3, Ernoiz Antriyandarti4
1,2,3,4 Study Program of Agribusiness, Faculty of Agriculture, Sebelas Maret University, Solo, Indonesia
A B S T R A C T
Informasi Artikel
This research aims to know the farming expense, revenue, income, feasibility and competitiveness of strawberries enterprises in Serang Village sub-district of Purbalingga Karangreja. The basic method of this research is descriptive analysis. The location was purposely determined in Serang Village at Karangreja District, Purbalingga appropriate research purposes. Serang Village Purbalingga was chosen as the location because the production of Strawberry in Purbalingga is the highest among the other regions of producing strawberry in Central Java. The sampling method for the farmers used stratified random sampling with 40 farmers as respondents based on farmer’s strata of the land. The data used are primary data and secondary data. The data analysis method used is the analysis of farming, the circulation of B/C ratio, and Domestik Resource Cost (DRC) analysis to determine strawberry competitiveness in purbalingga by comparative and competitive advantage.The result showed that the average total cost of farming expense in Serang is Rp18,456,217 per farming per season. The average farmers revenue is Rp39,081,320 per farming per season. The average farmers income is Rp20,625,102 per farming per season. The statistic of farming feasibility is 1.12 which means strawberry farming in Serang is profitable. Strawberry farming in Serang has comparative advtange which Domestik Resource Cost is Rp 6,013.43. Strawberry farm at Desa Serang showed that the comparative and competitive advantage is 0.42 and 0.44 which means that strawberry farming is financially an economically efficient and competitive in internasional market. This indicates that the domestic demand is more profitable if supplied by domestic production rather than import.
Sejarah artikel:
Diterima September 2017 Disetujui Oktober 2017 Dipublikasikan Oktober 2018
Keywords:
Domestic Resource Cost, B/C Ratio,
© 2018 MediaTrend
Penulis korespondensi:E-mail: [email protected]
Preface
Indonesia is known as an agrarian country which means a country that rely on agricultural sector either as a livelihood or as a support for development. The agri-cultural sector is the third largest after the industrial sector and trade sector as the largest contributor of Indonesia economic growth. It is makes the agricultural sector as a potensial market for domestic products either for production or consumption, es-pecially for products was produced by the food crop sub-sector, includ of horticultural agribusiness. The success of horticultural agribusiness is by selecting of comodities which has high economic value. Another thing to be considered in the selection of commodities is the potential possessed by the area of exploitation.
Horticultural products type was widely consumed by the people is the fruit. Fruits that have been widely developed or cultivated in various regions in Indonesia are strawberry fruit. In accordance of the strawberries development in Indonesia, Central Java is one of the Provinces are pro-ducing strawberries. Central Java Province consists of 29 districts where strawberry-producing areas in Central Java include Purbalingga regency, Wonosobo, Tegal, Magelang, Karanganyar and Pekalongan regency. Purbalingga regency has the biggest or highest strawberry production among the 6 (six) other strawberry pro-ducing districts at Central Java Province. However, the number of high production in a region, does not a guaranted that a commodiry has high competitiveness as well. Therefore, it is necessary for doing a research to know the competitiviness of strawberry fruits in Purbalingga Regency with good farming management which is expected to increase farmer income and prosperity.
Research Methods
The Analysis of Strawberry Farming The quantitative data was
tabulat-ed and configurtabulat-ed in the same unit on the
farming analysis. According to Soekartawi (1995), the income of farming is the
difference between the revenue by all the
costs incurred. The income of Strawberry farming was obtained from the calculation as follows:
TL = Y.Py - ∑ X i . Pi
Description TL is Income of strawberry farming, Y is Strawberry production, Py is Price of Strawberries, Xi is The use of i-th factor, Pi is The Price of i-th Factor per unit
To find out the feasibility level of
selected commodity farming was used R/C ratio analysis. The greater R / C ratio value of the farming system is more feasible to cultivate (Soekartawi, 1995).
Determination of Featured Commodi-ties
Determination of featured com-modities was used Policy Analysis Matrix (PAM). This method is used to analyze the comparative advantage of a commodity which reviewed of the resources used to produce the commodities, result of output, the prevailing economic policies and the market distortions occur. The PAM method is summarized in Table 1
The various indicator of the superi-or comodity can be calculated on the table 1 as follows:
a. Private Profits
The privat profit was received benefit by
farmers as producers of commodity. A commodity has an advantage which the
value of private profits is positive.
Privat Profit = Privat Revenue - (Privat Tradable Input + Non-tradable Factor)
b. Social Profits
The Social profit was received benefit by
a whole of the society from a commodity. A commodity has an advantage which the
value of social profits is positive.
Social Profit = Social Revenue - (Social Tradable Input + Social Non-tradable Fac-tor)
= H = E – (F+G)
c. Domestic Resource Cost Ratio
DRCR measures whether that domestic
production or imported are more profitable.
DRCR <1 indicates that a commodity is
more profitable if produced domestically, instead DRCR> 1 shows a less profitable
commodity produced domestically.
DRCR = Social Non-Tradable Factor (So-cial Recipients) – So(So-cial Tradable Input
= G/ (E-F)
d. The Transfer of the Output (OT)
The Output of the Transfer measure the impact of government policies and/or mar-ket distortions in a commodity. OT> 0 indi-cates that a commodity receives a positive impact from a government policy and/or market distortion.
OT = Privat Revenue – Social Revenue
= I = A-E
e. Nominal Protection Coefficient Output (NPCO)
The NPCO measures whether a commodity obtains protection from the government or does not receive it. NPCO> 1 indicates
that a commodity is not protected by the government.
NPCO = Privat Revenue / Social Revenue
f. The Transfer of the Input (IT)
IT was measures whether a farmers pay tradable inputs cheaper or more expensive than actual prices. IT> 0 was showed that farmers pay tradable inputs more expen-sive than they should, otherwise IT< 0 was showed that farmers paying tradable inputs that are cheaper than they should be pay.
IT = Privat Tradable Input – Social Tradable Input
= J = B-F
g. Nominal Coefficient Protection Input
(NCPI)
NPCI measures whether tradable inputs get government protection or does not get it. NPCI> 1 indicates that tradable inputs does not protected by the government.
NPCI = Privat Tradable Input / Social Tradable Input
= B/F
h. Transfer Factor
FT measures whether farmers pay non-tradable factors cheaper or more expen-sive than actual prices. FT> 0 shows that farmers pay non-tradable factors more expensive than they should be pay and instead, FT< 0 indicates farmers pay non-tradable factors that are cheaper than they should be pay.
FT = tradable Privat Factor –
Non-Table 1
Policy Analysis Matrix (PAM)
tradable Social Factor
= K = C-G
i. Net Transfer
NT was measures the profit of private benefits on the social benefits. NT > 0 in
-dicates that farmers earn a bigger profit
than it should, on the contrary when NT < 0
indicates that farmers earn profits that are
smaller than they really are.
NT = Privat Profit – Social Profit
= L = D-H
j. Effective Protection Coefficient (EPC)
The EPC gauge whether producers of a
commodity was protected by the govern-ment or does not protected. EPC> 1 indi-cates that the producer obtains protection, while EPC <1 indicates that producer does not get protection from the government.
EPC = (Privat Revenue – Privat Tradable Input) / (Social Revenue – Social Tradable Input)
= (A-B) / (E-F)
The Analysis of Farming
Analysis of Strawberry Farming
Strawberries is one of the fruits com-modities that cultivated by the most of peo-ple in Serang village a side from vegetable commodities. The Samples of strawberry
Provenance: Primary Data Analysis, 2016 Table 2
The social and Private Analysis of Strawberry Farming per m2 at 2,131.25 in
farmers are strawberry farmers in Serang Village, at Karangreja District, Purbalingga. The result showed that the average farm-ers revenue is Rp39,081,320 of the cost average is Rp. 18.456.217. The privat R/C ratio analysis result showed 2.11 which mean that any expense cost of strawberry farming is Rp 100, will generate revenue to Rp 211. The privat B/C ratio analysis result showed 1.11 which mean strawberry
farm-ing in Serang is profitable. The value of R/C
ratio and B/C ratio as private or social in
Serang are both profitable, which showed
that the result are bigger than 1 (one) (>1) (Table of 5.1). This value mean that
straw-berry farming in Serang are profitable for
farmers and for society as a whole. In this case the community does not harmed by the existence of strawberry farming. Based on it, the cultivation of strawberry farming should be continue for increasing farmer’s income and public prosperity at serang vil-lage in general.
The average land for strawberry farming in Serang is 2,131,25 m2, which the land area is forming of leasehold and own land. Strawberries were grown in monoculture, but some farmers plant it in intercropping with other vegetables such as leeks or cabbage. Especially on high rainfall and strawberry prices are in low position. In terms of farming cost, as much as 48.93% of allocated expenses as the cost of labor and 46.65% allocated for the means of production from the total cost incurred on strawberries farming. The production of strawberries at Serang was 37,165 kg per farming per season with an average production is 929.13 Kg. Straw-berries are sold in fresh friut to the collect-ing traders and distribute it to the market. Strawberries are sold at an average price of Rp. 41,387 per Kg.
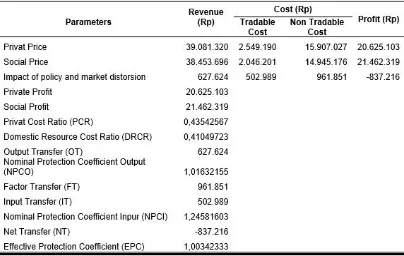
Determinants of Excellent Commodities The results of the Policy Analysis Matrix (PAM) of strawberry farming are
il-Provenance: Primary Data Analysis, 2016 Table 3
lustrated in Table 5.2. Social profit of straw
-berry farming is smaller than privat profit.
This indicates that ther is no transfer from farmers to the community.
PCR of 0.43, was showed that the
nontradable input is efficiently and has
value -added for the farmers. DRCR of 0.41 was showed that the domestic
de-mand is more profitable if supplied by do -mestic production rather than import. A positive OT (627,624) shows that farmers was received strawberry prices is higher than they should get. Nominal Protection
Coefficient (NPC) is a ratio that shows the
impact of the policy (and any market failure
is not corrected by an efficien policy), so its causing the difference between the
two prices (Input and output). NPCO was greates than 1 (1.01) showed that Straw-berry farmers doesn’t getting price protec-tion from the Government. The positive FT (961,851) was showed that farmers payed non tradable inputs are more expensive than they should be pay. On the other hand, farmers also pay higher than they should be pay for tradable inputs (502.989). Pro-tection for tradable input is 124%, indicated by NPCI value of 1.24. Overall, it can be concluded that strawberry farming hasn’t recevied the protection, that was clearly showed by negative NT value (-837.261), although strawberry farming still gives the
profit for the farmers, it was shown by the
EPC value of more than 1, it is 1.003.
Conclusion
Strawberry commodity farming has R / C ratio and B / C ratio above 1 in private and social farming analysis. This indicates
that strawberry farming was profitable and
there are no community was be aggrieved by farming activities.
The social profit of strawberry farm
-ing are greater than privat profit. This value
mean that strawberry farming in Serang
are profitable for farmers and for society
as a whole. In this case the community does not harmed by the existence of
straw-berry farming. Based on it, the cultivation of strawberry farming should be continue for increasing farmer’s income and public prosperity. Non tradabel inputs have been
used efficiently and provide added value to
strawberry farmers. Domestic demand of
strawberries are more profitable if met by
domestic production rather than imports. Farmers was received strawberry price is higher than it should be. Strawberry farmers does not getting price protection from the government. Farmers was payed nontradable inputs are more expensive than they should be. On the other hand, farmers also pay higher for tradable inputs than they should. Overall, it can be con-cluded that strawberry farming has not received adequate protection, it was indi-cated by the negative NT value (-837.261).
References
Asian Development Bank. “Competitive and
Comparative Advantage in Tea”. Draft Final Report RETA 5382. The Pragma Corporation. Falls Church. 1992.
Cockburn, J., E. Siggel, M. Coulibaly, S. Vezina. “Measuring Competitiveness and Its Sources.” The Case of Mali’s Manufactuuring Sector. African
Eco-nomic Policy Paper. Discussion Paper Number 16, October 1998. United Stated Agency for International De-velopment. Washington, D.C. October 1998.
Darsono. “Cashew Economy”. Cakra Library. Surakarta. 2004.
Gittinger J. Price. “Economic Analysis of Agricultural Projects”. UI Press. Ja-karta. 1986.
Haryono, D. “Comparative Advantages and Policy Impacts on Soybean, Strawberry, and Ubikayu Production in Lampung Province”. Tesis.Graduate Program. IPB. Bogor. 1991.
“Introduc-tion to Project Evalua“Introduc-tion (Volume 1)”. The institution of economics faculty of indonesia university publisher. Jakarta. 1978
Monke EA, Pearson SK. “The policy analysis
for agricultural development”. Itacha (US): Cornell University Press. 1989
Pearson, S.R. “Net Social Profitability, Do
-mestic Resource Cost And Effective
Rate of Protection”. Mimeographed. Food research Institute, Standford University. 1976.
Pearson S, Gotsch C, Bahri S. “Application of Policy Analysis Matrix on Indonesian Agriculture”. Obor Indonesia Founda-tion. Jakarta. 2005.
Salvatore, D,. “Managerial Economic:
Managerial Economics in the Global Economy”. Fifth edition. Tranlation of Ichsan Setya Budi. Salemba Empat Publisher. Jakarta.1997.
Yuhono. “Analysis of Income and Com-petitiveness of Root Farming in Garut Regency”., Bull. Littro. Vol. XIX. No.2. 2008.
Zulham, A., S.K. Dermoredjo, Nyak Ilham, C. Muslim, G.S. Budi, M. Siregar and A Suparman,. “Study of Comparative Advantages of Agricultural
Commodi-ties as an Effort to Mobilize Regional