A Study on the Relationship between Arrival Time
Interval and Waiting Ratio of Ships at Ports
Sang-Kook Park1, Kyeong-Seok Han2 1
First Author, Researcher (Ph.D), Hanwha S&C, Korea, [email protected] 2
Corresponding Author, Professor, Graduate School of Soongsil University, Korea, [email protected]
Abstract. This study analyzed the relationship between arrival time interval and waiting ratio of ships at ports using the computer simulation. The simulations were based on the actual arrival records of 1,437 ships at three ports in Korea for three years. The results of the analysis showed that the relationship between waiting ratio and arrival time interval changes by following the pattern similar to logo of Nike. In other words, instead of uniform arrival time, arrival times with 15~20% standard deviation showed lowest waiting ratio. Therefore, the actual waiting ratio in three years was about 4.5~5.0% but results of 15~20% of standard deviation applied on the equidistant interval time showed about 1.5% of ratio which is much lower.
Keywords: Port Simulation, Ship's Waiting Ratio, Standard Deviation, Service Level, Nike theory
1 Introduction
The ship waiting ratio in port is treated as important service level inicator. Therefore, the ship waiting ratio is very important element between shipping company and stakeholders in the perspective of competitiveness except some situations when the shipping company has to use certain port.
2 Literature review
United Nations Conference on Trade and Development (UNCTAD) (1973) classified loading & unloading capabilities of ports into intrinsic capability and optimal capability. The intrinsic capability is the capability calculated under the assumption that the port system operates without stopping which means that the capability per hour is operated 24 hours and 365 days [1].
Goss and Mann (1994) calculated the port waiting cost using the long-run opportunity cost concept, the time cost of ships and cargos were estimated based on the 1970, and the results of the study developed further into core theory and methodology for the calculation of the time cost of ships and cargos [2]. Jansson and Shneerson (1982) calculated the port related costs as congestion costs and queuing costs without classification [3]. Yeong Tae Jang and Sook Kyong Seong (2002) calculated the time cost of ships and cargo per day based on the 50,000 Dead Weight Tonnage (DWT) according to the research method of Gross and Mann [4].
B. Dragovic, N. K. Park, Z. Radmilovic and V. Maras (2005) applied simulation techniques to the logistic ability related with ship arrival, berthing, service, and ship departure in the container port [5]. Michael Maloni and Jomon Aliyas Paul (2013) conducted simulation of calculating advantages and cost of various options of port networks in the West Coast of US in order to utilize the treatment capacity of the present ports. The results proved that simulation is effective method of reducing the future port congestion degree [6].
E. Page (1972) suggested the average waiting time ratio depending on the number of berth under E2/E2/n in the form of figure [7].
3 Model Design
3.1 Assumptions for model
The ports with piers satisfying the following conditions were selected in order to analyze the relationship between ship arrival time interval and ship’s waiting ratio. First, one pier must berth one ship at a time. For example this study excluded the situation where the length of pier is long enough to berth small ship while one ship is already berthed. Second, the unloading piers dealing same items were selected as subjects. Third, the selection of piers was restricted into the piers with more than 300 ships berthed and at least 1 million ton of throughput handling record in past three years. Lastly, only those piers which are able to deal 10,000 DWT to 30,000 DWT were selected. The reason of these restrictions is to obtain statistical significance in a level in which the results of this experiment can generally be applicable to other piers.
3.2 Input and output variables of the model
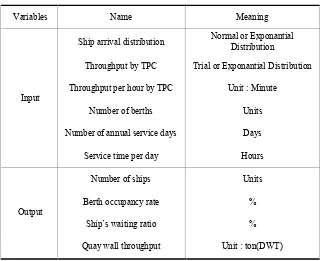
obtained after conducting the simulation by applying input variable values. The input variables and output variables applied to the simulations are shown in Table 1 [9].
Table 1. Input Variables and Output Variables of the Simulation Model
Variables Name Meaning
Input
Ship arrival distribution Normal or Exponantial Distribution
Throughput by TPC Trial or Exponantial Distribution
Throughput per hour by TPC Unit : Minute
Number of berths Units
Number of annual service days Days
Service time per day Hours
Output
Number of ships Units
Berth occupancy rate %
Ship’s waiting ratio %
Quay wall throughput Unit : ton(DWT)
3.3 Experimental subject ports
Three ports were selected as subject port for this experiment. They are Yeompo pier and Mipo pier in Ulsan port and Hyundai HYSCO pier in Gwangyang port. The berthing record data from 2009 to 2011 were used as basis for the simulation [9].
Based on the berthing record data for three years, the input data values which were applied to the simulation were statistically analyzed and summarized.
4 Research Results and Analysis
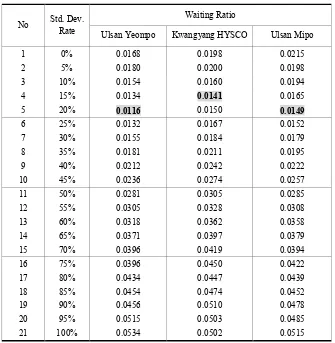
As a process of simulation, the standard deviation of arrival time was increased by 5% until it reaches 100%, creating total 21 intervals, based on the same interval. Also, the simulation was conducted 10 times for each interval to generate average values.
deviation. On the other hands, Mipo pier in Ulsan showed lowest waiting ratio of
Ulsan Yeompo Kwangyang HYSCO Ulsan Mipo
1 0% 0.0168 0.0198 0.0215
The ship waiting ratio is important service level indicator in the management of ports [10]. The ship waiting ratio must be maintained under certain level in the perspectives of competition. Then, TOC must decide their investment on manpower, construction of new piers, and facilities in order to lower the ship waiting ratio until certain level.
The purpose of this study was to analyze the correlation between ship waiting ratio and standard deviations of arrival time with same interval.
innovative solution if this is achievable in the real world. Also, the trend of change in ship waiting ratio depending on the changes in standard deviation was shown to follow the shape of logo pattern of NIKE which the author named as “NIKE theory”.
References
1. UNCTAD, Berth Throughput, United Nations (1973)
2. Goss, R.O and Mann, M.C, The cost of ship’s time, Advanced in maritime Economics, Edited by Goss, R.O, Cambridge University Press (1977)
3. Jansson, Jan Owen and Shneerson, Dan, Port Economics (Transportation Studies), The MIT Press (1982)
4. Chang Young-tae and Sung Souk-kyung, Revisit to Estimate the Time Cost of Ships and Cargoes, Journal of Korean Navigation and Port Research, Vol. 26, No. 4, pp.383-390, (2002)
5. B. Dragovic, N. K. Park, Z. Radmilovic and V. Maras, Simulation Modelling of Ship-Berth Link With Priority Service, Maritime Economics & Logistics, pp.316–335 (2005)
6. Michael Maloni and Jomon Aliyas Paul, Evaluating Capacity Utilization Options for US West Coast Container Ports, Transportation Journal, Vol. 52, No. 1, pp.52-79 (2013) 7. E. Page, Queueing Theory in OR, London : Butterworths, cop., p.155 (1972)
8. Park Sang-Kook and Park Nam-Kyu, A Simulation Model for Appropriate Cargo Handling Capacity of the Port, Proceedings of IAME 2014 Conference, (2014) July 15-18; Norfolk, VA, USA
9. Korea Ministry of Oceans and Fisheries, PORT-MIS (Information System) & www.spidc.go.kr (2013)