CONTENTS
Wahyudi & Allan Leslie White 1 Editorial
Xingfeng Huang, Jinglei Yang, 3 An Experienced Chinese Teacher's Strategies In Teaching Mathematics: Bingxing Tang, Lingmei Gong, Zhong
Tian Translation of Quadratic Functions
Paul White, Sue Wilson, & Michael 11 Teaching for Abstraction: Teacher Learning
Mitchelmore
Catherine Attard 31 Transition from Primary to Secondary School Mathematics: Students'
Perceptio~s
Sue Wilson & Steve Thornton
S. Kanageswari Suppiah Shanmugam & Leong Chee Kin
Allan Leslie White
Ida Kamasih & Wahyudi
45 Bibliotherapy: A Framework for Understanding Pre-Service Primary Teachers' Affective Responses to Learning and Teaching Mathematics
61 Introducing Computer Adaptive Testing to a Cohort of Mathematics Teachers: The Case of Concerto
75 What Does Brain Research Say about Teaching and Learning Mathematics?
Southeast Asian Mathematics Education Journal 2012, Vol. 2 No. 2, 89-125
Exploring Student Perceptions on Teacher-Students Interaction
and Classrooms Learning Environments
in Indonesian Mathematics Classrooms
Ida Karnasih
Universitas Negeri Medan, Indonesia <ikamasih200 1 @yahoo.com>
Wahyudi
SEAMEO QITEP in Mathematics, Yogyakarta, Indonesia <[email protected]>
Abstract
Research studies in education that focus on classrooms and school-level learning environments have escalated and produced promising findings that lead to enhancement of the teaching and learning process. The present study reports on the research findings on associations between students' perceptions of their teacher interaction, classroom learning environment and students' outcomes. A sample of 946 students from 43 classes in Indonesia schools completed a survey including the Questionnaire on Teacher Interaction (QTI), What is Happening in This Class (WIHJC) and a scale relating to their attitude towards mathematics classes. Statistical analysis shows that the reliability and validity of the WIHIC and the QTI were confirmed. Cronbach alpha coefficients ranged from 0.66 to 0.85 and from 0.62 to 0.92 for the actual and preferred versions of the Indonesian version QTI, respectively. For the Indonesian version of WIHIC, Cronbach alpha coefficients of seven scales ranged from 0.80 to 0.91 for actual version, and from 0.78 to 0.92 preferred versions. The relationships of classroom environment and interpersonal teacher behaviour with students' attitudinal outcome were identified. Finally, suggestions on the use of the two instruments for teacher professional development were offered.
Keywords: Learning environment, Stu9ents-teacher interaction, Professional Development, Student Attitude
Most teachers have little control over school policy or curriculum or choice
of texts or special placement of students, but most have a great deal of
autonomy inside the classroom. ~Tracy Kidder
Introduction
cultures. Researchers confirmed that teacher-student interaction is a powerful force that can play a major role in influencing cognitive and affective development of students (Getzel & Thelen, 1960; Wubbles, Breklmans, & Hermans, 1987). Furthermore Wubbels and Levy (1993) reaffirmed the role and significance of teacher behaviour in classroom environment and in particular how this can influence students' motivation leading to achievement.
Some reviews show that science and mathematics education researchers have led the world in the field of classroom environment since early 1980s, and that this field has contributed much to understanding and improving science and mathematics education (Fraser 1998; Fraser & Walberg, 1991). For example, classroom environment assessments provide a means of monitoring, evaluating and improving science and mathematics teaching and curriculum. It is highlighted that a key to improving student achievement and attitudes is to create learning environments that emphasise those characteristics that have been found to be linked empirically with student outcomes (Waldrip & Fisher, 2002).
International studies in the last four decades have firmly established classroom environment research as a thriving field of study (Fraser, 1998). Past recent classroom environment research has focused on cross-national studies of science classroom environments (Fisher, Rickards, Gob, & Wong, 1997), constructivist classroom environments (Taylor, Fraser, & Fisher, 1997), science laboratory classroom environments (McRobbie & Fraser, 1993) and computer-assisted instru.ction classrooms (Fisher & Stolarchuk, 1997; Teh & Fraser, 1995). Most of researchers reveal promising results of the important role of classroom learning environment on students learning in science classroom. While the area of classroom learning environment research has been internationally established, however, we notice that only very few studies have been done in SEAMEO member countries. Therefore, it is timely to initiate such a study on this area of research in the region.
Review of literatures
Research studies in education that focus on classrooms and school-level learning environments have escalated and produced promising findings that lead to enhancement of the teaching and learning process. A great deal of progress has involved conceptualisation, assessment and use of learning environments (Fraser, 1989). This research area has captured all school levels from primary to university, urban and rural, cross-national studies beyond non-Western countries, actual and preferred forms, and comparisons between teachers' and students' perceptions of their classroom learning environments, and has employed a number
of salient and robust instruments 1 Furthermore, this research area has Western countries, for example, M New Guinea. Thus, there has been variable in predicting the success <
learning environment is as importa Reviews of learning environrr comprehensively, for example, in I the development of learning envir learning environment research. Th and use of two instruments emplo (WlliiC) questionnaire and the Q1
Overview of and Development a
(QTI)
By adapting Watzlawick, processes, Wubbels, Creton, and from a systems perspective in 1 communication, it is assumed thi classroom, the behaviour of the j
turn influences student behavioru consist of behaviour, but also de1 Previously, Wubbels, 0 interpersonal teacher behaviour been used in The Netherlands
Teacher Interaction (QTI), to
teacher behaviour (Wubbels, B This model maps interpersoJ
Teh of of
Ida Karnasih & Wahyudi
f salient and robust instruments that have been validated and revalidated (Fraser, 1998). urthennore, this research area has also attracted researchers to conduct their research in non-Western countries, for example, Malaysia, Brunei, Korea, Taiwan, Nigeria, Japan and Papua
ew Guinea. Thus, there has been an acceptance of the learning environment as a significant ariable in predicting the success of educational practice. It seems that the evaluation of the earning environment is as important as evaluating other student performances and outcomes. Reviews of learning environment studies have been provided conveniently and comprehensively, for example, in Fraser's (Fraser, 1994, 1998) studies. Those reviews dissect u1e development of learning environment research from the beginning to the recent trend of earning environment research. The following paragraphs provide review on the development and use of two instruments employed in this study, namely, What is Happening in this Class IW!HIC) questionnaire and the Questionnaire on Teacher Interaction (QTI).
Overview of and Development and Validation of Questionnaire on Teacher Interaction (QTI)
By adapting Watzlawick, Beavin, and Jackson's (1967) theory on communication processes, Wubbels, Creton, and Holvast (1988) investigated teacher behaviour in classrooms from a systems perspective in The Netherlands. According to the systems perspective on communication, it is assumed that part.icipants' behaviours influence each other mutually. In classroom, the behaviour of the teacher is influenced by the behaviour of the students and in tum influences student behaviour. Circular communication processes build up which not only consist of behaviour, but also determine behavior as well.
Previously, Wubbels, Creton, and Hooymayers (1985) developed a model to map interpersonal teacher behaviour extrapolated from the work of Leary ( 1957). This model has been used in The Netherlands in the development of an instrument, the Questionnaire on Teacher Interaction (QTI), to gather students' and teachers' perceptions of interpersonal teacher _pehaviour (Wubbels, Brekelmans, & Hooymayers, 1991; Wubbels & Levy, 1993). This model maps interpersonal behaviour with the aid of an influence dimension (Dominance, D - Submission, S) and a proximity dimension (Cooperation, C - Opposition, 0). In their application of the model to the classroom situation, Wubbels, Creton, and Hooymayers (1985) further divided each quadrant of the original model into two sectors-giving eight sectors in all, each describing different aspects of interpersonal behaviour.
DC and CD are both characterised by Dominance and Cooperation, but in DC Dominance predominates over Cooperation, whereas in CD Cooperation is more evident. The closer two sectors are to each other, the more similar are the teacher behaviours they represent. The Dutch researchers labelled these sectors Leadership, Helping/Friendly, Understanding, Student Responsibility/Freedom, Uncertain, Dissatisfied, Admonishing and Strict behaviour. Figure I describes the typical teacher interpersonal behaviours associated with each sector.
The original version of the QTI in Dutch language consisted of 77 items and it was designed to measure secondary students' and teachers' perceptions of teacher-student interactions. After extensive analysis, the 77-item Dutch version was reduced to a 64-item version. This version was translated and administered in the USA (Wubbles & Levy, 1991;
Wubbles & Levy, 1993). Later an Australian version of the QTI containing 48 items was developed (Fisher, Henderson, & Fraser, 1995). Scale description and a sample item for each of the eight scales of the QTI are shown in Table 1. The questionnaire is available in Appendix A.
Table 1. Description of Scales in the QTI and Representative Items
Scale Name Leadership
Scale Description Extent to which the teacher provides leadership to class and hold students attention.
Helping/Friendly Extent to which the teacher is friendly
Understanding
Students Responsibility/ Freedom Uncertain
Dissatisfaction
Admonishing
Strict
and helpful towards students. Extent to which the teacher shows understanding/concern/care to students. Extent to which students are given opportunities to assume responsibilities for their own activities.
Extent to which the teacher exhibits his/her uncertainty.
Extent to which the teacher shows unhappiness/dissatisfaction with students.
Extent to which the teacher shows anger/temper/impatient in class. Extent to which the teacher strict with and demanding of students.
Example of the item This teacher explains things
This teacher helps us with our work.
If we don't agree with this teacher, we can talk about it. We can influence this teacher.
It is easy to make a fool out of this teacher.
This teacher thinks that we do not know anything.
The teacher is impatient.
We are afraid of this teacher.
.~
..
Figure 1. The Wubbels m
Previous study using thl The QTI has bee Netherlands (Wubbels & with 1 ,606 students and
the QTI were confirmec reported acceptable inte 0.84 for student respons' An initial use of between perceptions on & Hooymayers, 199r
[image:6.618.29.414.81.680.2]Ida Karnasih & Wahyudi
DoMINANICt
0
1~--~---~~---~--~---;1
s
SUIIM1$$10N
Figure 1. The Wubbels model for teacher interpersonal behaviour (Fisher & Richard, 1998)
Previous study using the QTI
The QTI has been shown to be a valid and reliable instrument when used in The Netherlands (Wubbels & Levy, 1993). When the 64-item USA version of the QTI was used with 1,606 students and 66 teachers in the USA, the cross-cultural validity and usefulness of the QTI were confirmed. Using the Cronbach alpha coefficient, Wubbels and Levy (1993) reported acceptable internal consistency reliabilities for the QTI scales ranging from 0.76 to 0.84 for student responses and from 0.74 to 0.84 for teacher responses.
[image:7.618.26.403.58.497.2]outcomes scores. Conversely, student responsibility and freedom, uncertain and dissatisfied behaviours were related negatively to achievement. Wubbels and Brekelmans (1998) stated that student outcomes are related to student perceptions of teacher behaviours with affective outcomes displaying a greater association than cognitive outcomes. In fact, studies into student teacher interactions suggest that teachers 'using open teaching styles are able to control student input and procedures in class in order to avoid disorder (Wubbels &
Brekelmans 1998). Wubbels and Levy (1993) claimed that student perceptions of interpersonal teacher behaviour appear to account for 70 percent of the variability in student achievement and 55 percent for attitude outcomes.
Levy, Creton, and Wubbels (1993) analysed data from studies in The Netherlands the ' USA and Australia involving students being asked to use the QTI to rate their best and worst teachers. Students rated their best teachers as being strong leaders and as friendly and understanding. The characteristics of the worst teachers were that they were more admonishing and dissatisfied.
The Australian version of the QTI containing 48 items was used in a pilot study involving upper secondary science classes in Western Australia and Tasmania (Fisher Fraser
'
'& Wubbels, 1993; Fisher, Fraser, Wubbels, & Brekelmans, 1993; Fisher, Fraser, & Henderson, 1995). This pilot study strongly supported the validity and pote~tial usefulness of the QTI within the Australian context, and.suggested the desirability of conducting further and more comprehensive research involving the QTI.
Wubbels (1993) used the QTI with a sample of 792 students and 46 teachers in Western Australia and Tasmania. The results of this study were similar to previous Dutch and American research in that, generally, teachers did not reach their ideal and differed from the best teachers as perceived by students. It is noteworthy that the best teachers, according to students, are stronger leaders, more- friendly and understanding, and less uncertain, dissatisfied and admonishing than teachers on average. When teachers described their perceptions of their own behaviours, they tended to see it a little more favourably than did their students. On average, the teachers' perceptions were between the students' perceptions of actual behaviour and the teachers' ideal behaviour. An interpretation of this is that teachers think that they behave closer to their ideal than their students think that they do.
Fisher, Rickards, and Fraser (1996) found that after having completed the QTI and having had time to consider the results supplied to them, science teachers reported that they had been stimulated to reflect on their own teaching and verbal communication in the classroom. For example, one teacher concluded that she had become more aware of her
students' need for clear communi her classroom teaching (Fisher, B
Fisher and Rickards (19S the QTI and found associations 1
and students, attitudinal and co the QTI were significantly corn using simple and multiple con Friendly, and Understanding Wf
class and the achievement score and Strict were negatively corn cultural differences it was rep teachers significantly more pm the analysis.
Fisher et al. ( 1997) Cal and 705 students in Australia Responsibility/ Freedom was I
science classes in both countri1 The QTI has been us< other Asian countries and has & Rickards, 1998; Fisher et a All the studies confinn that c useful infonnation for the tel
specifically about their teach< Khine and Fisher (21 classes in Brunei. This stud) tool is a valid and reliable students enjoyed the scienc< understanding and are he admonishing and dissatisfiE science lessons.
Waldrip and Fisher exemplary teachers. They 1
ain and dissatisfied mans (1998) stated ours with affective fact, studies into styles are able to der (Wubbels &
perceptions of "ability in student
Netherlands, the r best and worst s friendly and ey were more
a pilot study Fisher, Fraser,
r, Frase,, & usefulness of cting further
teachers in s Dutch and ed from the ccording to
uncertain, ·bed their Y than did erceptions
t teachers
QTI and that thev n in the e of her
Ida Karnasih & Wahyudi
students' need for clear communication and that this had become a focus for her in improving her classroom teaching (Fisher, Rickards, & Fraser, 1996).
Fisher and Rickards (1998) analysed a large database of 2,960 student responses to the QTI and found associations between students' perceptions of teacher-student interactions and students' attitudinal and cognitive achievement outcomes. Seven out of eight scales of the QTI were significantly correlated to attitudes to the class and achievement scores when using simple and multiple correlation. It was found that the scales Leadership, Helping/ Friendly, and Understanding were positively and significantly correlated with the attitude to class and the achievement scores. The other QTI scales Uncertain, Dissatisfied, Admonishing and Strict were negatively correlated to the attitude to class and the achievement scores. For cultural differences it was reported that students from Asian background perceived their teachers significantly more positively than did those from the other cultural groups used in the analysis.
Fisher et a!. (1997) carried out a similar study involving 720 students in Singapore and 705 students in Australia. In this study the results were the same except that Student Responsibility/ Freedom was also positively associated with students' attitudes towards their science classes in both countries.
The QTI has been used in The Netherlands, USA, Australia, Singapore and a few other Asian countries· and has been .cross-validated in different contexts and cultures (Fisher & Rickards, 1998; Fisher eta!., 1997; Kim, Fisher, & Fraser, 2000; Wubbles & Levy, 1993) All the studies confirm that data obtained from the questionnaire provide valid, reliable and useful information for the teacher regarding their learning environment in general and more specifically about their teacher-student interactions.
Khine and Fisher (2001) administered the QTI to 1,188 students from 54 science classes in Brunei. This study provided further validation data on QTI and indicated that this tool is a valid and reliable instrument to be used in this context. This study showed that students enjoyed the science lessons more when their teachers displayed greater leadership, understanding and are helping and friendly. On the other hand, teachers' uncertain, admonishing and dissatisfied behaviours were negatively associated with the enjoyment of science lessons.
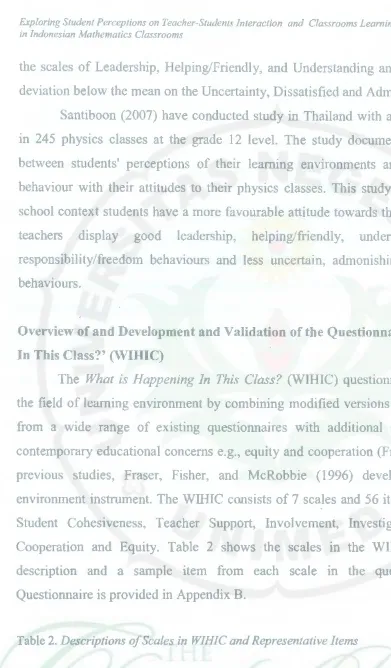
the scales of Leadership, Helping/Friendly, and Understanding and more than one standard deviation below the mean on the Uncertainty, Dissatisfied and Admonishing scales.
Santiboon (2007) have conducted study in Thailand with a sample of 4,576 students in 245 physics classes at the grade 12 level. The study documented that the associations between students' perceptions of their learning environments and teachers' interpersonal behaviour with their attitudes to their physics classes. This study asserted that in Thailand school context students have a more favourable attitude towards their physics classes if their teachers display good leadership, helping/friendly, understanding, and students responsibility/freedom behaviours and less uncertain, admonishing, dissatisfied and strict behaviours.
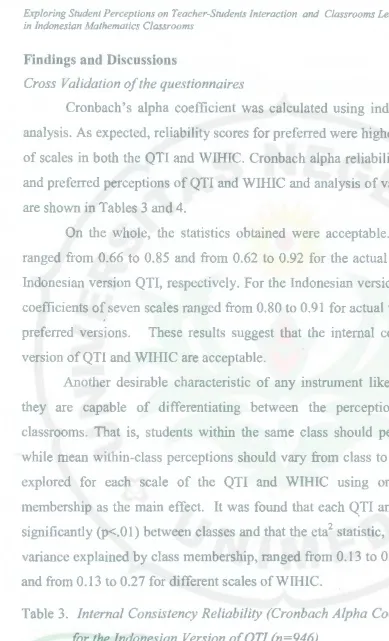
Overview of and Development and Validation of the Questionnaire 'What Is Happening In This Class?' (WIHIC)
The What is Happening In This Class? (WIHIC) questionnaire brings parsimony to
[image:10.618.21.412.15.683.2]the field of learning environment by combining modified versions of the most salient scales from a wide range of existing questionnaires with additional scales that accommodate contemporary educational concerns e.g., equity and cooperation (Fraser, 1998). Based on the previous studies, Fraser, Fisher, and McRobbie (1996) developed this new learning environment instrument. The WIHIC consists of 7 scales and 56 items. The seven scales are Student Cohesiveness, Teacher Support, Involvement, Investigation, Task Orientation, Cooperation and Equity. Table 2 shows the scales in the WIHIC, along with a brief description and a sample item from each scale in the questionnaire. The WlliiC Questionnaire is provided in Appendix B.
Table 2. Descriptions of Scales in WIHIC and Representative Items
Scale Name Student
Cohesiveness
Teacher Support
Scale Description Example of the item
Extent to which students know, help, I help other class members and are supportive of one another who are having trouble
with their work. Extent to which the teacher helps,
befriend, trust, and shows interest in students
The teacher considers my feelings
Scale Name Involvement
Investigation
Task Orientation
Cooperation
Equity
Extent tl attentivf discussi and enj1
Empha~
ofinqu solving Extent
compl< stay or Extent rather on lea Ex ten equal
earning Em·ironments
g and more than one standard dmonishing scales.
th a sample of 4,576 students mented that the associations and teachers' interpersonal dy asserted that in Thailand
their physics classes if their erstanding, and students hing, dissatisfied and strict
aire 'What Is Happening
nnaire brings parsimony to of the most salient scales scales that accommodate raser, 1998). Based on the loped this new learning ems. The seven scales are ation, Task Orientation
' IC, along with a brief tionnaire. The WllHC
ample of the item other class members re having trouble
eir work.
acher considers my s
Scale Name Involvement
Investigation
Task Orientation
Cooperation
Equity
Ida Karnasih & Wahyudi
Scale Description Example of the item
Extent to which students have I give my opinion during attentive interest, participate in the class discussions discussion, perform additional work,
and enjoy the class
Emphasis on the skill and processes I explain the meaning of of inquiry and their use in problem statements, diagrams, and
solving and investigation graphs.
Extent to which it is important to I am ready to start this class complete activities planned and to
stay on the subject matter
on time
Extent to which students cooperate I cooperate with other rather than compete with one another students when doing
on learning tasks assignment work
Extent to which students are treated I receive the same
equally by the teacher encouragement from the
teacher as other students do
Previous-study using tbe WIHIC
The WIHIC questionnaire has been used to measure the psychosocial aspects of the classroom learning environment in various contexts since its development. In certain cases, the questionnaire has been adapted without any modifications, while as in other cases modifications were made to suit the specific context. Currently, the original questionnaire in English has been translated into Chinese for use in Taiwan (Aldridge & Fraser, 1997) and Singapore (Chionh & Fraser, 1998), Korean for use in Korea (Kim et al., 2000) and Bahasa Indonesia for use in Indonesia (Wahyudi, 2004).
In a study on associations between learning environments in mathematics classrooms and students' attitudes, Rawnsley (1997) found that students developed more positive attitudes towards their mathematics in classes where the teacher was perceived to be highly supportive, equitable, and where the teacher involved students in investigations.
between the set of environment scales and students' attitudes towards chemistry theory classes. The Student Cohesiveness, Teacher Support, Involvement, and Task Orientation scales were positively associated with the students' attitudes.
Khoo and Fraser ( 1998) used a modified version of the WIHIC to measure classroom environment when evaluating adult computer courses. The Cooperation scale was dropped in this modified version and Student Cohesiveness and Teacher Support were collapsed into one scale named Trainer Support. A set of 38 items was retained after factor analyses. This study indicated that the males perceived greater Involvement, while females perceived more Equity. The other striking result of the study was that older females had a more positive perception of Trainer Support than the younger ones.
Fraser and Aldridge ( 1998) used English and Chinese versiOns of the WIHIC in Australia and Taiwan, respectively, to explore the potential of cross-cultural studies. Results of the study indicated that students in Australia consistently perceived their classroom environment more positively than students in Taiwan. Significant differences were detected on the WIHIC scales of Involvement, Investigation, Task Orientation, Cooperation and Equity. This indicated that students in Australia perceived they are given more opportunity to get involved in the experiments and investigate scientific phenomena. In this study, cultural differences were highlighted. Education in Taiwan is examination ba.sed and teaching styles are adopted to suit the particular situation. In Taiwan:> having good content knowledge of the subject was the yardstick for being a good teacher, while as in Australia having good interpersonal relationships between students and teachers is considered the most important factor in education process. Taiwan classrooms are teacher centred giving very little opportunity to students to discuss issues.
Khine and Fisher (200 1) used the WIHIC in Brunei to study the classroom environment and teachers' cultural background in an Asian context. The study found that teachers from different cultural backgrounds created different types of learning environments.
It also indicated that the WIHIC is a useful instrument with which to measure the cultural background differences and can be used as a basis for identification and development of desirable teacher behaviours that will lead to a favourable learning environment.
Wahyudi (2004) study in Indonesian lower secondary school using the Indonesian version of WIHIC also documented the association between students' perception on their classroom learning environment and their attitudinal and cognitive outcome. Students' enjoyment during science lessons and their attitude toward inquiry in science was greater in
classrooms that have less co< in school science was negativ
The goals of this stt for the QTI and
wnnc
I investigate differences in sl. nc interpersonal behavlOr a
associations between stu environment with their atti In more detail, the
1. Are the questic 2. What are stuc their classrom 3. Are there any learning envr In so doing, the Teacher Interaction (Ql were developed (See 1
translataions of the que questionnaires into Enj instruments used in the The sample wal Indonesia. The total s
classroom
Ida Karnasih & Wahyudi
classrooms that have less cooperation and less student cohesiveness. Students' achievement in school science was negatively influenced by investigation activities during science lessons.
Methodology
The goals of this study were to provide further cross cultural validation information for the QTI and WIHIC questionnaires when used with a large Indonesian sample; to investigate differences in students' actual and ideal or preferred perceptions of their teacher interpersonal behavior and their classroom learning environment; and to investigate the associations between students' perceptions of teacher interaction and their learning environment with their attitudes toward mathematics .
In more detail, the aims are formulated in the following three research questions: 1. Are the questionnaires used in this study valid and reliable?
2. What are students' perception towards their teacher interpersonal behavior and their classroom learning environment?
3. Are there any associations between teacher interpersonal behavior and classroom learning environment with students' attitude toward mathematics classes?
In so doing, the instruments namely, the Indonesi11n version of Questionnaire on Teacher Interaction (QTI) and the What is Happening in this Class (WIHIC) questionnaire were developed (See Appendix C and D, respectively) . As sugested by Brislin (1970), translataions of the questionnaires into Bahasa Indonesia and then back transalation of both questionnaires into English were carried out. This procedure was done to ensure that the instruments used in the study still carry the original meaning.
Findings and Discussions
Cross Validation of the questionnaires
Cronbach's alpha coefficient was calculated using individual scores as the units of analysis. As expected, reliability scores for preferred were higher than actual version for most of scales in both the QTI and Willi C. Cronbach alpha reliability coefficients for both actual and preferred perceptions of QTI and WIHIC and analysis of variance (ANOV A) eta2 results are shown in Tables 3 and 4.
On the whole, the statistics obtained were acceptable. Cronbach alpha coefficients ranged from 0.66 to 0.85 and from 0.62 to 0.92 for the actual and preferred versions of the Indonesian version QTI, respectively. For the Indonesian version of WIHIC, Cronbach alpha coefficients of seven scales ranged from 0.80 to 0.91 for actual version, and from 0. 78 to 0.92 preferred versions. These results suggest that the internal consistency for the Indonesian version ofQTI and WIHIC are acceptable.
[image:14.618.26.415.30.671.2]Another desirable characteristic of any instrument like the QTI and WIHIC is that they are capable of differentiating between the perceptions Of students in different classrooms. That is, students within the same class should perceive it relatively similarly, while mean within-class perceptions should vary from class to class. This characteristic was explored for each scale of the QTI and WIHJC using one-way ANOV A, with class membership as the main effect. It was found that each QTI and WIHIC scale differentiated significantly (p<.O 1) between classes and that the eta2 statistic, representing the proportion of variance explained by class membership, ranged from 0.13 to 0.38 for different scales of QTI and from 0.13 to 0.27 for different scales ofWIHIC.
Table 3. Internal Consistency Reliability (Cronbach Alpha Coefficient) and ANOVA Results for the Indonesian Version ofQTI (n=946)
Scale Name Cronbach Al ~h a Reliability ANOVA results (eta
2 )
Actual Preferred (Actual)
Leadership 0.72 0.79 0.35*
Helping/Friendly 0.76 0.62 0.38*
Understanding 0.76 0.82 0.32*
Students Responsibility 0.69 0.75 0.28*
Uncertain 0.78 0.87 0.13*
Dissatisfaction 0.84 0.92 0.22*
Admonishing 0.85 0.87 0.37*
Strict 0.66 0.69 0.28*
*p<O.Ol
C · tency Relia Table 4. Internal onsts .
for the Indonesian Vers wn '
- -- - - --co
Scale Name
Student Cohesiveness Teacher Support
Involvement Investigation
Task Orientation Cooperation Equity
*p<O.Ol
between male and Differences
· environment classroom learnmg
Gender differences in te: . nt were exa learning env1ronme
IH
scales and seven scales ofW 1 nd female deviations for rna e a
significant gender differences , of the QTI, with females perc . . their teach males percewmg
the units of
for most
both actual 2 eta results
Ida Karnasih & Wahyudi
Table 4. Internal Consistency Reliability (Cronbach Alpha Coefficient) and ANOVA Results for the Indonesian Version of WIHIC (n=946)
Scale Name
Cronbach Alpha Reliability
ANOVA results (eta2)
Actual Preferred
Student Cohesiveness 0.80 0.78 0.24*
Teacher Support 0.84 0.79 0.27*
Involvement 0.84 0.87 0.17*
Investigation 0.89 0.90 0.13*
Task Orientation 0.85 0.91 0.21 *
Cooperation 0.83 0.82 0.14*
Equity 0.91 0.92 0.22*
*p<0.01
Differences between male and female students' perception of the actual mathematics
classroom learning environment and interpersonal behaviour of their teacher
[image:15.618.15.410.133.667.2]Table 5. Average Item Mean, Average Standard Deviation (SD), and t Value from !-tests with Independent-Samples T-tests for Differences between Male (n=387) and Female
(n=559) Perceptions ofQTI
Scale Average Item Mean Average SD t value
Male Female Male Female
Leadership 3.82 3.88 0.57 0.54 -1.74
Helping/Friendly 3.39 3.48 0.73 0.66 -1.86
Understanding 3.81 3.98 0.67 0.56 -4.05**
Students Responsibility 2.59 2.48 0.69 0.63 2.54*
Uncertain 1.66 1.54 0.68 0.55 3.08*
Dissatisfaction 1.63 1.49 0.68 0.58 3.35**
Admonishing 1.81 1.71 0.77 0.69 2.05*
Strict 2.82 2.75 0.59 0.67 1.85
**p<O.Ol; *p<0.05
Regarding students' perception of their learning environment as assessed using the Indonesian version of WIHIC, the results of this study maintain the assertions yielded from the previous studies (Goh & Fraser, 1995; Goh, Young, & Fraser, 1995; Riah, 1998; Riah & Fraser, 1998; Wong, 1994), in which £\!males hold better perceptions of the classroom-learning environment than do males. Table 6 suggests that generally females have perceptions slightly more favourable than the males on the actual mathematics classroom-learning environment. While the magnitudes of the differences between male and female students' views of the classroom learning environment are relatively small, statistically significant differences occur on all scales, except on Involvement and Investigation.
Table 6. Average item Mean, A1 Paired Samples for Diffi
ojWIHIC
~----;:;~----:} Scale
Student Cohesiveness Teacher Support
Involvement Investigation
Task Orientation Cooperation
Equity
**p<O.Ol; *p<0.05
. b n Students ' AssociatiOn etwee
Correlations between . t their teacher in\ envtronmen ,
Simple and multiple correlati attitudinal outcomes using in Simple correlations indicate( of the scales of the Indonesi multiple regression analysi Indonesian WIHIC and QT scale of the Indonesian Wit
WIHIC or seven scale of
Q
multiple correlations (R)between the QTI and Wll respectively.
Simple correlation . Students Responsibility ~
Learnina o E. nwronmenrs ·
(SD), and t Valueji
rom !-tests With Male (n==387l d
/an Female
of the classroom-generally femal h
es ave mathematics classroom-between male and female small, statistically Investigation.
Ida Karnasih & Wahyudi
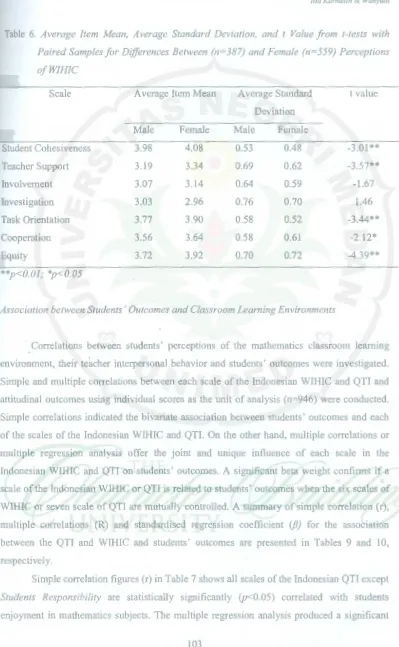
Table 6. Average Item Mean, Average Standard Deviation, and t Value from t-tests with Paired Samples for Differences Between (n=387) and Female (n=559) Perceptions
ofWIHIC
Scale
Student Cohesiveness Teacher Support Involvement Investigation Task Orientation Cooperation Equity
**p<O.Ol; *p<0.05
Average Item Mean
Male Female
3.98 4.08
3.19 3.34
3.07 3.14
3.03 2.96
3.77 3.90
3.56 3.64
3.72 3.92
Average Standard Deviation
Male Female
0.53 0.48
0.69 0.62
0.64 0.59
0.76 0.70
0.58 0.52
0.58 0.61
0.70 0.72
Association between Students' Outcomes and Classroom Learning Environments
t value
-3.01 ** -3 .57** -1.67
1.46 -3.44**
-2.12* -4.39**
Correlations between students' perceptions of the mathematics classroom learning environment, their teacher interpersonal behavior and students' outcomes were investigated. Simple and multiple correlations between each scale of the Indonesian WIHIC and QTI and attitudinal outcomes using individual scores as the unit of analysis (n=946) were conducted. Simple correlations indicated the bivariate association between students' outcomes and each of the scales of the Indonesian WIHIC and QTI. On the other hand, multiple correlations or multiple regression analysis offer the joint and unique influence of each scale in the Indonesian WIHIC and QTI on students' outcomes. A significant beta weight confirms if a scale of the Indonesian WIHIC or QTI is related to students' outcomes when the six scales of WIHIC or seven scale of QTI are mutually controlled. A summary of simple correlation (r), multiple correlations (R) and standardised regression coefficient (/3) for the association between the QTI and WIHIC and students' outcomes are presented in Tables 9 and 10, respectively.
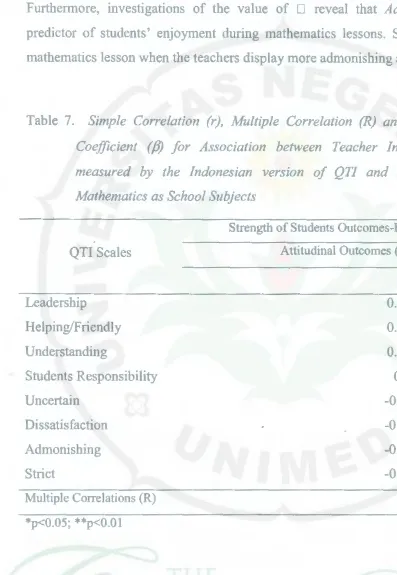
[image:17.618.9.408.33.680.2]multiple correlation (R) of 0.37 (p<O.Ol) for students' enjoyment in mathematics classes. Furthermore, investigations of the value of D reveal that Admonishing scale is strong predictor of students' enjoyment during mathematics lessons. Students become less enjoy mathematics lesson when the teachers display more admonishing attitude in the classroom.
Table 7. Simple Correlation (r), Multiple Correlation (R) and Standardised Regression Coefficient
(j3)
for Association between Teacher Interpersonal Behaviour asmeasured by the Indonesian version of QTI and Student Attitudes towards
Mathematics as School Subjects
QTI Scales
Leadership Helping/Friendly Understanding
Students Responsibility Uncertain
Dissatisfaction Admonishing Strict
Multiple Correlations (R)
*p<0.05; **p<O.Ol
Strength of Students Outcomes-Environment Association Attitudinal Outcomes (Enjoyment)
r
fJ
0.20** 0.06
0.22** O.Q3
0.28** 0.11
0.07 0.03
-0.12** -0.08
-0.19** -0.07
-0.32** -0.28*
-0.14** -0.01
0.37**
Table 8. Stmp . le Correlation (r), M f.l\
fi
Associc Coefficient (p! ord by the Indonesia measure
Subjects
-WlHlC Scales
-
~~---:-:::~--Student Cohesiveness Teacher Support
Involvement Investigation
Task Orientation Cooperation
Equity
-Multiple Correlations (R)
01 . ***p<O.OOl * <O p . '
os·
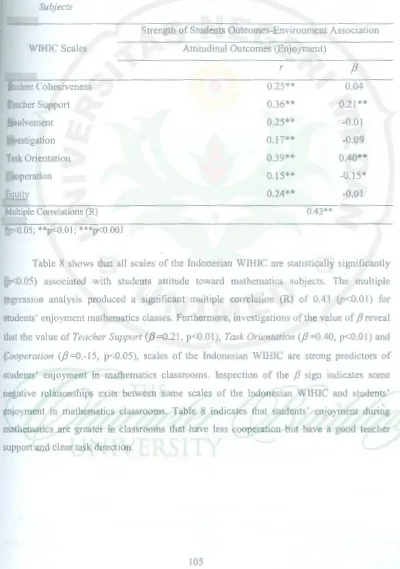
**p<O. ,Table 8 shows that all s · h stuc (p<O.OS) associated Wlt
1 · produced regression ana ysls .
' . ent mathematl students en)oym
f Teacher SupF that the value o
.
(/3
==0 -15, p<O.OCooperatiOn ·
· math students' enjoyment m
. . 1
negative relationshlps exltS . t in mathematics c
en)oyrnen .
[image:18.618.21.418.104.679.2]Learnino £ .
o nVIronmenrs eny"ovrn t ·
J •uen
m
mathem t.a Ics classe that Admonishing
lessons. scale is strong Students become I .
. ess efl)oy
attitude in the classroom.
(R) and Standard· d
Jse Regression Interpersonal B h .
e awour as and Student Attituder
.., towards
t Association
r
/1
0.20**
0.06 0.22**
0.03 0.28**
0.11 0.07
0.03 -0.1 2**
-0.08 -0.19**
-0.07 -0.32**
-0.28* -0.14**
-0.01 0.37**
Ida Karnasih & Wahyudi
Table 8. Simple Correlation (r), Multiple Correlation (R) and Standardised Regression Coefficient
(/3)
for Association between Classroom Learning Environments asmeasured by the Indonesian version of WIHIC and Student Attitudes towards the
Subjects
WIHIC Scales
Student Cohesiveness Teacher Support Involvement Investigation Task Orientation Cooperation Equity
Multiple Correlations (R)
*p<0.05 ; **p<O.Ol; ***p<O.OO l
Strength of Students Outcomes-Environment Association Attitudinal Outcomes (Enjoyment)
r
fJ
0.25** 0.04
0.36** 0.21 **
0.25** -0.01
0.17** -0.09
0.39** 0.40**
0.15** -0.15*
0.24** -0.01
0.43**
Table 8 shows that all scales of the Indonesian WIHIC are statistically significantly
(p<0.05) associated .with students attitude toward mathematics subjects. The multiple
[image:19.618.8.408.109.678.2]Conclusions and Recommendations
This study has explored associations between students' perceptions of their teacher interpersonal behavior, classroom learning environment and their attitude toward mathematics classes.
This study confirmed the reliability and validity of the QTI and WIHIC when used in lower secondary mathematics classes in Indonesian school context. It is found in this study that there are differences on students' perceptions toward their teacher interpersonal behavior and their classroom learning environment based on actual and preferred version as well as based on students' gender. As expected, even though to such extend students are contented with their actual perceptions on both the QTI and WIHIC scales, however, they would like to have more positive experience of teacher interaction and to have more conducive classroom learning environment. This study also found gender differences that consistently showed that females perceive their teachers in a more positive way than do males .. Female students also consistently perceive their mathematics classroom environment more favorable than their male counterparts do.
Regarding the association between students' perception of learning environment and their attitude toward science and mathematics, generally the dimensions or scales of the QTI and WIHIC were found to be significantly associated with student attitudes. In particular, the study showed that there was a positive correlation between student attitude toward mathematics classes and the teachers' leadership, helping/friendly and understanding behaviours. Students had a more positive attitude to their mathematics classes when their teacher exhibited more of these behaviours and less admonishing, dissatisfied, uncertain and strict behaviours. If mathematics teachers want to promote favourable student attitudes to their class, they should ensure the presence of these interpersonal behaviours.
This research is of practical significance in that it has drawn a link between student attitudes and the nature of the teacher-student behaviour in the classroom. The study could be of significance for teacher educators and policy makers in that it provides a way of improving student outcomes by changing the nature of classroom learning environment and the existence of interpersonal relationships between students and teachers in mathematics classrooms.
Future research should be planned to help teachers in using these two instruments fo r improving their teaching performance. A study on better or exemplary teachers as suggested by Waldrip and Fisher (2002) would be advised to be done in Indoensia and SEAMEO
. so that the teach ber countnes
mem £ d frc
h the best practices oun throug
It is also advisable for . ortant of kl consideration the lillP
T rovide studen environment. o p
b included as environments can e
perceptions of th .
eJr teacher and their attitude t d
onar
the QTI and WIHIC h . w en used m context. It is found in this study
teacher interpersonal beh .
avwr
and preferred version as well a extend stud
ents are contented however, they would like to
have mor .
e conducive classroom that consistently showed that do males. Female stud
ents al 0
t more favorable than their
of Iea.JJing environm ent and
or scales of the QTI
attitudes. In particular, the student attitude
toward
endJy an d understanding
classes when
their
dissatisfied uncert .
' am and
student attitudes to behaviours.
a link between student
classroom Th
. e stud could that it p rovi es a way of ·d
learning e ·
nvJronment and teachers in mathematics
these twn ·
m~truments for teachers as suggested Indoensia and SEAME
Ida Karnasih & Wahyudi
member countries so that the teachers from this region may share and learn from each other through the best practices found from the research.
References
Aldridge, J. M., & Fraser, B. J. (1997, August). Examining science classroom environments in a cross-national study. Paper presented at the 12th W AIER Research Forum for the Western Australian Institute for Educational Research, Perth, Australia.
Brislin, R. W. (1970). Back translation for cross-cultural research. Journal of Cross-Cultural Psychology, 1, 185-216.
Chionh, Y. H., & Fraser, B. J. (1998). Validation and use of the 'What is Happening in this Class' (WIHIC) questionnaire in Singapore. Paper presented at the annual meeting of the American educational Research Association, San Diego, CA.
Fisher, D., Fraser, B., & Wubbels, T. (1993). Interpersonal teacher behavior and school environment. In T. Wubbels & J. Levy (Eds.), Do you know what you look like' Interpersonal relationships in education (pp. 1 03-112). London, England: Falmer Press.
Fisher, D., Fraser, B., Wubbels, T., & Brekelmans, M. (1993, April). Associations between school .environment and teacher interpersonal behavior in the classroom. Paper presented at the annual meeting of the American Educational Research Association, Atlanta, GA.
Fisher, D., Rickards, T., & Fraser, B. (1996). Assessing teacher-student interpersonal relationships in science classes. Australian Science Teachers Journal, 42, 28-33. Fisher, D., & Stolarchuk, E. (1997). The effects of using laptop COl'I'Jputers on achievement,
attitude to science and classroom environment in science. Paper presented at the Annual Conference of the Western Australian Science Education Association, Perth. Fisher, D. L., Henderson, D., & Fraser, B. J. (1995). Interpersonal behaviour in senior high
school biology classes. Research in Science Education, 25(2), 125-133.
Fisher, D. L., & Rickards, T. (1998). Associations between teacher-student interpersonal behaviour and student attitude to mathematics. Mathematics Education Research journal, 10(1), 3-15.
Fisher, D. L., Rickards, T., Gob, S. C., & Wong, A. F. L. ( 1997). Perceptions of interpersonal teacher behaviour in secondary science classrooms in Singapore and Australia. Journal of Applied Research in Education, 1(2), 2-11.
Fraser, B.J. (1981). Test of Science-Related Attitudes. Melbourne: Australian Council for Educational Research.
Fraser, B. J. (1989). Assessing and improving classroom environment (What Research Says to the Science and Mathematics Teacher No. 2.). Perth: Key Centre for School Science and Mathematics, Curtin University ofTechno1ogy.
Fraser, B. (1994). Research on classroom and school climate. In D. Gabel (Ed.), Handbook of research on science teaching and learning, (pp. 493-541 ). New York: Macmillan. Fraser, B. J. (1998). science learning environments: assessment, effects and determinants. In
K. G. Tobin (Ed.), The international handbook of science education (pp. 527-564). Dordrecht, The Netherlands: Kluwer Academic Publishers.
Fraser, B. J., & Aldridge, J. M. (1998). The potential of cross-national studies of science classrooms; An example involving Australia and Taiwan. In M.Quigley (Ed.), Science, Mathematics and Technical Education for national Development. (pp. 76-83). Brunei: University of Brunei Darussalam.
Fraser, B. J., Fisher, D. L., & McRobbie, C. J. (1996). Development, validation and use of personal and class forms of a new classroom environment instrument. Paper
presented at the Annual Meeting of the American Education Research Association, Chicago.
W lberg H (Eds.). (1991 Fraser, B., & a ' es. oxford: Peq
and consequenc H. A (1960). J
w
& Thelen, · · d' Getzel, · ., . 1 Society for Stu H59): NatlOna B J (1997). Ch R & Fraser · · · Hunus, ., s'chools. In T. Rl
Second~ry
d ational DevelEducatwn an ~ . 108-120).
Ha_n01,VIetn~·(20(
S & F1sher, D. · l(hine, M. ., 1 b kground in secane
cultura ac. 1 Education2 the InternatlOna . p rth
h . EducatlOn, e . Researc Ill J (1998). Us
H & Fraser, B . ·
l(hoo, ., d I mputer courses. o~' a u t co h . I
'J . • for Researc In .
AssoclatlOn B J
F' her D & Fraser, . . Kim, H., IS . ' .'' secondary clas
behavlOur m
3-22. rso1
57) An interpe Leary, T. (19 .
Company. B
. C J & Fraser, · McRobble, . ·~ 1 science envin
sychosoc1a .
P G. (1997). Assoczt Rawnsley, D.
1 behaviour~
interpersona Un ublished classrooms. ~
Western Austraha . . . T (2007). Assocwtw
Santlboon, · d Teachc
Environments an Th Paper presented at
~
N ov ember 9-11,2007, B & Fishe1 p Fraser, .,
Tay or, ., . nts Jnternatio envlronme . 5) D
& Fraser B. (199 · Teh, G., ~ 1 environm
psychosoc1a .
Educational Comp~tmg
di. (2004). Educatwnal
W
ahyu
d ry science classecon a . .
. Curtin umvers1t
thesiS, (2
W la drip B. and Fisher, D. ' d ]ourm
Queenslan .
http://education.curtm. · k p Beavin, J., & WatzlaWIC , .,
New York: Norton. 1 T (1993). Teacher
Wubbe s, · the
research says to Centre for School Sc' W u bbels T., Brekelmans, ' " ·n Fras(
Learning Environments
science classro .
WAIER R om enwronmenrs P erth, Australia. esearch Forum for the earch. Journal 0
·•c
J ross-Cultural
lrP''"'"·-'.JWhat is Happening in this at the annual meeting of CA.
teacher behavior and school you know wh
12) L at you look like? . ondon, England: Fa!mer
_Ap~il).
Associations betweenIn the classroom p R esearch Association · aper
(What Research Says Key Centre for School Gabel (Ed ) u
N · ' Handbook of
ew york: Macmillan. and determinants In education (pp. 527
-6
4).onal studies of sc. Ience In M.Quigley (Ed) Development. (pp.
76:
val~dation and use of
Instrument. Pape.r
on Rese1r~,.;1 Association
'
'
Ida Karnasih & Wahyudi
Fraser, B., & Walberg, H. (Eds.). (1991). Educational environments: Evaluation, antecedents and consequences. Oxford: Pergamon Press.
Getzel, J. W., & Thelen, H. A. (1960). The classroom group as a unique social system. (Vol. 59): National Society for Studies in Education.
Hunus, R., & Fraser, B. J. (1997). Chemistry learning Environment in Brunei Darussallam's Secondary Schools. In T. Rickards (Ed.), Science, Mathematics and Technology Education and national Development: Proceedings of the Vietnam Conference (pp.
1 08-120). Hanoi, Vietnam.
Khine, M. S., & Fisher, D. L. (2001, December). Classroom environment and teacher's cultural background in secondary science classes in Asian context. Paper presented at the International Educational Research Conference of Australian association of Research in Education, Perth.
Khoo, H., & Fraser, B. J. (1998). Using classroom environment dimensions in the evaluation of adult computer courses. Paper presented at the annual meeting of the National Association for Research in Science Teaching, San Diego, CA.
Kim, H., Fisher, D., & Fraser, B. J. (2000). Classroom environment and teacher interpersonal behaviour in secondary classes in Korea. Evaluation and Research in Education, 14,
3-22.
Leary, T. (1957). An interpersonal diagnosis of personality. New York: Ronald-Press Company.
McRobbie, C. J., & Fraser, B. J. (1993). Associations between student outcomes and psychosocial science environment. Journal of Educational Research, 87, 78-85. Rawnsley, D. G. (1997). Associations between classroom learning environments, teacher
interpersonal behaviours and student outcomes in secondary mathematics classrooms. Unpublished doctoral thesis, Curtin University of Technology, Perth, Western Australia
Santiboon, T. (2007). Associations between Students' Perceptions in Laboratory Learning Environments and Teacher Interpersonal Behaviours in Physics Classes in Thailand. Paper presented at The 1st International Conference on Educational Reform 2007 November 9-11,2007, Mahasarakham University, Thailand.
Taylor, P., Fraser, B., & Fisher, D. (1997). Monitoring constructivist classroom learning environments. international Journal of Educational Research, 27(4), 293-302. Teh, G., & Fraser, B. (1995). Development and validation of an instrument for assessing the
psychosocial environment of computer-assisted learning classrooms. Journal of Educational Computing Research, 12, 177-193.
Wahyudi. (2004). Educational practice and learning environments in rural and urban lower secondary science classrooms in Kalimantan Selatan Indonesia. Unplished doctoral thesis, Curtin University of Technology: Perth, Australia.
Waldrip, B. and Fisher, D. (2002). Student-teacher interactions and better science teachers.
Queensland Journal of Educational Research, 18(2), 141-163.
http:/ I education.curtin.edu.au/iier/ qjer/ qjer 18/waldrip.html
Watzlawick, P., Beavin, J., & Jackson, D. (1967). The pragmatics of human communication. New York: Norton.
Wubbels, T. (1993). Teacher-student relationships in science and mathematics classes (What research says to the science and mathematics teacher, No. 11). Perth: National Key Centre for School Science and Mathematics, Curtin University of Technology. Wubbels, T., Brekelmans, M. (1998), "The teacher factor in the social climate of the
Wubbels, T., Brekelmans, M., & Hooymayers, H. (1991). Interpersonal teacher behavior in the classroom. In B. Fraser & H. Walberg (Eds.), Educational environments. Evaluation, antecedents and consequences, (pp. 141-160). Oxford: Pergamon Press. Wubbels, T., Creton, H., & Holvast, A. (1988). Undesirable classroom situations
Interchange, 19,25-40.
Wubbels, T., Creton, H., & Hooymayers, H. (1985, April). Discipline problems ofbeginning teachers. Paper presented at annual meeting of American Educational Research Association, Chicago, IL.
Wubbels, T., & Levy, J. (1991). A comparison of interpersonal behaviour of Dutch and American teachers. International Journal of Intercultural Relations, 15, 1-18. Wubbels, T., & Levy, J. (Eds.). (1993). Do you know what you look like? Interpersonal
relationships in education. London, England: Falmer Press.
The Question
. n Teacher Int€ The Questionnalre o
f teacher. For e behaviour o your
d. to how you value correspon mg
t in both the Actua per statemen
5 = Almost Alway 4= Often
3 = Sometimes 2 =Seldom
1 = Almost Nevel
subject.
h. k your teacher almc If you t m
the actual column. If you pt her/his subject, circle the 5 at h. h are in between. and4 w lC
2 This teacher explams 3 This teacher holds our 1
4 This teacher knows eve
classroom.
5
6 This teacher acts conf1
7
Learning£ .
nv,ronnlents
1). Interp
(Ed
ersona]
teacher b .s.),
Educat.ehavior in
41 1 tonal .
- 60). Oxford· p enVironments· Undesirable !. .
ergamon
Pres .c assroom . · Situations
Disci~Iine
problems
.
Amen canEd
.
ofbegmning
ucationaJ
R
esearch
behaviour
of DRelations
15 1
utch
and ' ' -18you look like? .
Press.
.
InterpersonalIda Karnasih & Wahyudi
Appendix A
The Questionnaire on Teacher Interaction (QTI)
The Questionnaire on Teacher Interaction (QTI) consists of 48 item asks you to describe the behaviour of your teacher. For each statement, draw a circle around the specific numeric value corresponding to how you feel about each statement. Please circle only ONE value per statement in both the Actual and Ideal/Preferred sections.
For example:
subject.
5 = Almost Always 4= Often
3 = Sometimes 2 =Seldom 1 =Almost Never
If you think your teacher almost never talks enthusiastically about her/his subject, circle the 1 at the actual column. If you preferred that teacher should always talks enthusiastically about her/his subject, circle the 5 at Ideal/Preferred column. You also can choose the number 2, 3 and 4 which are in between.
No : -.; .·,:~~) Statement ~··· ._::. · '-~_;--~ · ·;·
'i!"i
~ Actuai -~ ~;if.", ·~~ Ideal/Preferred · ... ~t ~ O - ' : , ~, ... -'*'~"'l)_r~!:.t~:.., -~' "~.t ...:"'* ; ..
:_.;~ ~ ~~-~·"" !J---~- J:~~·;.(·,.· ~ ... ~;_· .. 00 ~t .. ~,·- M1 This teacher talks enthusiastically about her/his 1 2 3 4 5 1 2 3 4 5 subject.
2 This teacher explains things clearly. 1 2 3 4 5 1 2 3 4 5
3 This teacher holds our attention. 1 2 3 4 5 1 2 3 4 5
4 This teacher knows everything that goes on in the 1 2 3 4 5 1 2 3 4 5 classroom.
5 This teacher is a good leader. 1 2 3 4 5 1 2 3 4 5
6 This teacher acts confidently. I 2 3 4 5 1 2 3 4 5
7 This teacher helps us with our work. 1 2 3 4 5 1 2 3 4 5
I~
i~·'ii;,;,;:·~-...,p.: c:nmr fR .• I rir~HJ :.l7ol I9 This teacher is someone we can depend on. 1 2 3 4 5 1 2 3 4 5 10 This teacher has a sense of humor. 1 2 3 4 5 1 2 3 4 5 11 This teacher can take a joke. 1 2 3 4 5 1 2 3 4 5 12 This teacher's class is pleasant. l 2 3 4 5 1 2 3 4 5
13 This teacher truts us. l 2 3 4 5 l 2 3 4 5 14 If we don't agree with this teacher, we can talk l 2 3 4 5 l 2 3 4 5
about it.
15 This teacher is willing to explain things again. 1 2 3 4 5 1 2 3 4 5 16 If we have something to say, this teacher will l 2 3 4 5 l 2 3 4 5
listen.
17 This teacher realizes we do not understand. l 2 3 4 5 1 2 3 4 5 18 This teacher is patient. 1 2 3 4 5 1 2 3 4 5
19 We can decide some things in this teacher's class. 1 2 3 4 5 1 2 3 4 5 20 We can influence this teacher. 1 2 3 4 5 1 2 3 4 5 21 This teacher lets us fool around in class. 1 2 3 4 ~ 1 2 3 4 5 22 This teacher lets us get away with a lot in class. 1 2 3 4 5 1 2 3 4 5 23 This teacher gives us a lot of free time in this class. .I 2 3 4 5 1 2 3 4 5 24 This teacher is lenient. 1 2 3 4 5 I 2 3 4 5
25 This teacher seems uncertain. 1 2 3 4 5 1 2 3 4 5 26 This teacher is hesistant. I 2 3 4 5 1 2 3 4 5 27 This teacher acts as if she/he does not know what 1 2 3 4 5 1 2 3 4 5
to do.
28 This teacher let us boss him/her around. 1 2 .3 4 5 1 2 3 4 5 29 This teacher is not sure what to do when we fool 1 2 3 4 5 1 2 3 4 5
around.
30 It is easy to make a fool out of this teacher. 1 2 3 4 5 1 2 3 4 5
31 This teacher thinks that we cheat. 1 2 3 4 5 1 2 3 4 5 32 This teacher thinks that we don't know anything. l 2 3 4 5 1 2 3 4 5 33 This teacher puts us down. 1 2 3 4 5 l 2 3 4 5 34 This teacher thinks that we cannot do things well. 1 2 3 4 5 l 2 3 4 5
35 36
37 38
39
This teacher is suspicious.
gry unexpectt This teacher gets an
This teacher gets an gry quickly. . ick to corre This teacher IS too qu
break a rule.
40 This teacher is impatient. . k fight whit thit 4 1 It is easy to piC a I
42 This teacher is sarcastic.
43 This teacher is strict.
44 We have to be silent in this tea
45 This teacher's tests are hard. 46
' dards are vt This teacher s stan
35 This teacher seems dissatisfied. 36 This teacher is suspicious.
137 This teacher gets angry unexpectedly. 38 This teacher gets angry quickly.
39 This teacher is too quick to correct us when we break a rule.
40 This teacher is impatient.
41 It is easy to pick a fight whit this teacher. 42 This teacher is sarcastic.
43 This teacher is strict.
44 We have to be silent in this teacher' s class. 45 This teacher's tests are hard.
46 This teacher' s standards are very high. 47 This teacher is severe when marking papers. 48 We are afraid of this teacher.
Ida Karnasih & Wahyudi
k
'~,r~Wll'
~~~c/;·t.~[;;fl~~~'W7'1ll'il
15
1 2 3 4 5 1 2 3 4 1 2 3 4 5 1 2 3 4 51 2 3 4 5 1 2 3 4 5
I 2 3 4 5 1 2 3 4 5 I 2 3 4 5 1 2 3 4 5 1 2 3 4 5 1 2 3 4 5
1 2 3 4 5 1 2 3 4 5 1 2 3 4 5 1 2 3 4 5
1 2 3 4 5 1 2 3 4 5 I 2 3 4 5 1 2 3 4 5
1 2 3 4 5 1 2 3 4 5
1 2 3 4 5 1 2 3 4 5
Appendix B
What Is Happening In this Classroom (WIHIC) Questionnaire
Directions
This questionnaire has 42 sentences and asks you to describe your classroom learning environment. This is NOT a test. Your opinion is what is wanted.
For each statement, draw a circle around the specific numeric value corresponding to how you feel about each statement. Please circle only ONE value per statement in both the
Actual and IdeaVPreferred sections.
For example:
me
4 =Almost Always 3 =Often
2 = Sometimes
1 =Seldom 0 =Almost Never
If you think that your teacher never moves about the class to talk with you, circle the 0 at the actual column. If you preferred that teacher should always help you when you have trouble with the work, circle the 4 at Ideal/Preferred column. You also can choose the number 1, 2, and 3 which are in between.
2 I know other students in this class 0 2 3 4 0
3 I am friendly to members of this class 0 2 3 4 0
4 Members of the class are my friends 0 2 3 4 0
5 I work well with other class members 0 2 3 4 0
6 Students in this class like me 0 2 3 4 0
7 The teacher takes a person
8 The teacher goes out of hi 9 The teacher considers my 10 The teacher helps me whl
the work
11 The teacher is interested
12 The teacher moves abou' me
13 I discuss ideas in class
14 I give my opinion durin 15 The teacher asks me qu
16 I ask the teacher questi
17 I explain my ideas to c
18 I am asked to explain
19 I carry out investigati 20 I am asked to think al
statements
21 I explain the meanin and graphs
22 I carry out investiga puzzle me
23 I carry out investig; questions
24 I find out the answ investigations
25 I do as much as I
Classrooms Le .
arnmg Enl'ironmem
Ida Karnasih & Wahyudi B
~ "- Iii " '.;)-~,·:· II!NoJJJ . ·;' ifl\1 l'l -~, Ill{ .. 'ill
.,_
(WIHIC) Q .
uestJOnnaire !j The teacher takes a personal interest in me 0 1 2 3 4 0 1 2 3 4
iS The teacher goes out of his I her way to help me 0 1 2 3 4 0 1 2 3 4
to describe
your classroom I
cammg
9 The teacher considers my feelings 0 1 2 3 4 0 1 2 3 4
10 The teacher helps me when I have trouble with 0 I 2 3 4 0 1 2 3 4
the work
numeric value co
rresponding to h
value ow
per statement . b m oth the
II The teacher is interested in my problems 0 1 2 3 4 0 1 2 3 4
12 The teacher moves about the class to talk with 0 1 2 3 4 0 1 2 3 4
me
13 I discuss ideas in class 0 1 2 3 4 0 1 2 3 4
14 I give my opinion during the class discussions 0 1 2 3 4 0 1 2 3 4
15 The teacher asks me questions 0 1 2 3 4 0 I 2 3 4
16 I ask the teacher questions 0 I 2 3 4 0 1 2 3 4
17 I explain my ideas to other students 0 I 2 3 4 0 1 2 3 4
18 I am asked to explain how I sol":e problems 0 1 2 3 4 0 1 2 3 4
19
i
carry out investigations to test my ideas 0 1 2 3 4 0 I 2 3 4 20 I am asked to think about the evidence for my 0 1 2 3 4 0 1 2 3 4talk with .
you, CJTcle the 0 at th
hcl e
p you when you h
ave trouble
statements
21 I explain the meaning of statement, diagram, 0 1 2 3 4 0 I 2 3 4
can choose the num ber 1 2
' '
and graphs
22 I carry out investigation to answer question that 0 I 2 3 4 0 1 2 3 4
puzzle me
23 I carry out investigations to answer the teachers' 0 1 2 3 4 0 1 2 3 4
questions
24 I find out the answers to questions by doing 0 I 2 3 4 0 1 2 3 4
investigations
25 I do as much as I set out to do 0 1 2 3 4 0 I 2 3 4
I~
-
~~:
mmm
ll'i~'Hitl'i:27 I am ready to start this class on time 0 I 2 3 4 0 I 2 28 I pay attention during